Politics
Mapped: The Top Trading Partner of Every U.S. State
The Top Trading Partner of Every U.S. State
The U.S. is highly dependent—perhaps unsurprisingly—on Canada and Mexico for trade. The country’s top trading partner is Mexico, making up 14.8% of total trade.
However, the country’s neighbors to the north and south are not the only trade partners that U.S. states rely heavily upon. This map from HowMuch.net uses flags to show which country each U.S. state is importing the most from. Below, there is an additional graphic showing where each state is exporting the highest amount of goods and services to.
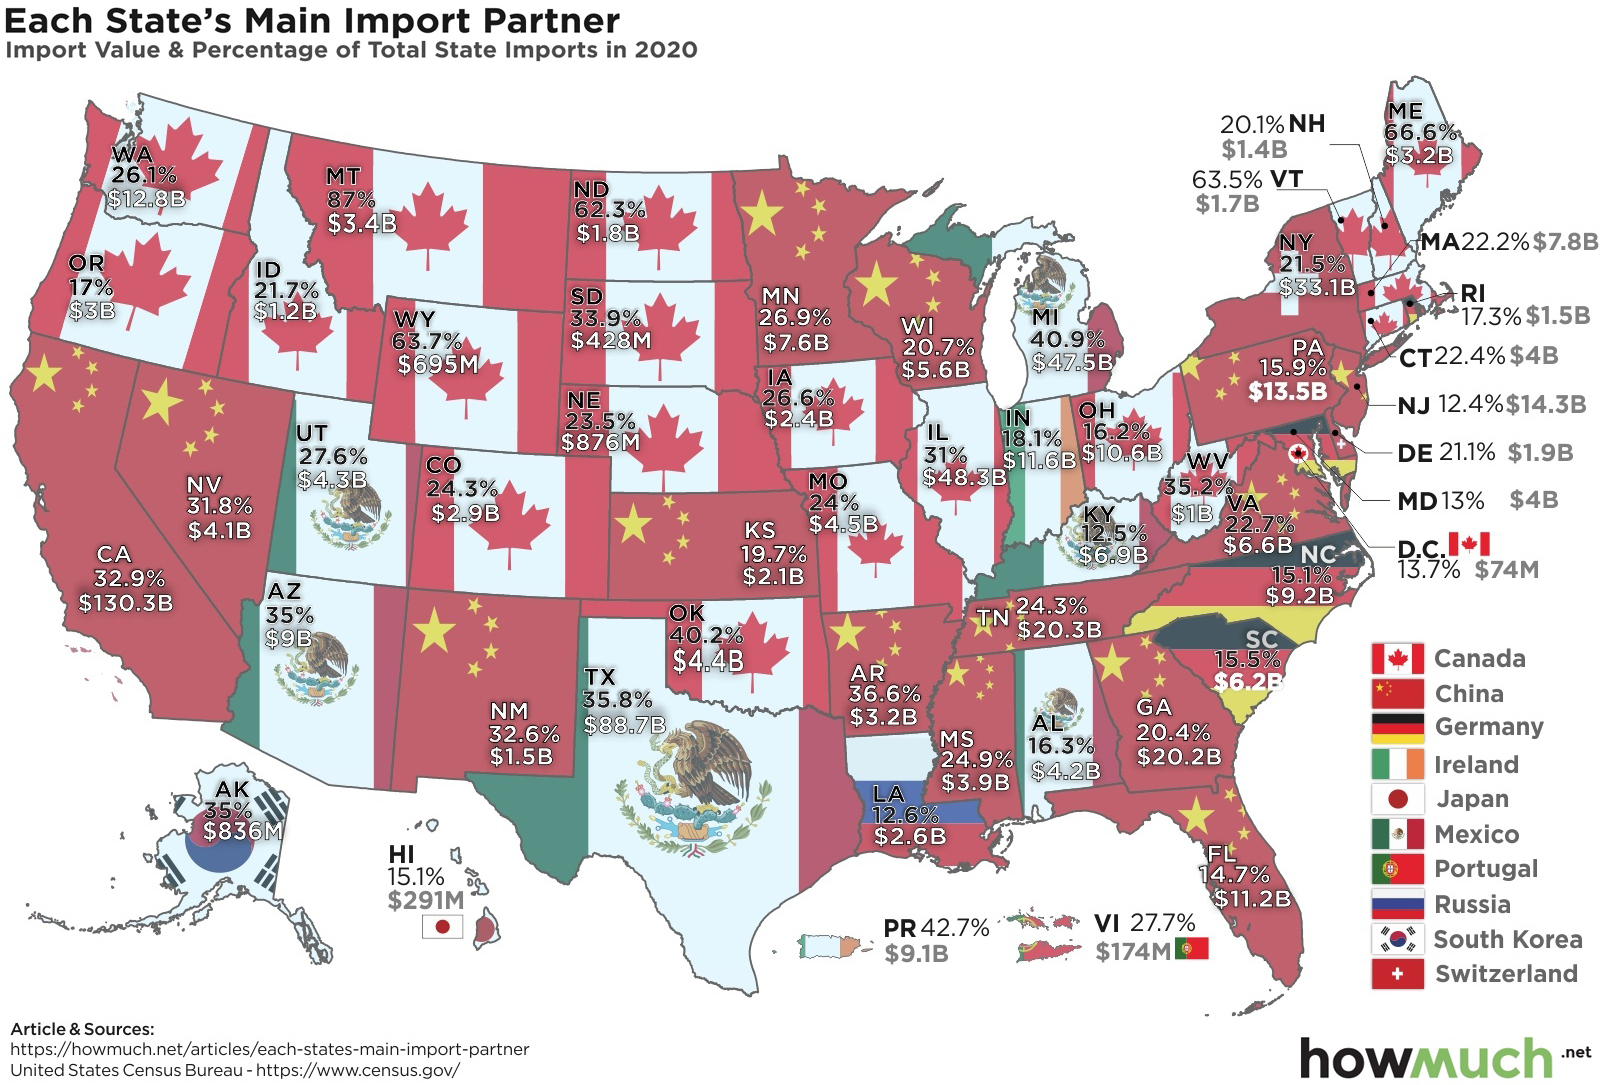
Who are the States Importing From?
The U.S. has a few natural and obvious trading partners, whether due to geographical closeness or strong economic ties.
The obvious candidates for top trading partners have already been mentioned, Canada and Mexico—and these two do show up at the state level as well. For example, Michigan gets 40.9% of its imports from Mexico, and Montana receives a whopping 87% of its imports from Canada.
Some other interesting trade partnerships stand out, like the Carolinas and Germany. Trade ties between Hawaii and Japan also make sense for historic reasons.
| State | Top Country | Total State Import (Millions USD) | Share of Total State Imports |
|---|---|---|---|
| Alabama | 🇲🇽 Mexico | $4,161 | 16.3% |
| Alaska | 🇰🇷 South Korea | $836 | 35.0% |
| Arizona | 🇲🇽 Mexico | $8,978 | 35.0% |
| Arkansas | 🇨🇳 China | $3,160 | 36.6% |
| California | 🇨🇳 China | $130,291 | 32.9% |
| Colorado | 🇨🇦 Canada | $2,928 | 24.3% |
| Connecticut | 🇨🇦 Canada | $4,031 | 22.4% |
| Delaware | 🇨🇭 Switzerland | $1,927 | 21.1% |
| District of Columbia | 🇨🇦 Canada | $74 | 13.7% |
| Florida | 🇨🇳 China | $11,212 | 14.7% |
| Georgia | 🇨🇳 China | $20,194 | 20.4% |
| Hawaii | 🇯🇵 Japan | $291 | 15.1% |
| Idaho | 🇨🇦 Canada | $1,195 | 21.7% |
| Illinois | 🇨🇳 China | $48,324 | 31.0% |
| Indiana | 🇮🇪 Ireland | $11,558 | 18.1% |
| Iowa | 🇨🇦 Canada | $2,387 | 26.6% |
| Kansas | 🇨🇳 China | $2,064 | 19.7% |
| Kentucky | 🇲🇽 Mexico | $6,882 | 12.5% |
| Louisiana | 🇷🇺 Russia | $2,611 | 12.6% |
| Maine | 🇨🇦 Canada | $3,167 | 66.6% |
| Maryland | 🇩🇪 Germany | $3,993 | 13.0% |
| Massachusetts | 🇨🇦 Canada | $7,779 | 22.2% |
| Michigan | 🇲🇽 Mexico | $47,473 | 40.9% |
| Minnesota | 🇨🇳 China | $7,577 | 26.9% |
| Mississippi | 🇨🇳 China | $3,938 | 24.9% |
| Missouri | 🇨🇦 Canada | $4,500 | 24.0% |
| Montana | 🇨🇦 Canada | $3,442 | 87.0% |
| Nebraska | 🇨🇦 Canada | $876 | 23.5% |
| Nevada | 🇨🇳 China | $4,108 | 31.8% |
| New Hampshire | 🇨🇦 Canada | $1,394 | 20.1% |
| New Jersey | 🇨🇳 China | $14,302 | 12.4% |
| New Mexico | 🇨🇳 China | $1,493 | 32.6% |
| New York | 🇨🇭 Switzerland | $33,126 | 21.5% |
| North Carolina | 🇩🇪 Germany | $9,208 | 15.1% |
| North Dakota | 🇨🇦 Canada | $1,781 | 62.3% |
| Ohio | 🇨🇦 Canada | $10,624 | 16.2% |
| Oklahoma | 🇨🇦 Canada | $4,355 | 40.2% |
| Oregon | 🇨🇦 Canada | $2,951 | 17.0% |
| Pennsylvania | 🇨🇳 China | $13,470 | 15.9% |
| Puerto Rico | 🇮🇪 Ireland | $9,062 | 42.7% |
| Rhode Island | 🇩🇪 Germany | $1,525 | 17.3% |
| South Carolina | 🇩🇪 Germany | $6,220 | 15.5% |
| South Dakota | 🇨🇦 Canada | $428 | 33.9% |
| Tennessee | 🇨🇳 China | $20,305 | 24.3% |
| Texas | 🇲🇽 Mexico | $88,726 | 35.8% |
| Utah | 🇲🇽 Mexico | $4,294 | 27.6% |
| Vermont | 🇨🇦 Canada | $1,677 | 63.5% |
| Virginia | 🇨🇳 China | $6,566 | 22.7% |
| Virgin Islands | 🇵🇹 Portugal | $174 | 27.7% |
| Washington | 🇨🇦 Canada | $12,772 | 26.1% |
| West Virginia | 🇨🇦 Canada | $1,025 | 35.2% |
| Wisconsin | 🇨🇳 China | $5,554 | 20.7% |
| Wyoming | 🇨🇦 Canada | $695 | 63.7% |
However, one country in particular stands out on this map—China.
While the USMCA trade agreement has created an easy gateway for necessary goods and services to flow across North America, no country—not even the U.S.—can escape the need for mass imports from the world’s top exporter.
China and the U.S. have an imbalanced trade relationship, with China buying much fewer goods from the U.S. than the U.S. buys from them. In fact, China’s monthly trade surplus with the country sat at $31.8 billion as of May 2021.
Who are the States Exporting to?
After looking at the top import partners by state, let’s dive in to where the U.S. states are exporting the most.
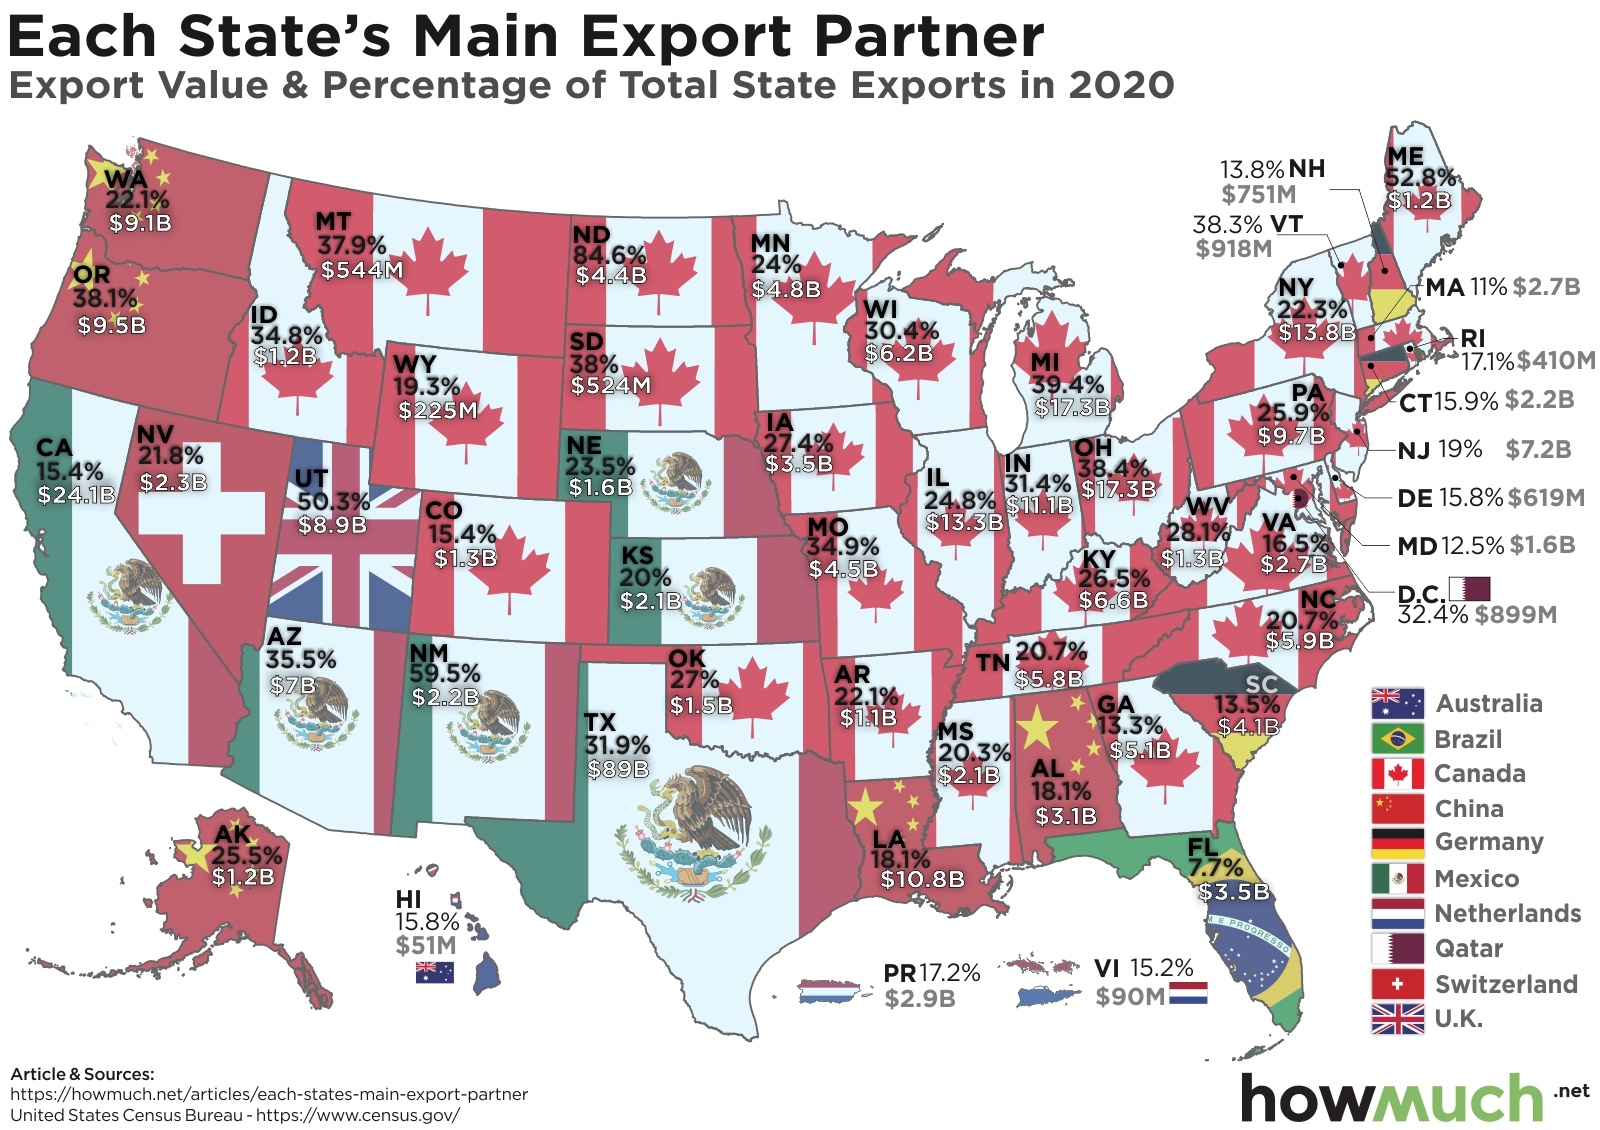
One thing that is noticeable is that China shows up much less on this map, further exemplifying the trade imbalance. In other words, while many states’ top import partner is China, they are not reciprocating as the country’s top export partner.
The only states that export their largest shares to China are:
- Oregon – 38.1%
- Alaska – 25.5%
- Washington – 22.1%
- Alabama – 18.1%
- Louisiana – 18.1%
The majority are exporting to their North American neighbors. For example, North Dakota sends 84.6% of its exports just across the northern border.
| State | Top Country | Total State Export (Millions USD) | Share of total State Exports |
|---|---|---|---|
| Alabama | 🇨🇳 China | $3,102 | 18.1% |
| Alaska | 🇨🇳 China | $1,176 | 25.5% |
| Arizona | 🇲🇽 Mexico | $36 | 35.5% |
| Arkansas | 🇨🇦 Canada | $1,148 | 22.1% |
| California | 🇲🇽 Mexico | $24,078 | 15.4% |
| Colorado | 🇨🇦 Canada | $1,278 | 15.4% |
| Connecticut | 🇩🇪 Germany | $2,189 | 15.9% |
| Delaware | 🇨🇦 Canada | $619 | 15.8% |
| D.C. | 🇶🇦 Qatar | $899 | 32.4% |
| Florida | 🇧🇷 Brazil | $3,538 | 7.7% |
| Georgia | 🇨🇦 Canada | $5,146 | 13.3% |
| Hawaii | 🇦🇺 Australia | $51 | 15.8% |
| Idaho | 🇨🇦 Canada | $1,184 | 34.8% |
| Illinois | 🇨🇦 Canada | $13,261 | 24.8% |
| Indiana | 🇨🇦 Canada | $11,080 | 31.4% |
| Iowa | 🇨🇦 Canada | $3,460 | 27.4% |
| Kansas | 🇲🇽 Mexico | $2,078 | 20.0% |
| Kentucky | 🇨🇦 Canada | $6,550 | 26.5% |
| Louisiana | 🇨🇳 China | $10,779 | 18.1% |
| Maine | 🇨🇦 Canada | $1,229 | 52.8% |
| Maryland | 🇨🇦 Canada | $1,581 | 12.5% |
| Massachusetts | 🇨🇦 Canada | $2,746 | 11.0% |
| Michigan | 🇨🇦 Canada | $17,341 | 39.4% |
| Minnesota | 🇨🇦 Canada | $4,828 | 24.0% |
| Mississippi | 🇨🇦 Canada | $2,082 | 20.3% |
| Missouri | 🇨🇦 Canada | $4,453 | 34.9% |
| Montana | 🇨🇦 Canada | $544 | 37.9% |
| Nebraska | 🇲🇽 Mexico | $1,639 | 23.5% |
| Nevada | 🇨🇭 Switzerland | $2,256 | 21.8% |
| New Hampshire | 🇩🇪 Germany | $751 | 13.8% |
| New Jersey | 🇨🇦 Canada | $7,229 | 19.0% |
| New Mexico | 🇲🇽 Mexico | $2,197 | 59.5% |
| New York | 🇨🇦 Canada | $13,773 | 22.3% |
| North Carolina | 🇨🇦 Canada | $5,881 | 20.7% |
| North Dakota | 🇨🇦 Canada | $4,388 | 84.6% |
| Ohio | 🇨🇦 Canada | $17,273 | 38.4% |
| Oklahoma | 🇨🇦 Canada | $1,452 | 27.0% |
| Oregon | 🇨🇳 China | $9,522 | 38.1% |
| Pennsylvania | 🇨🇦 Canada | $9,699 | 25.9% |
| Puerto Rico | 🇳🇱 Netherlands | $2,889 | 17.2% |
| Rhode Island | 🇨🇦 Canada | $410 | 17.1% |
| South Carolina | 🇩🇪 Germany | $4,082 | 13.5% |
| South Dakota | 🇨🇦 Canada | $524 | 38.0% |
| Tennessee | 🇨🇦 Canada | $5,818 | 20.7% |
| Texas | 🇲🇽 Mexico | $89,046 | 31.9% |
| Utah | 🇬🇧 United Kingdom | $8,906 | 50.3% |
| Vermont | 🇨🇦 Canada | $918 | 38.3% |
| Virginia | 🇨🇦 Canada | $2,717 | 16.5% |
| Virgin Islands | 🇳🇱 Netherlands | $90 | 15.2% |
| Washington | 🇨🇳 China | $9,126 | 22.1% |
| West Virginia | 🇨🇦 Canada | $1,283 | 28.1% |
| Wisconsin | 🇨🇦 Canada | $6,226 | 30.4% |
| Wyoming | 🇨🇦 Canada | $225 | 19.3% |
Trade Going Forward
The trade war that started during the tenure of former U.S. president Donald Trump is still ongoing and tariffs set by the U.S. are not expected to be lifted by president Joe Biden, as tensions have expanded beyond just trade issues.
These tariffs, however, have not helped to rectify the significant trade imbalance between the two countries. The states are still extremely reliant on imports from China, and it is not a reciprocal relationship.


Economy
The Bloc Effect: International Trade with Geopolitical Allies on the Rise
Rising geopolitical tensions are shaping the future of international trade, but what is the effect on trading among G7 and BRICS countries?


The Bloc Effect: International Trade with Allies on the Rise
International trade has become increasingly fragmented over the last five years as countries have shifted to trading more with their geopolitical allies.
This graphic from The Hinrich Foundation, the first in a three-part series covering the future of trade, provides visual context to the growing divide in trade in G7 and pre-expansion BRICS countries, which are used as proxies for geopolitical blocs.
Trade Shifts in G7 and BRICS Countries
This analysis uses IMF data to examine differences in shares of exports within and between trading blocs from 2018 to 2023. For example, we looked at the percentage of China’s exports with other BRICS members as well as with G7 members to see how these proportions shifted in percentage points (pp) over time.
Countries traded nearly $270 billion more with allies in 2023 compared to 2018. This shift came at the expense of trade with rival blocs, which saw a decline of $314 billion.
Country Change in Exports Within Bloc (pp) Change in Exports With Other Bloc (pp)
🇮🇳 India 0.0 3.9
🇷🇺 Russia 0.7 -3.8
🇮🇹 Italy 0.8 -0.7
🇨🇦 Canada 0.9 -0.7
🇫🇷 France 1.0 -1.1
🇪🇺 EU 1.1 -1.5
🇩🇪 Germany 1.4 -2.1
🇿🇦 South Africa 1.5 1.5
🇺🇸 U.S. 1.6 -0.4
🇯🇵 Japan 2.0 -1.7
🇨🇳 China 2.1 -5.2
🇧🇷 Brazil 3.7 -3.3
🇬🇧 UK 10.2 0.5
All shifts reported are in percentage points. For example, the EU saw its share of exports to G7 countries rise from 74.3% in 2018 to 75.4% in 2023, which equates to a 1.1 percentage point increase.
The UK saw the largest uptick in trading with other countries within the G7 (+10.2 percentage points), namely the EU, as the post-Brexit trade slump to the region recovered.
Meanwhile, the U.S.-China trade dispute caused China’s share of exports to the G7 to fall by 5.2 percentage points from 2018 to 2023, the largest decline in our sample set. In fact, partly as a result of the conflict, the U.S. has by far the highest number of harmful tariffs in place.
The Russia-Ukraine War and ensuing sanctions by the West contributed to Russia’s share of exports to the G7 falling by 3.8 percentage points over the same timeframe.
India, South Africa, and the UK bucked the trend and continued to witness advances in exports with the opposing bloc.
Average Trade Shifts of G7 and BRICS Blocs
Though results varied significantly on a country-by-country basis, the broader trend towards favoring geopolitical allies in international trade is clear.
Bloc Change in Exports Within Bloc (pp) Change in Exports With Other Bloc (pp)
Average 2.1 -1.1
BRICS 1.6 -1.4
G7 incl. EU 2.4 -1.0
Overall, BRICS countries saw a larger shift away from exports with the other bloc, while for G7 countries the shift within their own bloc was more pronounced. This implies that though BRICS countries are trading less with the G7, they are relying more on trade partners outside their bloc to make up for the lost G7 share.
A Global Shift in International Trade and Geopolitical Proximity
The movement towards strengthening trade relations based on geopolitical proximity is a global trend.
The United Nations categorizes countries along a scale of geopolitical proximity based on UN voting records.
According to the organization’s analysis, international trade between geopolitically close countries rose from the first quarter of 2022 (when Russia first invaded Ukraine) to the third quarter of 2023 by over 6%. Conversely, trade with geopolitically distant countries declined.
The second piece in this series will explore China’s gradual move away from using the U.S. dollar in trade settlements.
Visit the Hinrich Foundation to learn more about the future of geopolitical trade

-

 Economy1 day ago
Economic Growth Forecasts for G7 and BRICS Countries in 2024
The IMF has released its economic growth forecasts for 2024. How do the G7 and BRICS countries compare?
-

 United States1 week ago
Ranked: The Largest U.S. Corporations by Number of Employees
We visualized the top U.S. companies by employees, revealing the massive scale of retailers like Walmart, Target, and Home Depot.
-

 Economy2 weeks ago
Where U.S. Inflation Hit the Hardest in March 2024
We visualized product categories that saw the highest % increase in price due to U.S. inflation as of March 2024.
-

 Economy4 weeks ago
G20 Inflation Rates: Feb 2024 vs COVID Peak
We visualize inflation rates across G20 countries as of Feb 2024, in the context of their COVID-19 pandemic peak.
-

 Economy1 month ago
Mapped: Unemployment Claims by State
This visual heatmap of unemployment claims by state highlights New York, California, and Alaska leading the country by a wide margin.
-

 Economy2 months ago
Confidence in the Global Economy, by Country
Will the global economy be stronger in 2024 than in 2023?


-

 Mining1 week ago
Gold vs. S&P 500: Which Has Grown More Over Five Years?
-

 Markets2 weeks ago
Ranked: The Most Valuable Housing Markets in America
-

 Money2 weeks ago
Which States Have the Highest Minimum Wage in America?
-

 AI2 weeks ago
Ranked: Semiconductor Companies by Industry Revenue Share
-

 Markets2 weeks ago
Ranked: The World’s Top Flight Routes, by Revenue
-

 Countries2 weeks ago
Population Projections: The World’s 6 Largest Countries in 2075
-

 Markets2 weeks ago
The Top 10 States by Real GDP Growth in 2023
-

 Demographics2 weeks ago
The Smallest Gender Wage Gaps in OECD Countries