Datastream
Ranked: The Top Online Music Services in the U.S. by Monthly Users


The Briefing
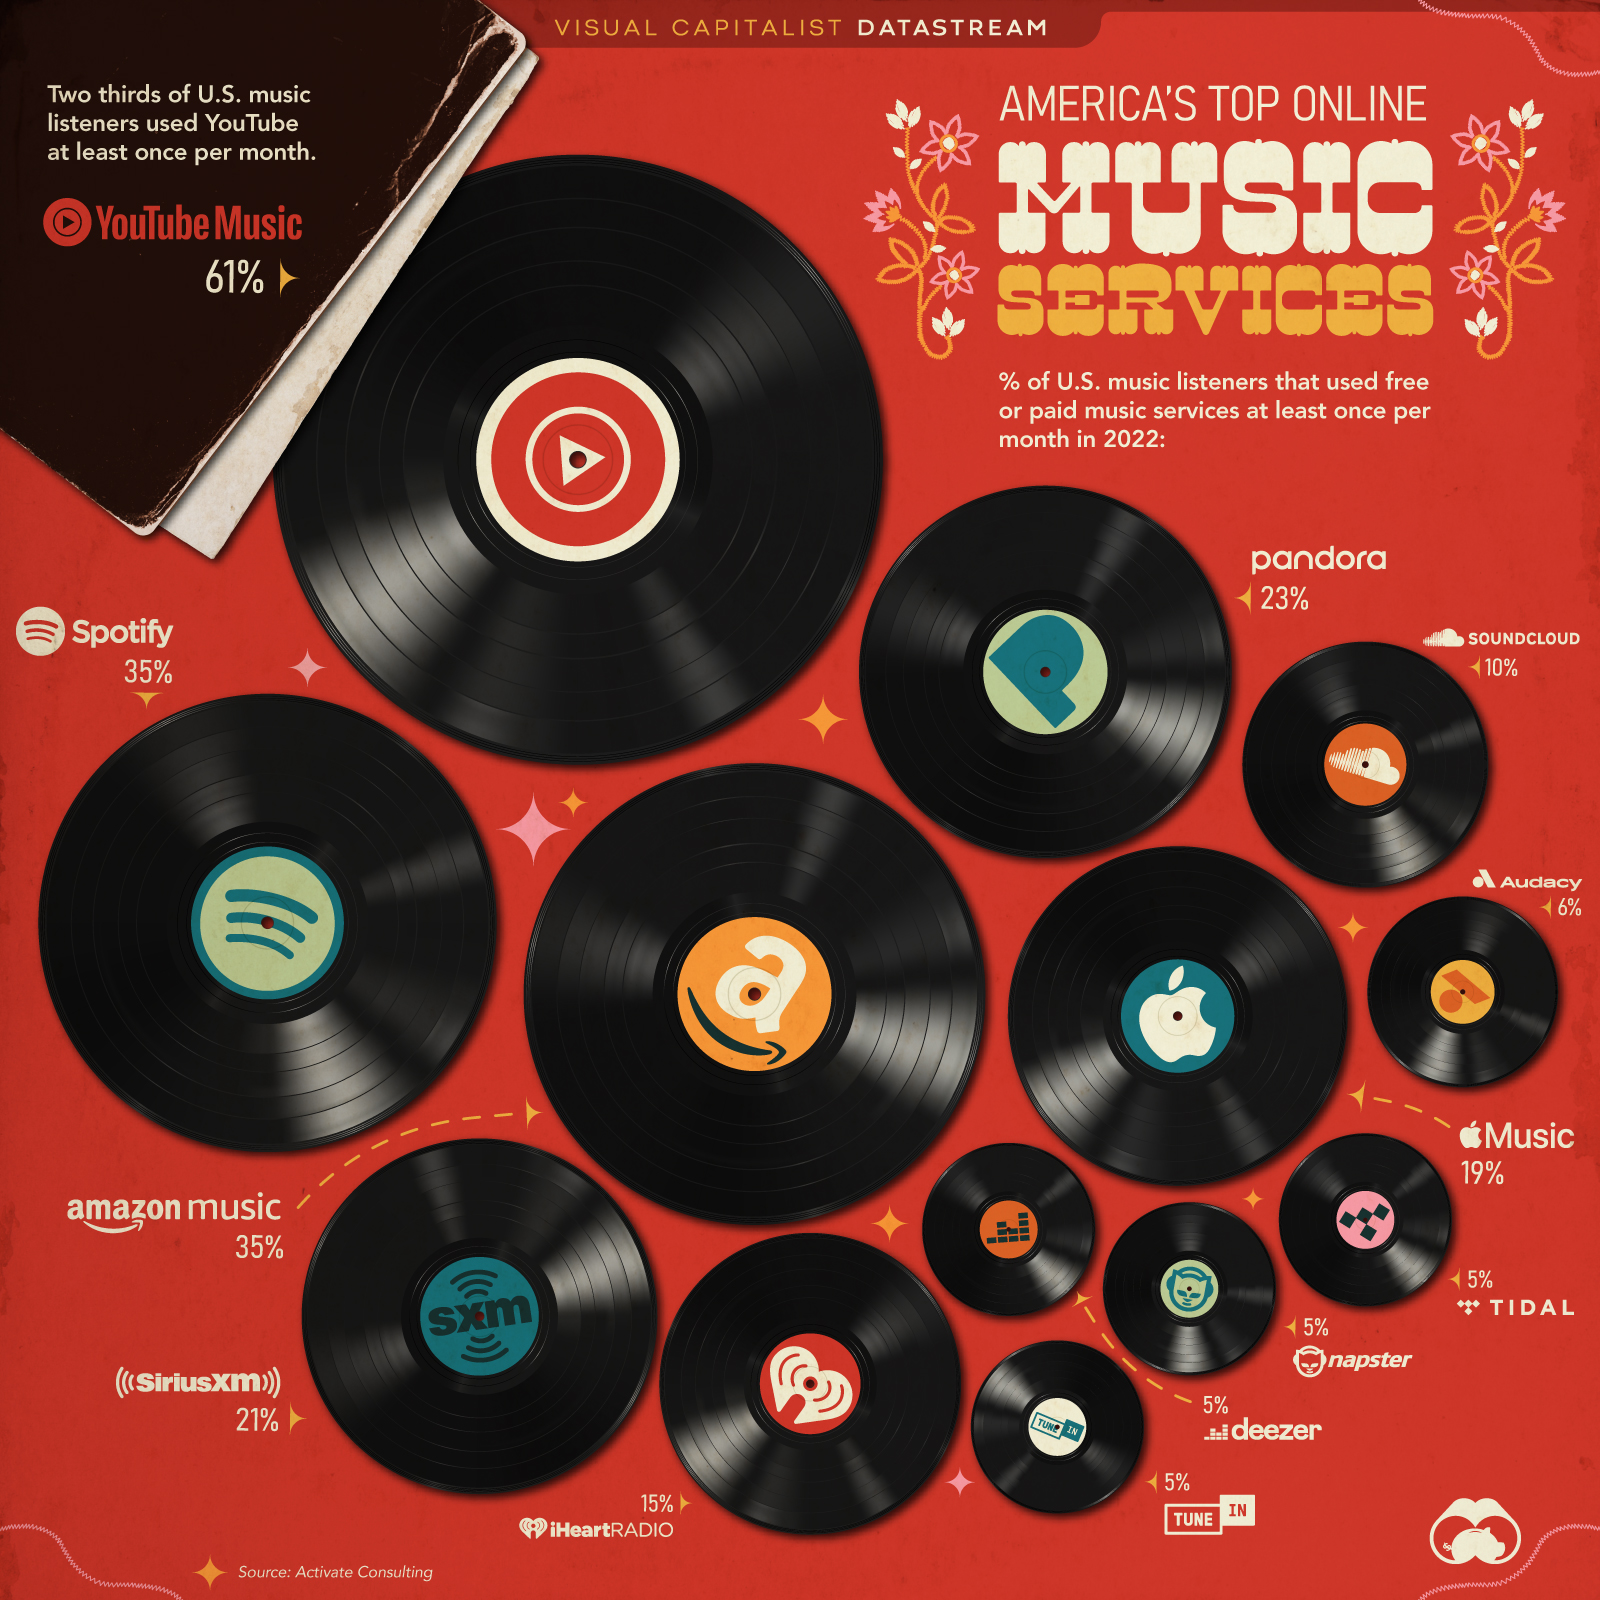
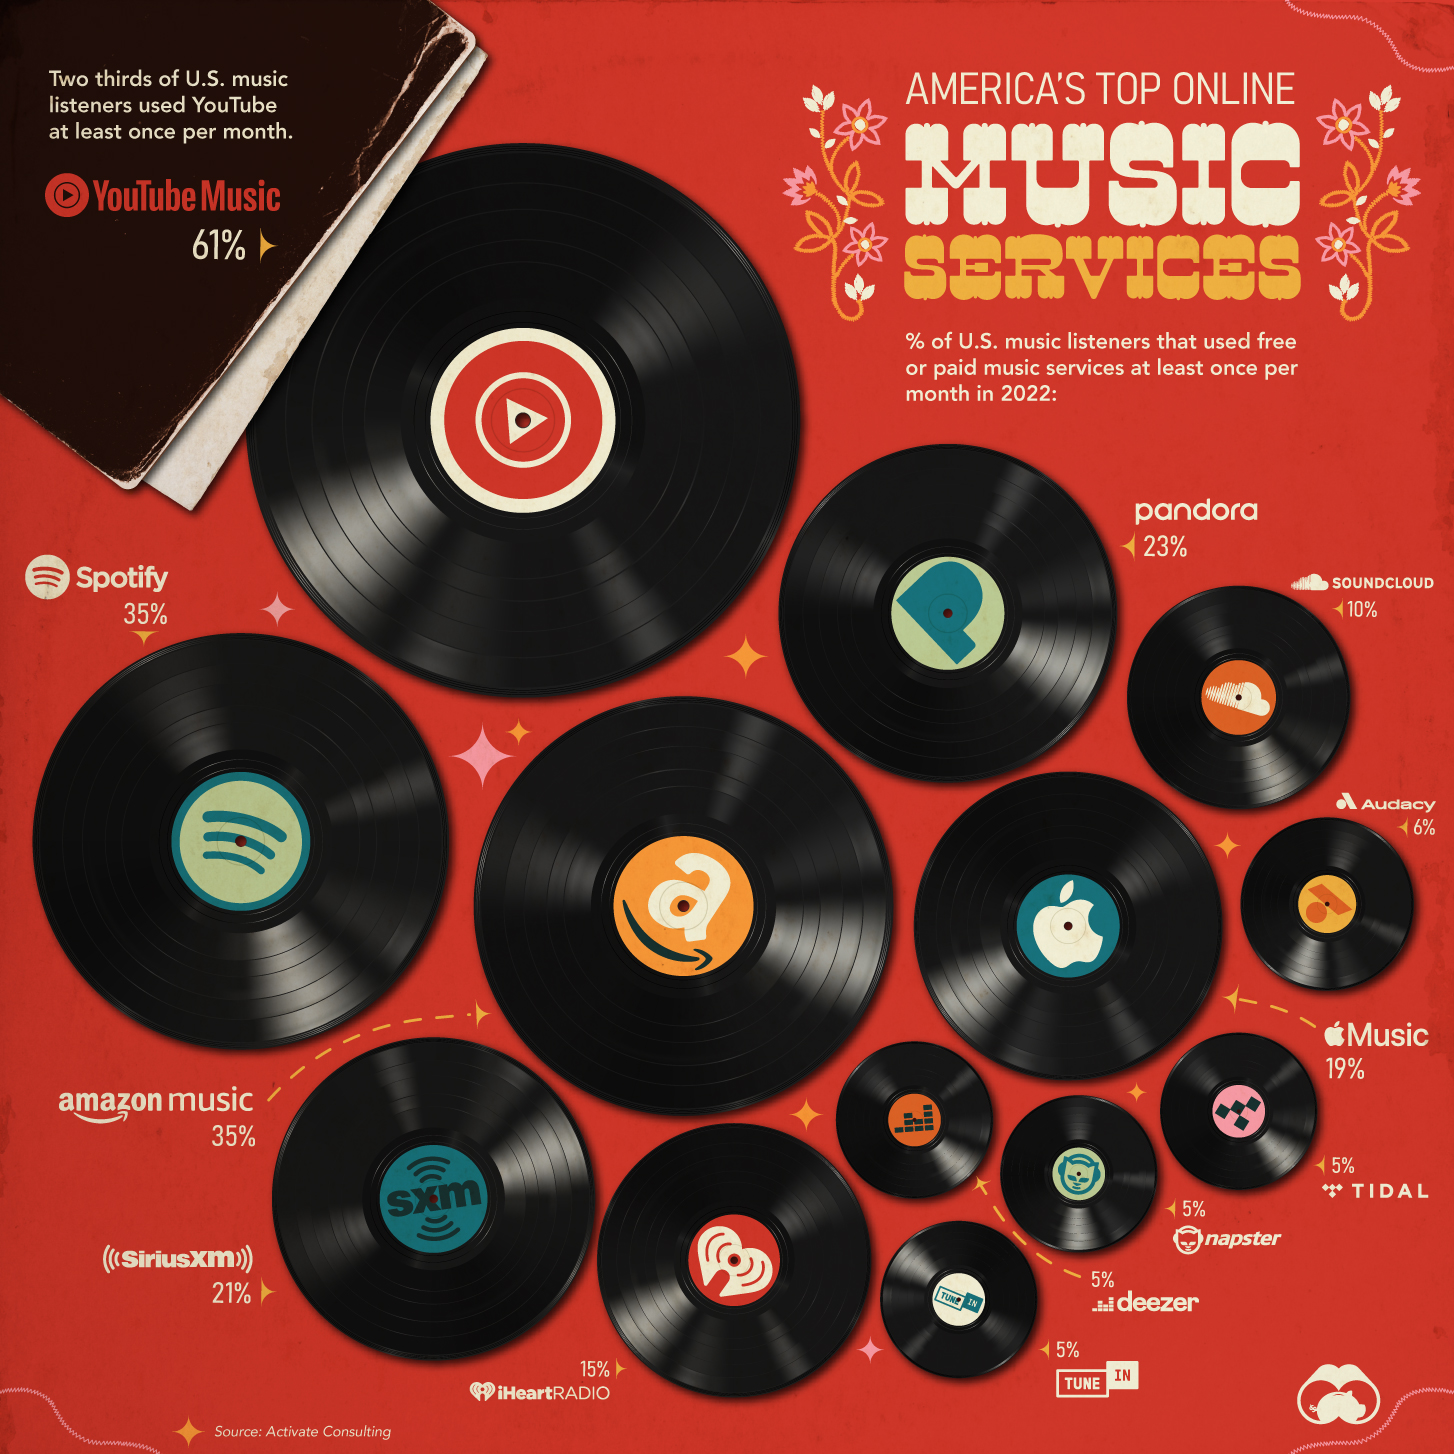
- Two-thirds of music listeners in the U.S. used YouTube at least once per month
- 64% of music listeners use multiple music services per month
The Top Online Music Services in the U.S.
The music streaming industry is characterized by fierce competition, with many companies vying for market share.
Companies are competing on multiple fronts, from price and features to advertising and exclusive content, making it a challenging market for companies to succeed in.
YouTube (the standard offering and YouTube Music) has the highest amount of users, attracting around two-thirds of music listeners in the U.S. during a given month. This is largely due to the YouTube’s massive reach and extensive catalog of music.
Here’s a full rundown of the top music streaming services in the U.S. by monthly listeners:
| Rank | Music Service | % of U.S. Music Listeners Who Use Monthly |
|---|---|---|
| #1 | YouTube | 61% |
| #2T | Spotify | 35% |
| #2T | Amazon Music | 35% |
| #4 | Pandora | 23% |
| #5 | SiriusXM | 21% |
| #6 | Apple Music | 19% |
| #7 | iHeartRadio | 15% |
| #8 | SoundCloud | 10% |
| #9 | Audacity | 6% |
| #10T | TuneIn | 5% |
| #10T | Deezer | 5% |
| #10T | Napster | 5% |
| #10T | Tidal | 5% |
Two companies are in the running for second place: Spotify and Amazon Music.
Spotify leads in one important metric: number of paid users. Meanwhile, Amazon Music has a large user base since the service is bundled into Prime—however, recent changes mean that without a premium subscription, shuffled playback is the primary option. Time will tell what impact those changes will have on the service’s market share.
Prices for premium music services are beginning to creep upward. Apple Music and Amazon Music raised their prices, and it’s rumored that Spotify will not be far behind. This move would be significant because, in the U.S., Spotify hasn’t raised its prices in over a decade.
Rising prices and more aggressive promotion of premium subscriptions could be a signal that music streaming services are transitioning from a focus on capturing market share to monetizing existing users.
Where does this data come from?
Source: Activate Technology and Media Outlook 2023 by Activate Consulting
Data note: “Music services” include free and paid services used for listening to music through any format excluding terrestrial radio. “Music listeners” are defined as adults aged 18+ who spend any time listening to music.


Datastream
Can You Calculate Your Daily Carbon Footprint?
Discover how the average person’s carbon footprint impacts the environment and learn how carbon credits can offset your carbon footprint.


The Briefing
- A person’s carbon footprint is substantial, with activities such as food consumption creating as much as 4,500 g of CO₂ emissions daily.
- By purchasing carbon credits from Carbon Streaming Corporation, you can offset your own emissions and fund positive climate action.
Your Everyday Carbon Footprint
While many large businesses and countries have committed to net-zero goals, it is essential to acknowledge that your everyday activities also contribute to global emissions.
In this graphic, sponsored by Carbon Streaming Corporation, we will explore how the choices we make and the products we use have a profound impact on our carbon footprint.
Carbon Emissions by Activity
Here are some of the daily activities and products of the average person and their carbon footprint, according to Clever Carbon.
| Household Activities & Products | CO2 Emissions (g) |
|---|---|
| 💡 Standard Light Bulb (100 watts, four hours) | 172 g |
| 📱 Mobile Phone Use (195 minutes per day)* | 189 g |
| 👕 Washing Machine (0.63 kWh) | 275 g |
| 🔥 Electric Oven (1.56 kWh) | 675 g |
| ♨️ Tumble Dryer (2.5 kWh) | 1,000 g |
| 🧻 Toilet Roll (2 ply) | 1,300 g |
| 🚿 Hot Shower (10 mins) | 2,000 g |
| 🚙 Daily Commute (one hour, by car) | 3,360 g |
| 🍽️ Average Daily Food Consumption (three meals of 600 calories) | 4,500 g |
| *Phone use based on yearly use of 69kg per the source, Reboxed | |
Your choice of transportation plays a crucial role in determining your carbon footprint. For instance, a 15 km daily commute to work on public transport generates an average of 1,464 g of CO₂ emissions. Compared to 3,360 g—twice the volume for a journey the same length by car.
By opting for more sustainable modes of transport, such as cycling, walking, or public transportation, you can significantly reduce your carbon footprint.
Addressing Your Carbon Footprint
One way to compensate for your emissions is by purchasing high-quality carbon credits.
Carbon credits are used to help fund projects that avoid, reduce or remove CO₂ emissions. This includes nature-based solutions such as reforestation and improved forest management, or technology-based solutions such as the production of biochar and carbon capture and storage (CCS).
While carbon credits offer a potential solution for individuals to help reduce global emissions, public awareness remains a significant challenge. A BCG-Patch survey revealed that only 34% of U.S. consumers are familiar with carbon credits, and only 3% have purchased them in the past.
About Carbon Streaming
By financing the creation or expansion of carbon projects, Carbon Streaming Corporation secures the rights to future carbon credits generated by these sustainable projects. You can then purchase these carbon credits to help fund climate solutions around the world and compensate for your own emissions.
Ready to get involved?
>> Learn more about purchasing carbon credits at Carbon Streaming

-

 Mining1 week ago
Gold vs. S&P 500: Which Has Grown More Over Five Years?
-

 Markets2 weeks ago
Ranked: The Most Valuable Housing Markets in America
-

 Money2 weeks ago
Which States Have the Highest Minimum Wage in America?
-

 AI2 weeks ago
Ranked: Semiconductor Companies by Industry Revenue Share
-

 Markets2 weeks ago
Ranked: The World’s Top Flight Routes, by Revenue
-

 Countries2 weeks ago
Population Projections: The World’s 6 Largest Countries in 2075
-

 Markets2 weeks ago
The Top 10 States by Real GDP Growth in 2023
-

 Demographics2 weeks ago
The Smallest Gender Wage Gaps in OECD Countries