Markets
Top U.S. Companies by Import and Export Volume
Nothing has transformed our economy quite like containerized shipping.
From Rotterdam to Singapore, we see tangible evidence of the world’s bustling maritime shipping network as cranes load and unload uniform containers in a flurry of activity. The efficiency of this system has massively impacted the global economy, but this uniformity has also had the unintended consequence of anonymizing shipping. From the outside looking in, there’s no indication of who’s actually doing the shipping.
Today’s graphic, using data from JOC, highlights the actual companies behind the United States’ import–export numbers.
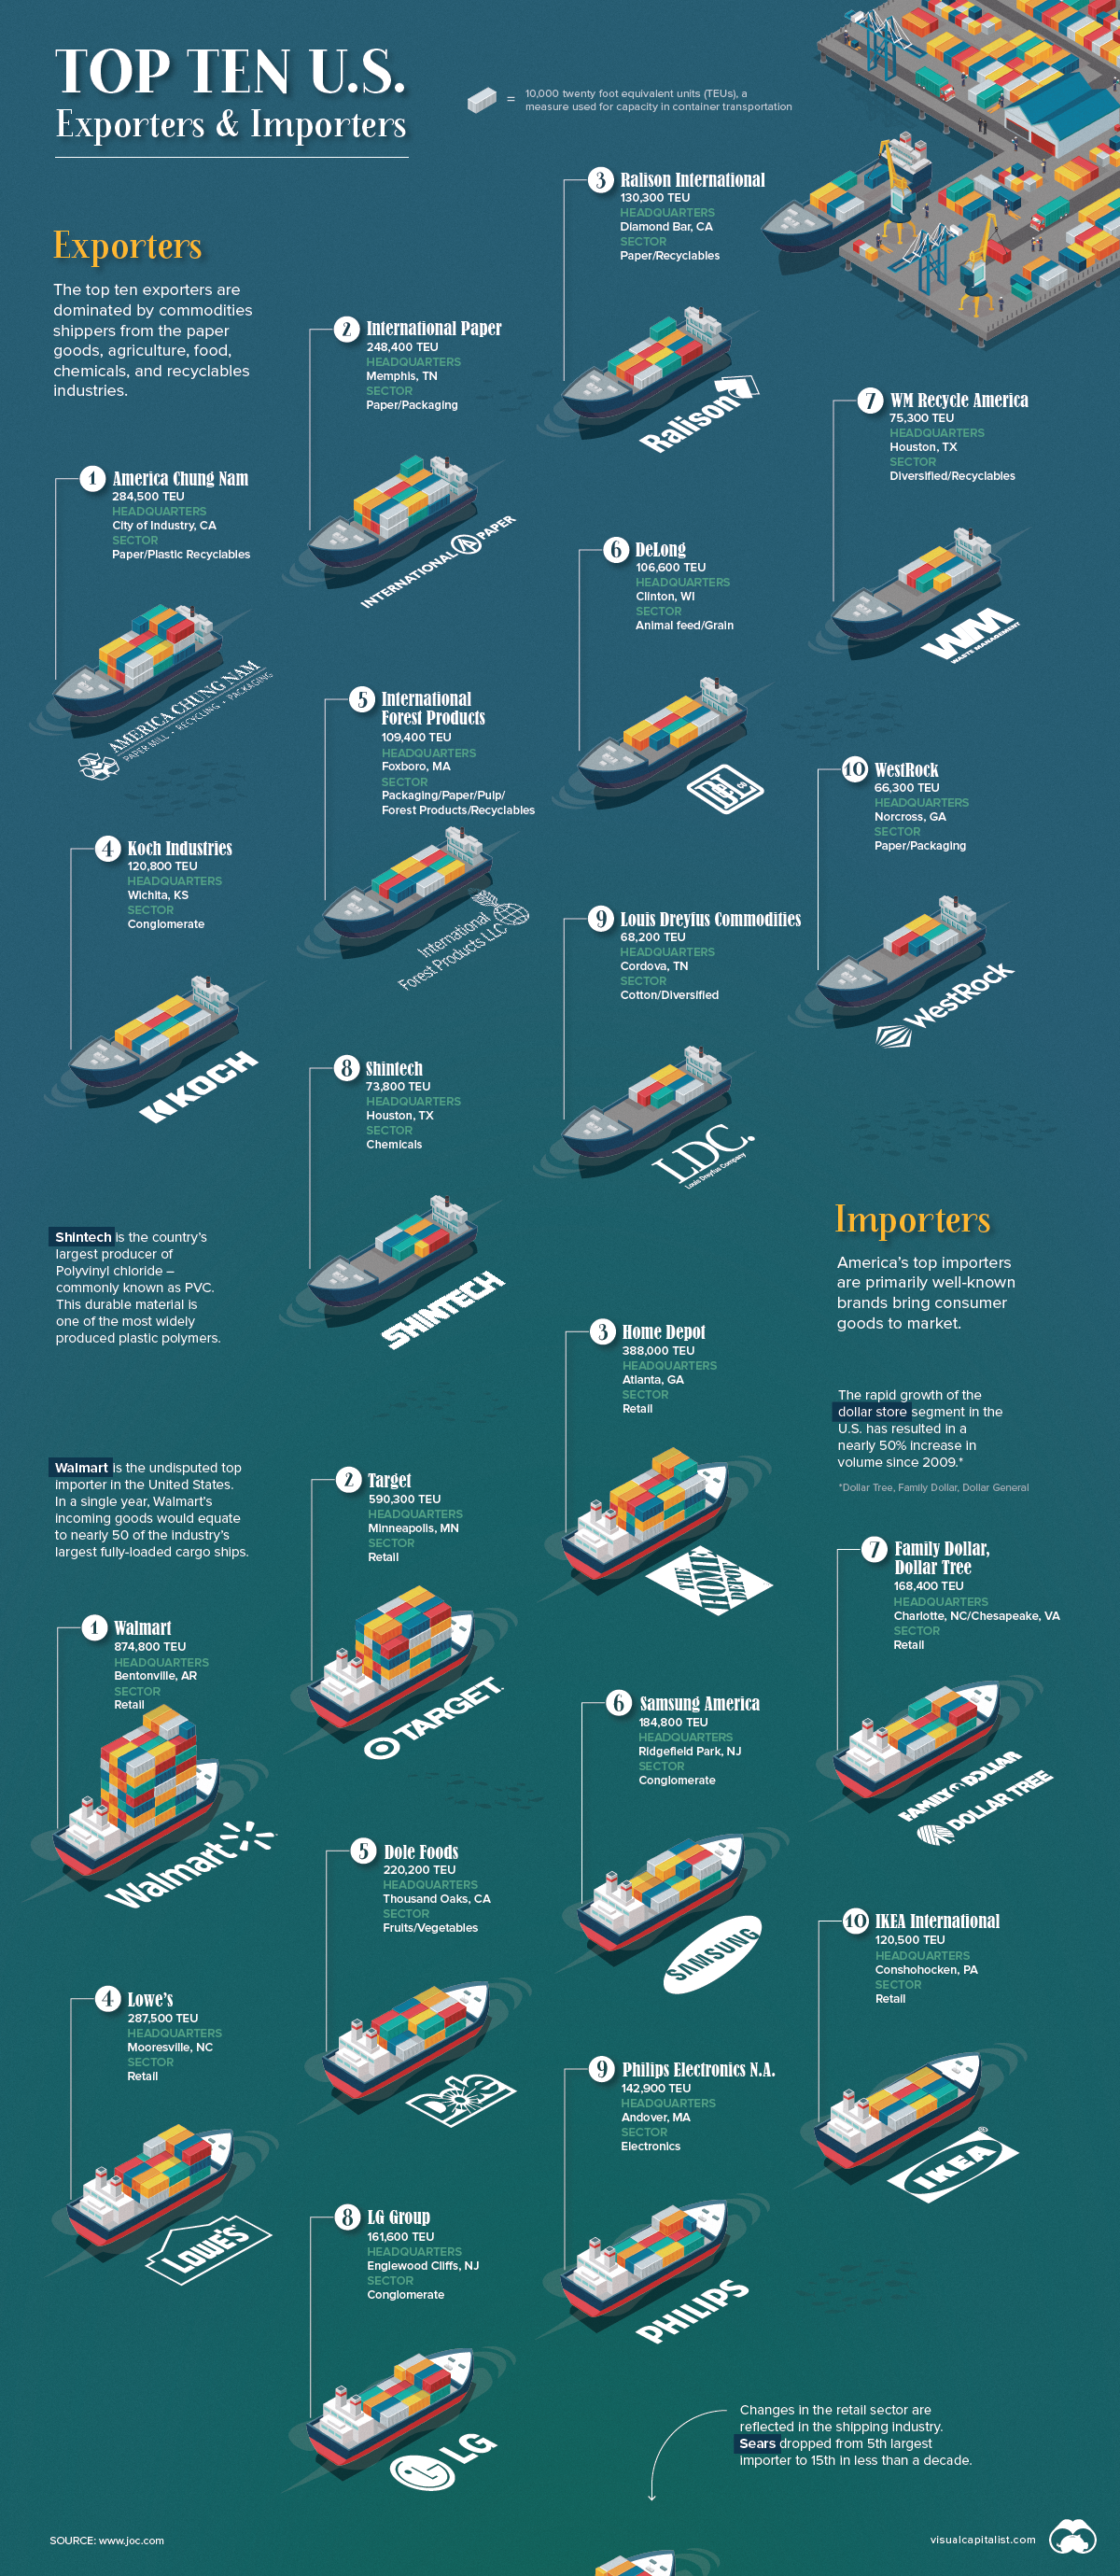
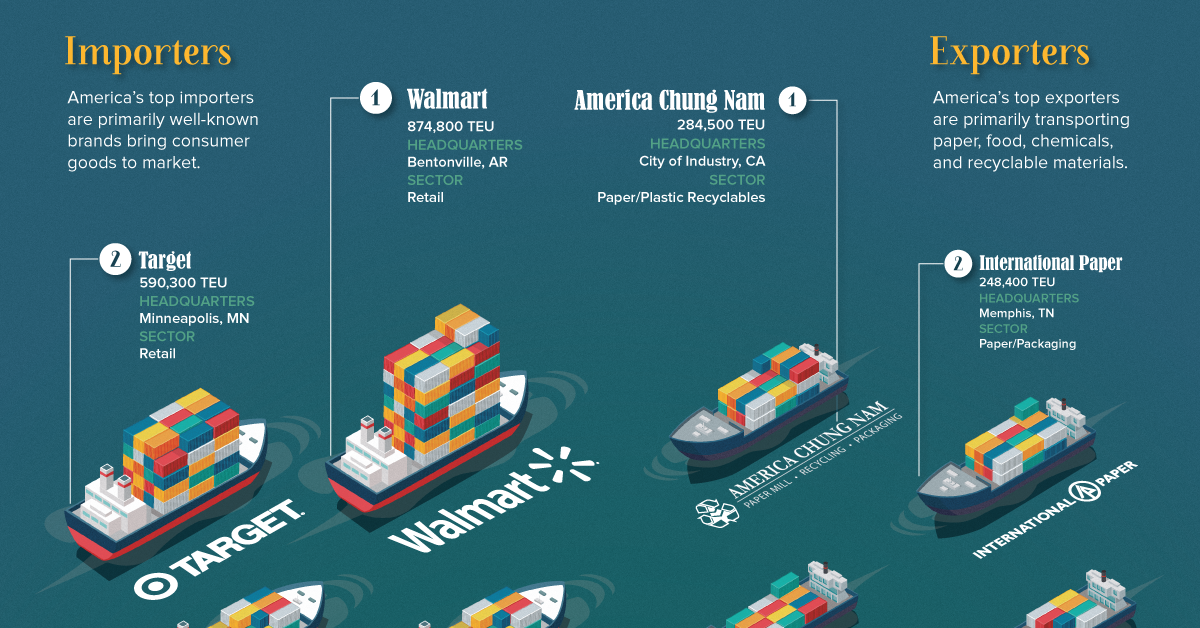
Outgoing: Recyclables and Raw Materials
While companies like Procter & Gamble and Caterpillar export a high volume of consumer goods and equipment, the export market is dominated by bulk materials, natural resources, and chemicals.
Here are the top 20 companies by export volume (20-foot equivalent units, or TEUs):
| Rank | Company | TEU (2017) | Sector |
|---|---|---|---|
| 1 | America Chung Nam | 284,500 | 📄 Paper ♻️ Recyclables |
| 2 | International Paper | 248,400 | 📄 Paper 📦 Packaging |
| 3 | Ralison International | 130,100 | 📄 Paper ♻️ Recyclables |
| 4 | Koch Industries | 120,800 | 💼 Conglomerate |
| 5 | International Forest Products | 109,400 | 🌲 Paper/Forest Products ♻️ Recyclables |
| 6 | DeLong | 106,600 | 🐮 Animal Feed 🌾 Grain |
| 7 | WM Recycle America | 75,300 | 💼 Diversified ♻️ Recyclables |
| 8 | Shintech | 73,800 | 🛢 Chemicals |
| 9 | Louis Dreyfus Commodities | 68,200 | ⚪️ Cotton 💼 Diversified |
| 10 | WestRock | 66,300 | 📄 Paper 📦 Packaging |
| 11 | JBS USA | 65,400 | 🍖 Meats 🍗 Poultry |
| 12 | ExxonMobil Chemical | 63,400 | 🛢 Chemicals |
| 13 | Newport CH International | 62,100 | ♻️ Recyclables |
| 14 | BMW of North America | 61,600 | 🚘 Automotive Goods |
| 15 | Cargill | 57,500 | 💼 Conglomerate |
| 16 | JC Horizon | 55,600 | ♻️ Recyclables |
| 17 | Eastman Chemical | 53,800 | 🛢 Chemicals/Plastics |
| 18 | Potential Industries | 51,600 | 📄 Paper ♻️ Recyclables |
| 19 | Domtar | 48,100 | 🌲 Paper/Forest Products |
| 20 | Sims Metal Management | 47,700 | ⚙️ Metals ♻️ Recyclables |
Note: TEU = Twenty-foot equivalent unit, a measure of volume in units of twenty-foot long shipping containers.
Though exporters of recyclable materials feature prominently on this list, there may be a shake-up coming in the near future.
China’s Recycling Diet
In Western countries, people often assume that their top export by volume is a high-value manufactured good or, at very least, a natural resource like timber or oil. The truth is, a sizable portion of exports from Western countries are waste materials.
This isn’t a new trend. In 2009, nine of the top 20 exporters in the U.S. were sending recyclable materials overseas – particularly to China.
This convenient trade relationship, where ships bring consumer goods to America and return filled with recyclable materials, is being disrupted in a big way. In 2018, China launched Operation National Sword, which could potentially tie a knot in the steady pipeline of waste materials being imported into the country.
For now, countries like Vietnam and Thailand have picked up some of the slack, but before long, Western countries will need to take a serious look at beefing up domestic recycling programs.
Incoming: The Stuff We Buy
On the other end of the equation are the consumer goods that get purchased every day.
In modern society, there’s a very good chance the items around you right now were not built in the country you live in. While many companies import goods from overseas, a few major players move a staggering volume of goods through America’s ports.
Here are the top 20 companies by import volume (TEUs):
| Rank | Company | TEUs (2017) | Sector |
|---|---|---|---|
| 1 | Walmart | 874,800 | 🛒 Retail |
| 2 | Target | 590,300 | 🛒 Retail |
| 3 | Home Depot | 388,000 | 🛒 Retail |
| 4 | Lowe's | 287,500 | 🛒 Retail |
| 5 | Dole Food | 220,200 | 🍍 Produce |
| 6 | Samsung America | 184,800 | 💼 Conglomerate |
| 7 | Family Dollar / Dollar Tree | 168,400 | 🛒 Retail |
| 8 | LG Group | 161,600 | 💼 Conglomerate |
| 9 | Philips Electronics N.A. | 142,900 | 📺 Electronics |
| 10 | IKEA International | 120,500 | 🛒 Retail |
| 11 | Chiquita Brands Int'l | 117,500 | 🍌 Produce |
| 12 | Nike | 116,300 | 👞 Footwear / Apparel |
| 13 | Newell Brands | 115,400 | 🍶 Outdoor / Home Goods |
| 14 | Costco Wholesale | 111,700 | 🛒 Retail |
| 15 | Sears Holdings | 103,200 | 🛒 Retail |
| 16 | J.C. Penney | 101,100 | 🛒 Retail |
| 17 | General Electric | 92,300 | 💼 Conglomerate |
| 18 | Ashley Furniture Industries | 85,700 | 🛋 Furniture |
| 19 | Whirlpool | 74,700 | 🗄 Appliances |
| 20 | Heineken USA | 73,100 | 🍺 Beverages |
In contrast to the top exporters list, the top importing companies are generally more recognizable names, such as Target, Home Depot, Dollar Tree, and Ikea.
It will come as no surprise that Walmart, the world’s biggest retailer by some margin, is also America’s top importer. In a single year, Walmart’s incoming goods would equate to nearly 50 of the industry’s largest fully-loaded cargo ships.


Markets
U.S. Debt Interest Payments Reach $1 Trillion
U.S. debt interest payments have surged past the $1 trillion dollar mark, amid high interest rates and an ever-expanding debt burden.


U.S. Debt Interest Payments Reach $1 Trillion
This was originally posted on our Voronoi app. Download the app for free on iOS or Android and discover incredible data-driven charts from a variety of trusted sources.
The cost of paying for America’s national debt crossed the $1 trillion dollar mark in 2023, driven by high interest rates and a record $34 trillion mountain of debt.
Over the last decade, U.S. debt interest payments have more than doubled amid vast government spending during the pandemic crisis. As debt payments continue to soar, the Congressional Budget Office (CBO) reported that debt servicing costs surpassed defense spending for the first time ever this year.
This graphic shows the sharp rise in U.S. debt payments, based on data from the Federal Reserve.
A $1 Trillion Interest Bill, and Growing
Below, we show how U.S. debt interest payments have risen at a faster pace than at another time in modern history:
| Date | Interest Payments | U.S. National Debt |
|---|---|---|
| 2023 | $1.0T | $34.0T |
| 2022 | $830B | $31.4T |
| 2021 | $612B | $29.6T |
| 2020 | $518B | $27.7T |
| 2019 | $564B | $23.2T |
| 2018 | $571B | $22.0T |
| 2017 | $493B | $20.5T |
| 2016 | $460B | $20.0T |
| 2015 | $435B | $18.9T |
| 2014 | $442B | $18.1T |
| 2013 | $425B | $17.2T |
| 2012 | $417B | $16.4T |
| 2011 | $433B | $15.2T |
| 2010 | $400B | $14.0T |
| 2009 | $354B | $12.3T |
| 2008 | $380B | $10.7T |
| 2007 | $414B | $9.2T |
| 2006 | $387B | $8.7T |
| 2005 | $355B | $8.2T |
| 2004 | $318B | $7.6T |
| 2003 | $294B | $7.0T |
| 2002 | $298B | $6.4T |
| 2001 | $318B | $5.9T |
| 2000 | $353B | $5.7T |
| 1999 | $353B | $5.8T |
| 1998 | $360B | $5.6T |
| 1997 | $368B | $5.5T |
| 1996 | $362B | $5.3T |
| 1995 | $357B | $5.0T |
| 1994 | $334B | $4.8T |
| 1993 | $311B | $4.5T |
| 1992 | $306B | $4.2T |
| 1991 | $308B | $3.8T |
| 1990 | $298B | $3.4T |
| 1989 | $275B | $3.0T |
| 1988 | $254B | $2.7T |
| 1987 | $240B | $2.4T |
| 1986 | $225B | $2.2T |
| 1985 | $219B | $1.9T |
| 1984 | $205B | $1.7T |
| 1983 | $176B | $1.4T |
| 1982 | $157B | $1.2T |
| 1981 | $142B | $1.0T |
| 1980 | $113B | $930.2B |
| 1979 | $96B | $845.1B |
| 1978 | $84B | $789.2B |
| 1977 | $69B | $718.9B |
| 1976 | $61B | $653.5B |
| 1975 | $55B | $576.6B |
| 1974 | $50B | $492.7B |
| 1973 | $45B | $469.1B |
| 1972 | $39B | $448.5B |
| 1971 | $36B | $424.1B |
| 1970 | $35B | $389.2B |
| 1969 | $30B | $368.2B |
| 1968 | $25B | $358.0B |
| 1967 | $23B | $344.7B |
| 1966 | $21B | $329.3B |
Interest payments represent seasonally adjusted annual rate at the end of Q4.
At current rates, the U.S. national debt is growing by a remarkable $1 trillion about every 100 days, equal to roughly $3.6 trillion per year.
As the national debt has ballooned, debt payments even exceeded Medicaid outlays in 2023—one of the government’s largest expenditures. On average, the U.S. spent more than $2 billion per day on interest costs last year. Going further, the U.S. government is projected to spend a historic $12.4 trillion on interest payments over the next decade, averaging about $37,100 per American.
Exacerbating matters is that the U.S. is running a steep deficit, which stood at $1.1 trillion for the first six months of fiscal 2024. This has accelerated due to the 43% increase in debt servicing costs along with a $31 billion dollar increase in defense spending from a year earlier. Additionally, a $30 billion increase in funding for the Federal Deposit Insurance Corporation in light of the regional banking crisis last year was a major contributor to the deficit increase.
Overall, the CBO forecasts that roughly 75% of the federal deficit’s increase will be due to interest costs by 2034.

-

 Real Estate2 weeks ago
Visualizing America’s Shortage of Affordable Homes
-

 Technology1 week ago
Ranked: Semiconductor Companies by Industry Revenue Share
-

 Money1 week ago
Which States Have the Highest Minimum Wage in America?
-

 Real Estate1 week ago
Ranked: The Most Valuable Housing Markets in America
-

 Business1 week ago
Charted: Big Four Market Share by S&P 500 Audits
-

 AI1 week ago
The Stock Performance of U.S. Chipmakers So Far in 2024
-

 Misc2 weeks ago
Almost Every EV Stock is Down After Q1 2024
-

 Money2 weeks ago
Where Does One U.S. Tax Dollar Go?