Technology
Ranked: The Top 50 Most Visited Websites in the World
View the full-resolution version of this infographic
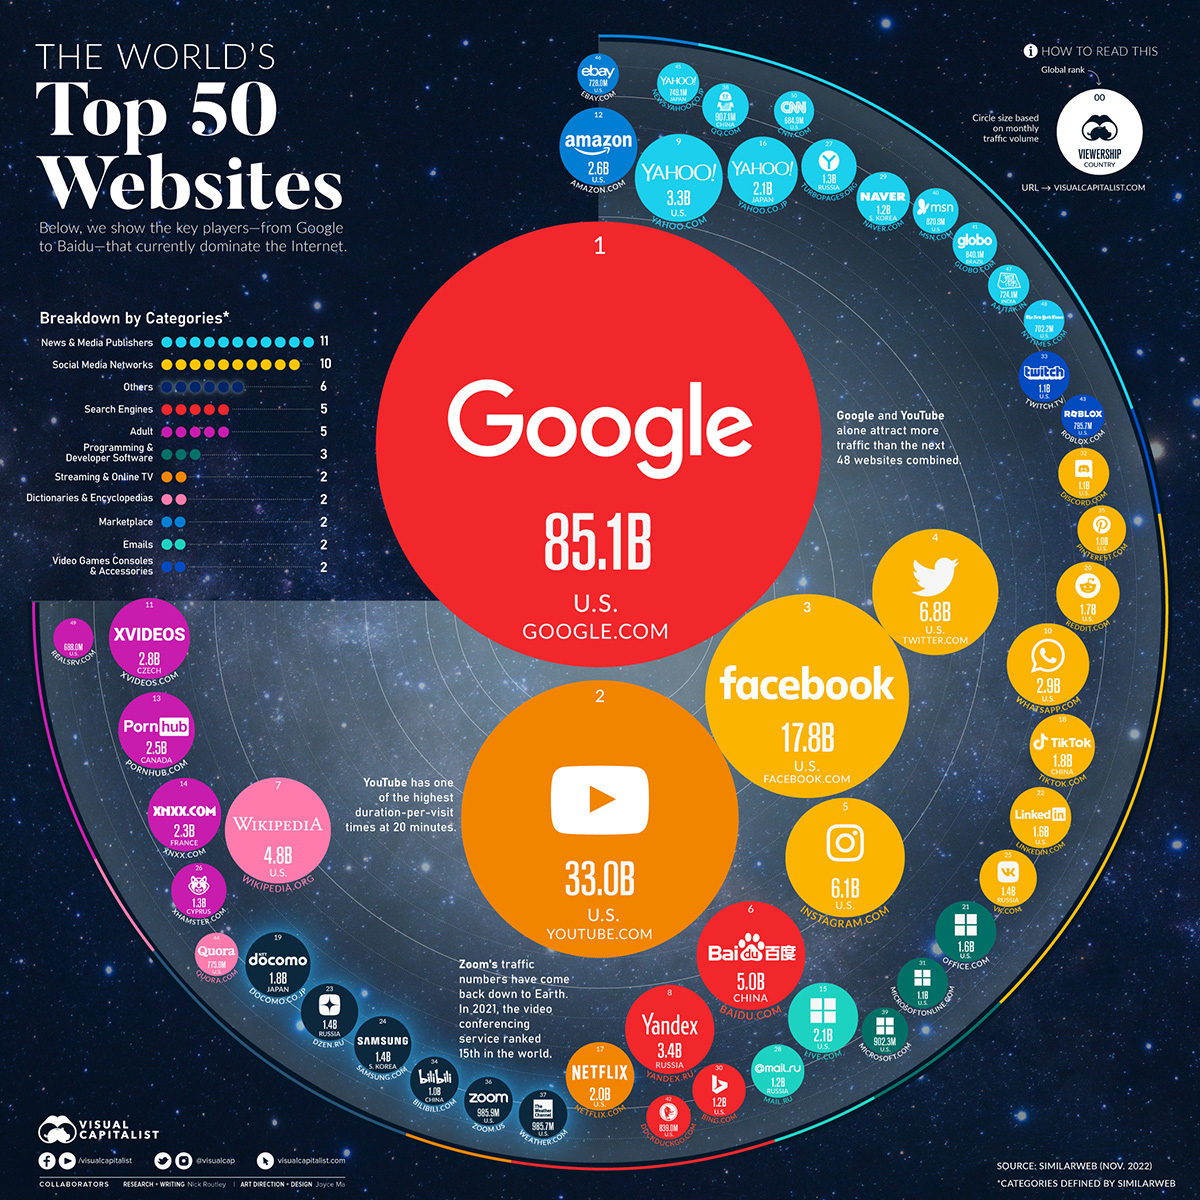


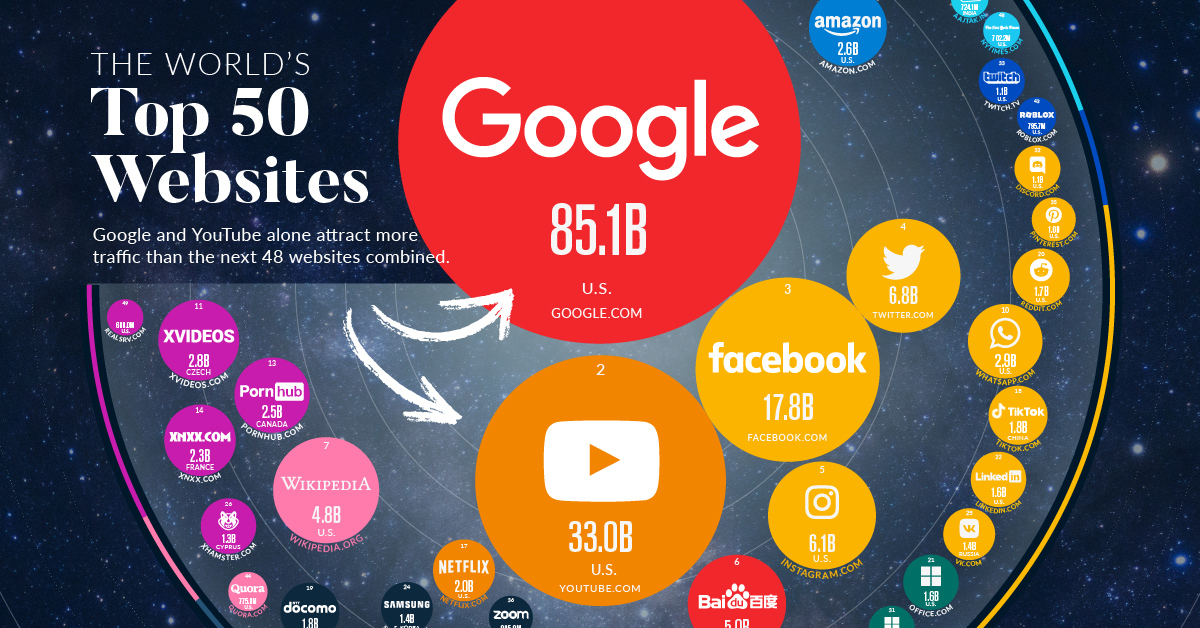
Ranked: The Top 50 Most Visited Websites in the World
Estimates vary, but there are upwards of two billion websites in existence in 2023.
If we were to rank all of these websites according to their traffic numbers, we would see a classic power law distribution. At the low end, the vast majority of these websites would be inactive, receiving little to no traffic. On the upper end of the ranking though, a handful of websites receive the lion’s share of internet traffic.
This visualization, using data from SimilarWeb, takes a look at the 50 websites that currently sit at the top of the ranking.
Which Websites Get the Most Traffic?
Topping the list of most-visited websites in the world is, of course, Google. With over 3.5 billion searches per day, Google has cemented its position as the go-to source for information on the internet. But Google’s dominance doesn’t stop there. The company also owns YouTube, the second-most popular website in the world. Together, Google and YouTube have more traffic than the next 48 websites combined.
The power of YouTube, in particular, is sometimes not fully understood. The video platform is the second largest search engine in the world after Google. As well, YouTube has the second highest duration-of-visit numbers in this top 50 ranking. (First place goes to the Chinese video sharing website, Bilibili.)
But Google and YouTube aren’t the only big players on the internet. Other websites in the top 50 ranking include social media giants Facebook, Instagram, and TikTok. In particular, TikTok has seen a surge in popularity in recent years and is now one of the most popular social media platforms in the world.
Here’s the full top 50 ranking table form:
| Rank | Website | Monthly Traffic | Category | Country |
|---|---|---|---|---|
| #1 | google.com | 85.1B | Search Engines | 🇺🇸 U.S. |
| #2 | youtube.com | 33.0B | Streaming & Online TV | 🇺🇸 U.S. |
| #3 | facebook.com | 17.8B | Social Media Networks | 🇺🇸 U.S. |
| #4 | twitter.com | 6.8B | Social Media Networks | 🇺🇸 U.S. |
| #5 | instagram.com | 6.1B | Social Media Networks | 🇺🇸 U.S. |
| #6 | baidu.com | 5.0B | Search Engines | 🇨🇳 China |
| #7 | wikipedia.org | 4.8B | Dictionaries & Encyclopedias | 🇺🇸 U.S. |
| #8 | yandex.ru | 3.4B | Search Engines | 🇷🇺 Russia |
| #9 | yahoo.com | 3.3B | News & Media Publishers | 🇺🇸 U.S. |
| #10 | whatsapp.com | 2.9B | Social Media Networks | 🇺🇸 U.S. |
| #11 | xvideo.com | 2.8B | Adult | 🇨🇿 Czechia |
| #12 | amazon.com | 2.6B | Marketplace | 🇺🇸 U.S. |
| #13 | pornhub.com | 2.5B | Adult | 🇨🇦 Canada |
| #14 | xnxx.com | 2.3B | Adult | 🇫🇷 France |
| #15 | live.com | 2.1B | 🇺🇸 U.S. | |
| #16 | yahoo.co.jp | 2.1B | News & Media Publishers | 🇯🇵 Japan |
| #17 | netflix.com | 2.0B | Streaming & Online TV | 🇺🇸 U.S. |
| #18 | tiktok.com | 1.8B | Social Media Networks | 🇨🇳 China |
| #19 | docomo.ne.jp | 1.8B | Telecommunications | 🇯🇵 Japan |
| #20 | reddit.com | 1.7B | Social Media Networks | 🇺🇸 U.S. |
| #21 | office.com | 1.6B | Prog. & Developer Software | 🇺🇸 U.S. |
| #22 | linkedin.com | 1.6B | Social Media Networks | 🇺🇸 U.S. |
| #23 | dzen.ru | 1.4B | Faith & Beliefs | 🇷🇺 Russia |
| #24 | samsung.com | 1.4B | Consumer Electronics | 🇰🇷 S. Korea |
| #25 | vk.com | 1.4B | Social Media Networks | 🇷🇺 Russia |
| #26 | xhamster.com | 1.3B | Adult | 🇨🇾 Cyprus |
| #27 | turbopages.org | 1.3B | News & Media Publishers | 🇷🇺 Russia |
| #28 | mail.ru | 1.2B | 🇷🇺 Russia | |
| #29 | naver.com | 1.2B | News & Media Publishers | 🇰🇷 S. Korea |
| #30 | bing.com | 1.2B | Search Engines | 🇺🇸 U.S. |
| #31 | microsoftonline.com | 1.1B | Prog. & Developer Software | 🇺🇸 U.S. |
| #32 | discord.com | 1.1B | Social Media Networks | 🇺🇸 U.S. |
| #33 | twitch.tv | 1.1B | Gaming & Accessories | 🇺🇸 U.S. |
| #34 | bilibili.com | 1.0B | Animations & Comics | 🇨🇳 China |
| #35 | pinterest.com | 1.0B | Social Media Networks | 🇺🇸 U.S. |
| #36 | zoom.us | 985.9M | Computers Electronics & Tech | 🇺🇸 U.S. |
| #37 | weather.com | 985.7M | Weather | 🇺🇸 U.S. |
| #38 | qq.com | 907.1M | News & Media Publishers | 🇨🇳 China |
| #39 | microsoft.com | 902.3M | Prog. & Developer Software | 🇺🇸 U.S. |
| #40 | msn.com | 870.8M | News & Media Publishers | 🇺🇸 U.S. |
| #41 | globo.com | 840.1M | News & Media Publishers | 🇧🇷 Brazil |
| #42 | duckduckgo.com | 839.0M | Search Engines | 🇺🇸 U.S. |
| #43 | roblox.com | 795.7M | Gaming & Accessories | 🇺🇸 U.S. |
| #44 | quora.com | 775.9M | Dictionaries & Encyclopedias | 🇺🇸 U.S. |
| #45 | news.yahoo.co.jp | 749.1M | News & Media Publishers | 🇯🇵 Japan |
| #46 | ebay.com | 728.0M | Marketplace | 🇺🇸 U.S. |
| #47 | aajtak.in | 724.1M | News & Media Publishers | 🇮🇳 India |
| #48 | nytimes.com | 702.2M | News & Media Publishers | 🇺🇸 U.S. |
| #49 | realsrv.com | 688.0M | Adult | 🇺🇸 U.S. |
| #50 | cnn.com | 684.9M | News & Media Publishers | 🇺🇸 U.S. |
Notable companies that have fallen out of the top 50 since our last version of this visualization are Walmart and PayPal. Notable entrants into the top 50 are Samsung and the New York Times.
The Geography of the 50 Most-Visited Websites
The United States is still home base for many of the world’s biggest websites, taking up 30 spots on this ranking. Of these 30 websites, half are operated by Big Tech companies such as Microsoft, Amazon, Alphabet, Meta, and Netflix.
Russia, China, Japan, and South Korea round out the top five.
Things get interesting in the “other” category, which includes six websites. Two spots are taken up by Aaj Tak and Globo, which are large media publications in India and Brazil, respectively.
The remaining four websites—XVideos, PornHub, XHamster, and XNXX—specialize in adult content, and are located in a variety of countries. These are often referred to as “tube sites” since they are built on the YouTube model.
Realsrv, the only adult-oriented site in the top 50 located in the U.S., is interesting to delve into as well, since it’s far from a household name. The website essentially supports advertising efforts by redirecting users away from the content they were viewing over to another page (generally premium adult content). This is one of the key ways that adult websites earn revenue.
Where does this data come from?
Source: SimilarWeb
Notes: Websites listed include “all meaningful subdomains”, and categories in the graphic follow SimilarWeb’s categorization system. This is the third version of this graphic. As with previous versions, we aim to use data from November for the sake of consistency and to avoid seasonal fluctuations in traffic. One important detail to point out is that website traffic does not include app traffic, which is why popular platforms like WeChat don’t appear in this ranking.


Technology
Ranked: Semiconductor Companies by Industry Revenue Share
Nvidia is coming for Intel’s crown. Samsung is losing ground. AI is transforming the space. We break down revenue for semiconductor companies.


Semiconductor Companies by Industry Revenue Share
This was originally posted on our Voronoi app. Download the app for free on Apple or Android and discover incredible data-driven charts from a variety of trusted sources.
Did you know that some computer chips are now retailing for the price of a new BMW?
As computers invade nearly every sphere of life, so too have the chips that power them, raising the revenues of the businesses dedicated to designing them.
But how did various chipmakers measure against each other last year?
We rank the biggest semiconductor companies by their percentage share of the industry’s revenues in 2023, using data from Omdia research.
Which Chip Company Made the Most Money in 2023?
Market leader and industry-defining veteran Intel still holds the crown for the most revenue in the sector, crossing $50 billion in 2023, or 10% of the broader industry’s topline.
All is not well at Intel, however, with the company’s stock price down over 20% year-to-date after it revealed billion-dollar losses in its foundry business.
| Rank | Company | 2023 Revenue | % of Industry Revenue |
|---|---|---|---|
| 1 | Intel | $51B | 9.4% |
| 2 | NVIDIA | $49B | 9.0% |
| 3 | Samsung Electronics | $44B | 8.1% |
| 4 | Qualcomm | $31B | 5.7% |
| 5 | Broadcom | $28B | 5.2% |
| 6 | SK Hynix | $24B | 4.4% |
| 7 | AMD | $22B | 4.1% |
| 8 | Apple | $19B | 3.4% |
| 9 | Infineon Tech | $17B | 3.2% |
| 10 | STMicroelectronics | $17B | 3.2% |
| 11 | Texas Instruments | $17B | 3.1% |
| 12 | Micron Technology | $16B | 2.9% |
| 13 | MediaTek | $14B | 2.6% |
| 14 | NXP | $13B | 2.4% |
| 15 | Analog Devices | $12B | 2.2% |
| 16 | Renesas Electronics Corporation | $11B | 1.9% |
| 17 | Sony Semiconductor Solutions Corporation | $10B | 1.9% |
| 18 | Microchip Technology | $8B | 1.5% |
| 19 | Onsemi | $8B | 1.4% |
| 20 | KIOXIA Corporation | $7B | 1.3% |
| N/A | Others | $126B | 23.2% |
| N/A | Total | $545B | 100% |
Note: Figures are rounded. Totals and percentages may not sum to 100.
Meanwhile, Nvidia is very close to overtaking Intel, after declaring $49 billion of topline revenue for 2023. This is more than double its 2022 revenue ($21 billion), increasing its share of industry revenues to 9%.
Nvidia’s meteoric rise has gotten a huge thumbs-up from investors. It became a trillion dollar stock last year, and broke the single-day gain record for market capitalization this year.
Other chipmakers haven’t been as successful. Out of the top 20 semiconductor companies by revenue, 12 did not match their 2022 revenues, including big names like Intel, Samsung, and AMD.
The Many Different Types of Chipmakers
All of these companies may belong to the same industry, but they don’t focus on the same niche.
According to Investopedia, there are four major types of chips, depending on their functionality: microprocessors, memory chips, standard chips, and complex systems on a chip.
Nvidia’s core business was once GPUs for computers (graphics processing units), but in recent years this has drastically shifted towards microprocessors for analytics and AI.
These specialized chips seem to be where the majority of growth is occurring within the sector. For example, companies that are largely in the memory segment—Samsung, SK Hynix, and Micron Technology—saw peak revenues in the mid-2010s.

-

 Mining2 weeks ago
Charted: The Value Gap Between the Gold Price and Gold Miners
-

 Real Estate1 week ago
Ranked: The Most Valuable Housing Markets in America
-

 Business1 week ago
Charted: Big Four Market Share by S&P 500 Audits
-

 AI1 week ago
The Stock Performance of U.S. Chipmakers So Far in 2024
-

 Misc1 week ago
Almost Every EV Stock is Down After Q1 2024
-

 Money2 weeks ago
Where Does One U.S. Tax Dollar Go?
-

 Green2 weeks ago
Ranked: Top Countries by Total Forest Loss Since 2001
-

 Real Estate2 weeks ago
Visualizing America’s Shortage of Affordable Homes