Brands
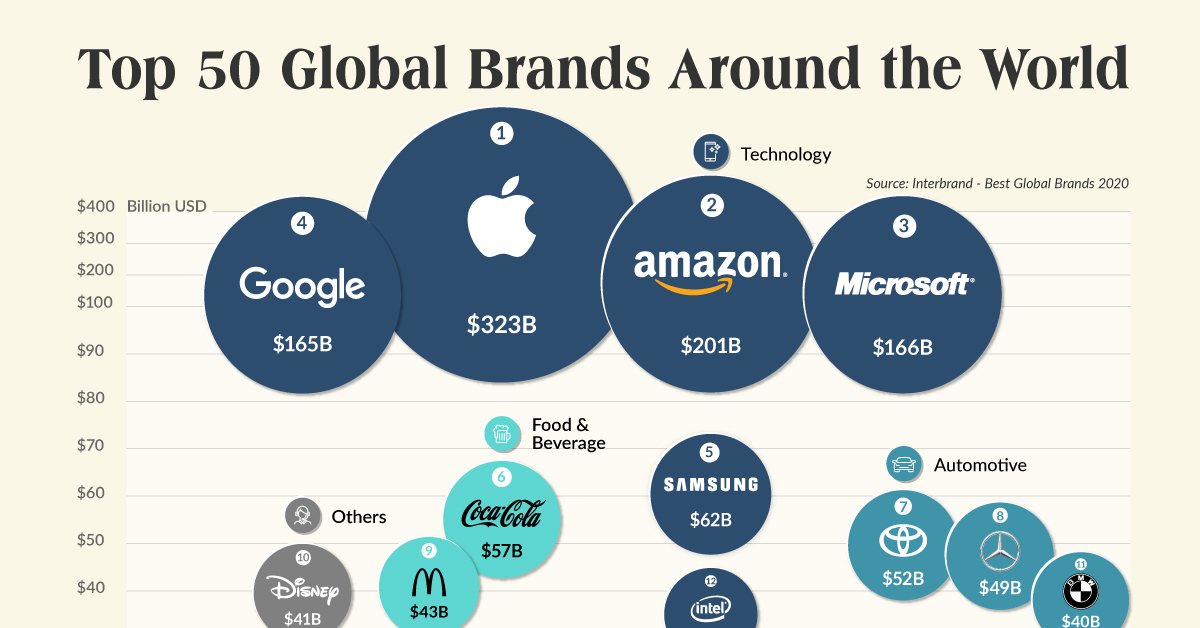
The Top 50 Most Valuable Global Brands
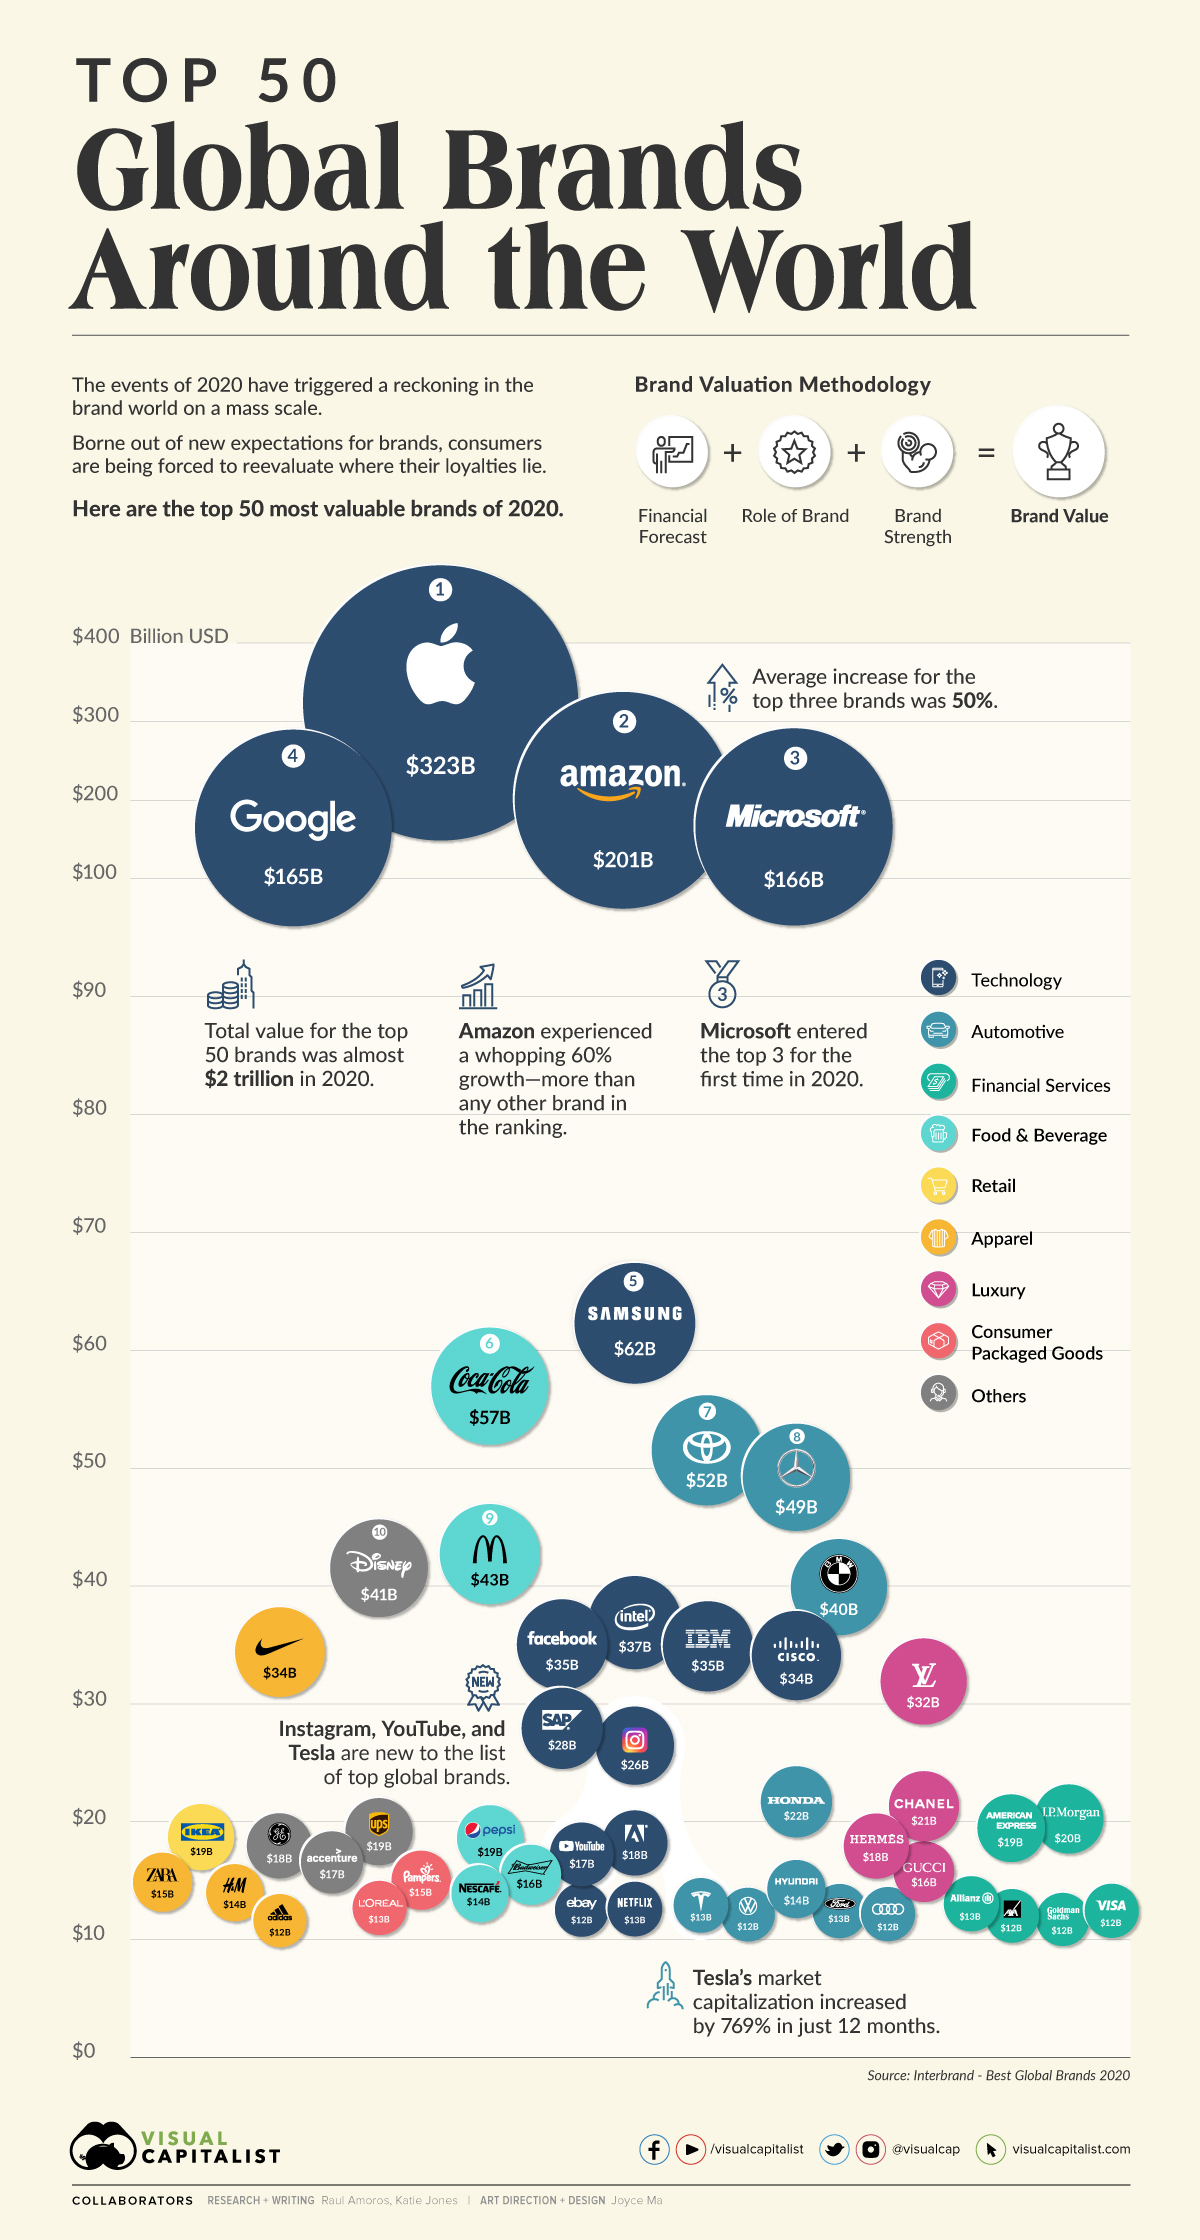


Visualizing the Top 50 Most Valuable Global Brands
For many brands, it has been a devastating year to say the least.
Over half of the most valuable global brands have experienced a decline in brand value, a measure that takes financial projections, brand roles in purchase decisions, and strengths against competitors into consideration. But where some have faltered, others have asserted their dominance and stepped up for their customers like never before.
The visualization above showcases the top 50 most valuable global brands from a study conducted by Interbrand, which calculates brand value across hundreds of companies.
As consumers move cautiously into 2021, which brands have they chosen to keep by their side?
The Heavy Hitters
With an eye-watering brand value of $323 billion, Apple is the most valuable global brand in the world, followed closely by Amazon in second place, and Microsoft in third. Average growth in brand value across all three of these tech brands in 2020 was roughly 50%.
In particular, Microsoft—who overtook Google in this year’s ranking—has increased its brand value by $100 billion in just one decade. The tech giant has reinvented itself over the years by focusing not just on how its products impact consumers’ lives, but instead on how they impact the planet. The company is promising to become carbon negative by 2030.
However, other brands that sit at the top of the global brands list have not had the same recent success. Coca-Cola for example sits in sixth place, but has seen a decline in brand value of over $13 billion since 2010.
Here is the full list of the most valuable global brands in 2020:
| Rank | Brand | Brand Value | YoY % Change | Industry |
|---|---|---|---|---|
| #1 | Apple | $323B | 38% | Technology |
| #2 | Amazon | $201B | 60% | Technology |
| #3 | Microsoft | $166B | 53% | Technology |
| #4 | $165B | -1% | Technology | |
| #5 | Samsung | $62B | 2% | Technology |
| #6 | Coca-Cola | $57B | -10% | Food & Beverage |
| #7 | Toyota | $52B | -8% | Automotive |
| #8 | Mercedes | $49B | -3% | Automotive |
| #9 | McDonald’s | $43B | -6% | Restaurants |
| #10 | Disney | $41B | -8% | Entertainment |
| #11 | BMW | $40B | -4% | Automotive |
| #12 | Intel | $40B | -8% | Technology |
| #13 | $35B | -12% | Technology | |
| #14 | IBM | $35B | -14% | Technology |
| #15 | Nike | $34B | 6% | Apparel |
| #16 | Cisco | $34B | -4% | Technology |
| #17 | Louis Vuitton | $32B | -2% | Luxury |
| #18 | SAP | $28B | 12% | Technology |
| #19 | $26B | New | Technology | |
| #20 | Honda | $22B | -11% | Automotive |
| #21 | Chanel | $21B | -4% | Luxury |
| #22 | J.P. Morgan | $20B | 6% | Financial Services |
| #23 | American Express | $19B | -10% | Financial Services |
| #24 | UPS | $19B | 6% | Logistics |
| #25 | Ikea | $19B | 3% | Retail |
| #26 | Pepsi | $19B | -9% | Food & Beverage |
| #27 | Adobe | $18B | 41% | Technology |
| #28 | Hermès | $18B | 0% | Luxury |
| #29 | General Electric | $18B | -30% | Industrial Machinery |
| #30 | YouTube | $17B | New | Technology |
| #31 | Accenture | $17B | 2% | Business Services |
| #32 | Gucci | $16B | -2% | Luxury |
| #33 | Budweiser | $16B | -3% | Food & Beverage |
| #34 | Pampers | $15B | -4% | Consumer Packaged Goods |
| #35 | Zara | $15B | -13% | Apparel |
| #36 | Hyundai | $14B | 1% | Automotive |
| #37 | H&M | $14B | -14% | Apparel |
| #38 | Nescafé | $14B | 2% | Food & Beverage |
| #39 | Allianz | $13B | 7% | Financial Services |
| #40 | Tesla | $13B | New | Automotive |
| #41 | Netflix | $13B | 41% | Technology |
| #42 | Ford | $13B | -12% | Automotive |
| #43 | L'Oreal | $13B | 8% | Consumer Packaged Goods |
| #44 | Audi | $12B | -2% | Automotive |
| #45 | Visa | $12B | 15% | Financial Services |
| #46 | Ebay | $12B | 2% | Technology |
| #47 | Volkswagen | $12B | -5% | Automotive |
| #48 | AXA | $12B | 3% | Financial Services |
| #49 | Goldman Sachs | $12B | 7% | Financial Services |
| #50 | Adidas | $12B | 1% | Apparel |
| #51 | Sony | $12B | 14% | Technology |
| #52 | Citi | $12B | -6% | Financial Services |
| #53 | Philips | $12B | 0% | Consumer Packaged Goods |
| #54 | Gillette | $12B | -16% | Consumer Packaged Goods |
| #55 | Porsche | $11B | -3% | Automotive |
| #56 | Starbucks | $11B | -5% | Food & Beverage |
| #57 | Mastercard | $11B | -17% | Financial Services |
| #58 | Salesforce | $11B | 34% | Technology |
| #59 | Nissan | $11B | -8% | Automotive |
| #60 | PayPal | $11B | 38% | Financial Services |
| #61 | Siemens | $11B | 2% | Technology |
| #62 | Danone | $10B | 4% | Food & Beverage |
| #63 | Nestlé | $10B | 8% | Food & Beverage |
| #64 | HSBC | $10B | -14% | Financial Services |
| #65 | Hewlett Packard | $10B | -11% | Technology |
| #66 | Kellogg's | $10B | -8% | Food & Beverage |
| #67 | 3M | $9B | 4% | Technology |
| #68 | Colgate | $9B | 6% | Consumer Packaged Goods |
| #69 | Morgan Stanely | $9B | 8% | Financial Services |
| #70 | Spotify | $8B | 52% | Technology |
| #71 | Canon | $8B | -15% | Technology |
| #72 | Lego | $8B | 9% | Consumer Packaged Goods |
| #73 | Cartier | $7B | -9% | Luxury |
| #74 | Santander | $7B | -12% | Financial Services |
| #75 | FedEx | $7B | 5% | Logistics |
| #76 | Nintendo | $7B | 31% | Technology |
| #77 | Hewlett Packard Enterprise | $7B | -16% | Technology |
| #78 | Corona | $7B | 3% | Food & Beverage |
| #79 | Ferrari | $6B | -1% | Automotive |
| #80 | Huawei | $6B | -9% | Technology |
| #81 | DHL | $6B | 5% | Logistics |
| #82 | Jack Daniel's | $6B | -1% | Food & Beverage |
| #83 | Dior | $6B | -1% | Luxury |
| #84 | Caterpillar | $6B | -14% | Industrial Machinery |
| #85 | Panasonic | $6B | -6% | Consumer Packaged Goods |
| #86 | Kia | $6B | -9% | Automotive |
| #87 | Johnson & Johnson | $6B | 1% | Consumer Packaged Goods |
| #88 | Heineken | $6B | -2% | Food & Beverage |
| #89 | John Deere | $5B | -9% | Industrial Machinery |
| #90 | $5B | 8% | Technology | |
| #91 | Hennessy | $5B | -3% | Food & Beverage |
| #92 | KFC | $5B | -7% | Food & Beverage |
| #93 | Land Rover | $5B | -13% | Automotive |
| #94 | Tiffany & Co. | $5B | -7% | Luxury |
| #95 | Mini | $5B | -10% | Automotive |
| #96 | Uber | $5B | -13% | Technology |
| #97 | Burberry | $5B | -8% | Luxury |
| #98 | Johnnie Walker | $5B | New | Food & Beverage |
| #99 | Prada | $4B | -6% | Luxury |
| #100 | Zoom | $4B | New | Technology |
It is clear that brands that went above and beyond during the COVID-19 pandemic not only benefit from more meaningful connections with their customers; it also pays financially—with brand value for all 100 companies included in the study totaling $2 trillion.
Movers and Shakers
When it comes to 2020’s fastest risers, Amazon, Microsoft, Spotify, and Netflix lead the way.
Not too far behind these brands is PayPal, which saw 38% growth in the last year due to some major strategic pivots. More recently, the brand announced it would be redirecting capital from shareholders and investing in low-level employees who have been essential during the pandemic.
Other brands making their mark in 2020 are Instagram, Tesla, and YouTube—all of which are new to the ranking and are experiencing significant growth in brand value. In fact, electric vehicle company Tesla experienced a 769% increase in market capitalization in just twelve months, making it the world’s most valuable automaker.
The Great Brand Shift
As pharmaceutical companies begin distributing vaccines across the globe, consumer optimism is starting to build again. However, the future of brands remains uncertain.
Only 41 out of 100 most valuable global brands remain in the ranking today from the study conducted in 2000. With almost 60 hugely influential brands falling out of favor in the last two decades, there are several ways in which today’s brands can build economic resilience and thrive in an anxious world:
- Leadership: The degree to which a brand has a clear purpose that is executed seamlessly across the entire organization.
- Engagement: Creating meaningful and collaborative relationships with consumers based on the brand’s unique story and reason for being.
- Relevance: Being omnipresent for customers and delivering on their expectations by going beyond selling products or services.
Although the impacts of 2020 will be felt for years to come, brands that stay ahead of consumers’ changing expectations will be in a better position to weather the storm.


Technology
How Tech Logos Have Evolved Over Time
From complete overhauls to more subtle tweaks, these tech logos have had quite a journey. Featuring: Google, Apple, and more.


How Tech Logos Have Evolved Over Time
This was originally posted on our Voronoi app. Download the app for free on iOS or Android and discover incredible data-driven charts from a variety of trusted sources.
One would be hard-pressed to find a company that has never changed its logo. Granted, some brands—like Rolex, IBM, and Coca-Cola—tend to just have more minimalistic updates. But other companies undergo an entire identity change, thus necessitating a full overhaul.
In this graphic, we visualized the evolution of prominent tech companies’ logos over time. All of these brands ranked highly in a Q1 2024 YouGov study of America’s most famous tech brands. The logo changes are sourced from 1000logos.net.
How Many Times Has Google Changed Its Logo?
Google and Facebook share a 98% fame rating according to YouGov. But while Facebook’s rise was captured in The Social Network (2010), Google’s history tends to be a little less lionized in popular culture.
For example, Google was initially called “Backrub” because it analyzed “back links” to understand how important a website was. Since its founding, Google has undergone eight logo changes, finally settling on its current one in 2015.
| Company | Number of Logo Changes |
|---|---|
| 8 | |
| HP | 8 |
| Amazon | 6 |
| Microsoft | 6 |
| Samsung | 6 |
| Apple | 5* |
Note: *Includes color changes. Source: 1000Logos.net
Another fun origin story is Microsoft, which started off as Traf-O-Data, a traffic counter reading company that generated reports for traffic engineers. By 1975, the company was renamed. But it wasn’t until 2012 that Microsoft put the iconic Windows logo—still the most popular desktop operating system—alongside its name.
And then there’s Samsung, which started as a grocery trading store in 1938. Its pivot to electronics started in the 1970s with black and white television sets. For 55 years, the company kept some form of stars from its first logo, until 1993, when the iconic encircled blue Samsung logo debuted.
Finally, Apple’s first logo in 1976 featured Isaac Newton reading under a tree—moments before an apple fell on his head. Two years later, the iconic bitten apple logo would be designed at Steve Jobs’ behest, and it would take another two decades for it to go monochrome.

-

 Markets1 week ago
U.S. Debt Interest Payments Reach $1 Trillion
-

 Markets2 weeks ago
Ranked: The Most Valuable Housing Markets in America
-

 Money2 weeks ago
Which States Have the Highest Minimum Wage in America?
-

 AI2 weeks ago
Ranked: Semiconductor Companies by Industry Revenue Share
-

 Markets2 weeks ago
Ranked: The World’s Top Flight Routes, by Revenue
-

 Countries2 weeks ago
Population Projections: The World’s 6 Largest Countries in 2075
-

 Markets2 weeks ago
The Top 10 States by Real GDP Growth in 2023
-

 Money2 weeks ago
The Smallest Gender Wage Gaps in OECD Countries