Technology
The Top 20 Tech Companies by Revenue Per Employee
The Top 20 Tech Companies by Revenue Per Employee
Whether the goal is to organize the world’s information or to build an algorithm that makes millions of lives easier, pretty much every tech company in existence aims to leverage software in some way to do the types of jobs that would otherwise be impossible or uneconomical for humans to do.
Tapping into the properties of the digital world allows these companies to do more with less. They can have global reach with minimal infrastructure, massive scale with little overhead, and impressive revenues without any physical inventory.
Tech companies can even “provide” a service by simply connecting people through a platform, rather than knowing how to perform the service itself.
“Our Greatest Asset”
With this kind of scale, every action taken by an employee packs an extra punch to have an effect on company performance. It’s why companies like Google, Facebook, and Microsoft are willing to pay an arm and a leg for the smartest engineers. These teams are not physically turning out widgets in a factory under the constraints of normal economic factors – instead, they are applying their brains to a codebase, and even the tiniest cost savings can add up when multiplied by millions of users.
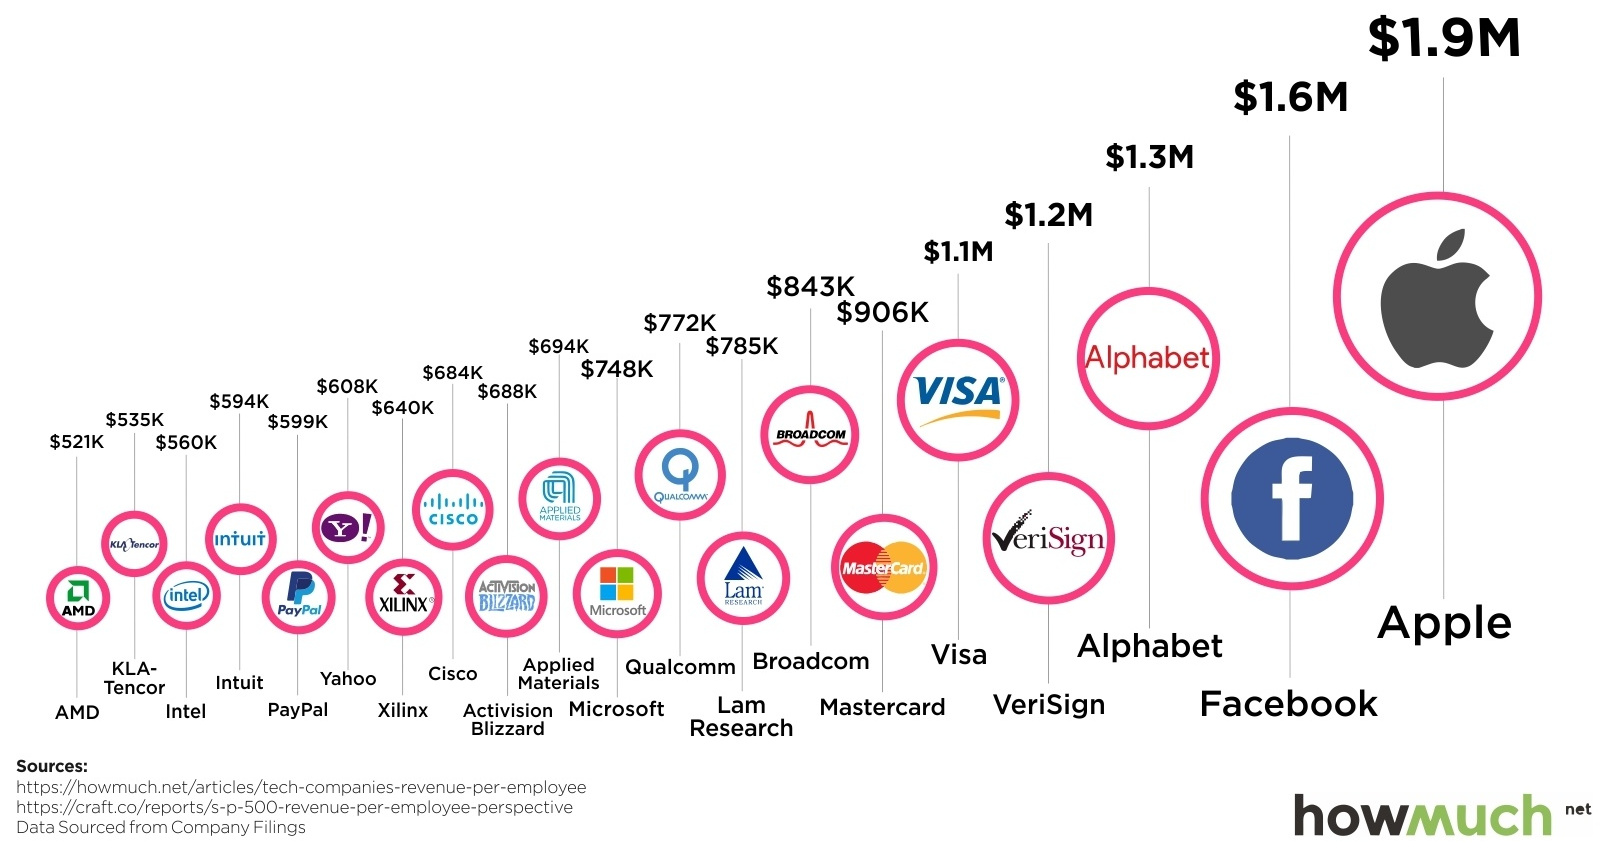
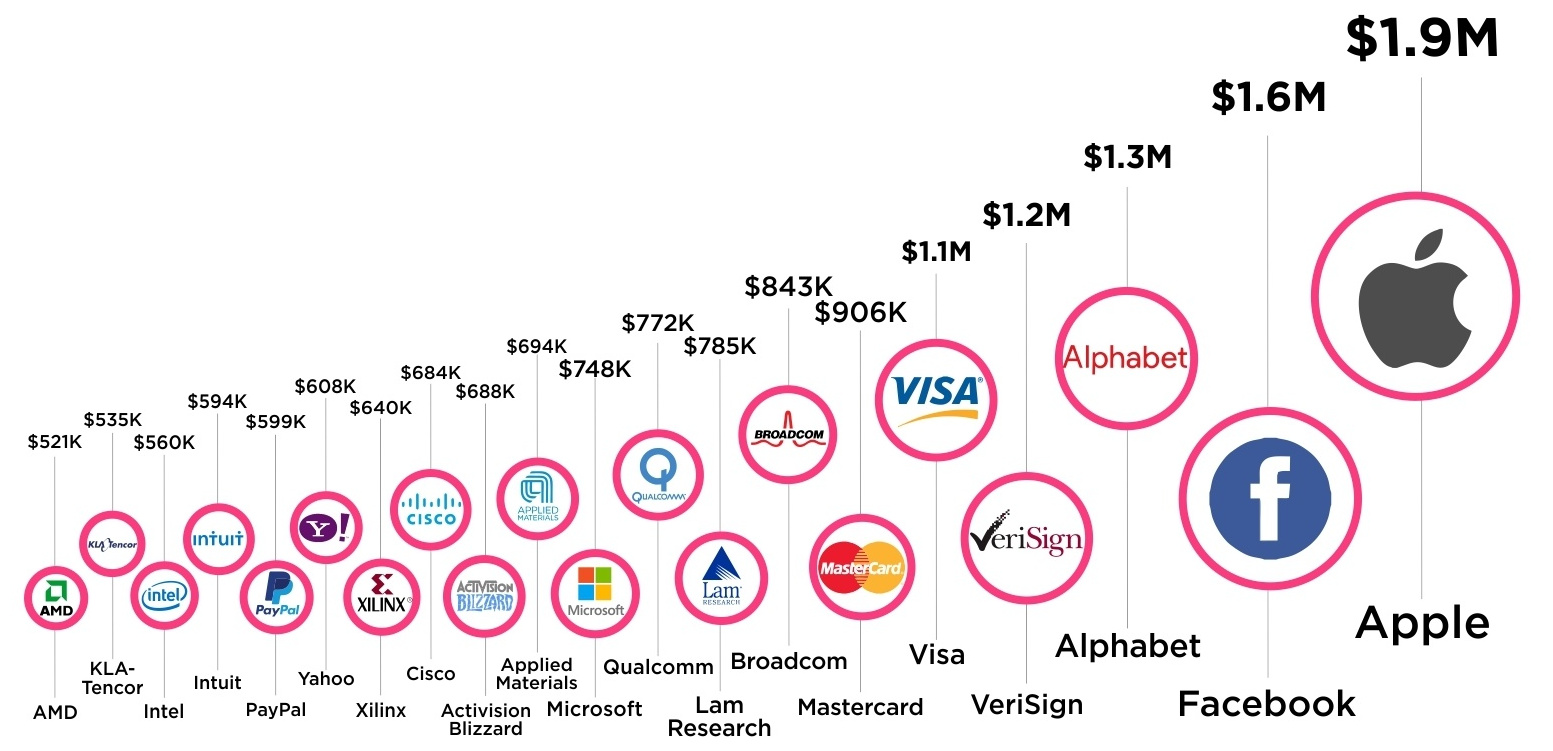
Today’s visualization from cost information site HowMuch.net helps put this all in perspective by showing revenue per employee of some of the world’s largest tech companies that are a part of the S&P 500.
Here’s the data in table form:
| Rank | Company | Revenue per employee |
|---|---|---|
| #1 | Apple | $1,859,000 |
| #2 | $1,621,000 | |
| #3 | Alphabet | $1,253,000 |
| #4 | VeriSign | $1,154,000 |
| #5 | Visa | $1,062,000 |
| #6 | Mastercard | $906,000 |
| #7 | Broadcom | $843,000 |
| #8 | Lam Research | $785,000 |
| #9 | Qualcomm | $772,000 |
| #10 | Microsoft | $748,000 |
| #11 | Applied Materials | $694,000 |
| #12 | Activision Blizzard | $688,000 |
| #13 | Cisco | $684,000 |
| #14 | Xilinx | $640,000 |
| #15 | Yahoo! | $608,000 |
| #16 | PayPal | $599,000 |
| #17 | Intuit | $594,000 |
| #18 | Intel | $560,000 |
| #19 | KLA-Tencor | $535,000 |
| #20 | AMD | $521,000 |
List only based on S&P 500 companies listed in “Technology” category
Facebook, Alphabet, and Visa each bring in over $1 million in revenue per employee – and Apple rakes in nearly $2 million per person.
While these numbers are impressive, not all tech companies on the S&P 500 are masters of scale. In fact, the average tech company brings in closer to $480,000 of revenue per employee.
This amount is comparable to other sectors that make up the S&P 500, like Materials ($600,000 per employee) or Consumer Discretionary ($420,000 per employee).


Technology
Visualizing AI Patents by Country
See which countries have been granted the most AI patents each year, from 2012 to 2022.


Visualizing AI Patents by Country
This was originally posted on our Voronoi app. Download the app for free on iOS or Android and discover incredible data-driven charts from a variety of trusted sources.
This infographic shows the number of AI-related patents granted each year from 2010 to 2022 (latest data available). These figures come from the Center for Security and Emerging Technology (CSET), accessed via Stanford University’s 2024 AI Index Report.
From this data, we can see that China first overtook the U.S. in 2013. Since then, the country has seen enormous growth in the number of AI patents granted each year.
| Year | China | EU and UK | U.S. | RoW | Global Total |
|---|---|---|---|---|---|
| 2010 | 307 | 137 | 984 | 571 | 1,999 |
| 2011 | 516 | 129 | 980 | 581 | 2,206 |
| 2012 | 926 | 112 | 950 | 660 | 2,648 |
| 2013 | 1,035 | 91 | 970 | 627 | 2,723 |
| 2014 | 1,278 | 97 | 1,078 | 667 | 3,120 |
| 2015 | 1,721 | 110 | 1,135 | 539 | 3,505 |
| 2016 | 1,621 | 128 | 1,298 | 714 | 3,761 |
| 2017 | 2,428 | 144 | 1,489 | 1,075 | 5,136 |
| 2018 | 4,741 | 155 | 1,674 | 1,574 | 8,144 |
| 2019 | 9,530 | 322 | 3,211 | 2,720 | 15,783 |
| 2020 | 13,071 | 406 | 5,441 | 4,455 | 23,373 |
| 2021 | 21,907 | 623 | 8,219 | 7,519 | 38,268 |
| 2022 | 35,315 | 1,173 | 12,077 | 13,699 | 62,264 |
In 2022, China was granted more patents than every other country combined.
While this suggests that the country is very active in researching the field of artificial intelligence, it doesn’t necessarily mean that China is the farthest in terms of capability.
Key Facts About AI Patents
According to CSET, AI patents relate to mathematical relationships and algorithms, which are considered abstract ideas under patent law. They can also have different meaning, depending on where they are filed.
In the U.S., AI patenting is concentrated amongst large companies including IBM, Microsoft, and Google. On the other hand, AI patenting in China is more distributed across government organizations, universities, and tech firms (e.g. Tencent).
In terms of focus area, China’s patents are typically related to computer vision, a field of AI that enables computers and systems to interpret visual data and inputs. Meanwhile America’s efforts are more evenly distributed across research fields.
Learn More About AI From Visual Capitalist
If you want to see more data visualizations on artificial intelligence, check out this graphic that shows which job departments will be impacted by AI the most.

-

 Markets1 week ago
U.S. Debt Interest Payments Reach $1 Trillion
-

 Business2 weeks ago
Charted: Big Four Market Share by S&P 500 Audits
-

 Real Estate2 weeks ago
Ranked: The Most Valuable Housing Markets in America
-

 Money2 weeks ago
Which States Have the Highest Minimum Wage in America?
-

 AI2 weeks ago
Ranked: Semiconductor Companies by Industry Revenue Share
-

 Markets2 weeks ago
Ranked: The World’s Top Flight Routes, by Revenue
-

 Demographics2 weeks ago
Population Projections: The World’s 6 Largest Countries in 2075
-

 Markets2 weeks ago
The Top 10 States by Real GDP Growth in 2023