Datastream
The Top 20 Countries for Ultra High Net Worth Individuals


The Briefing
- The U.S. and China contain the most ultra high net worth (UHNW) individuals in the world
- Asia is expected to see the fastest growth in UHNW population over the next five years
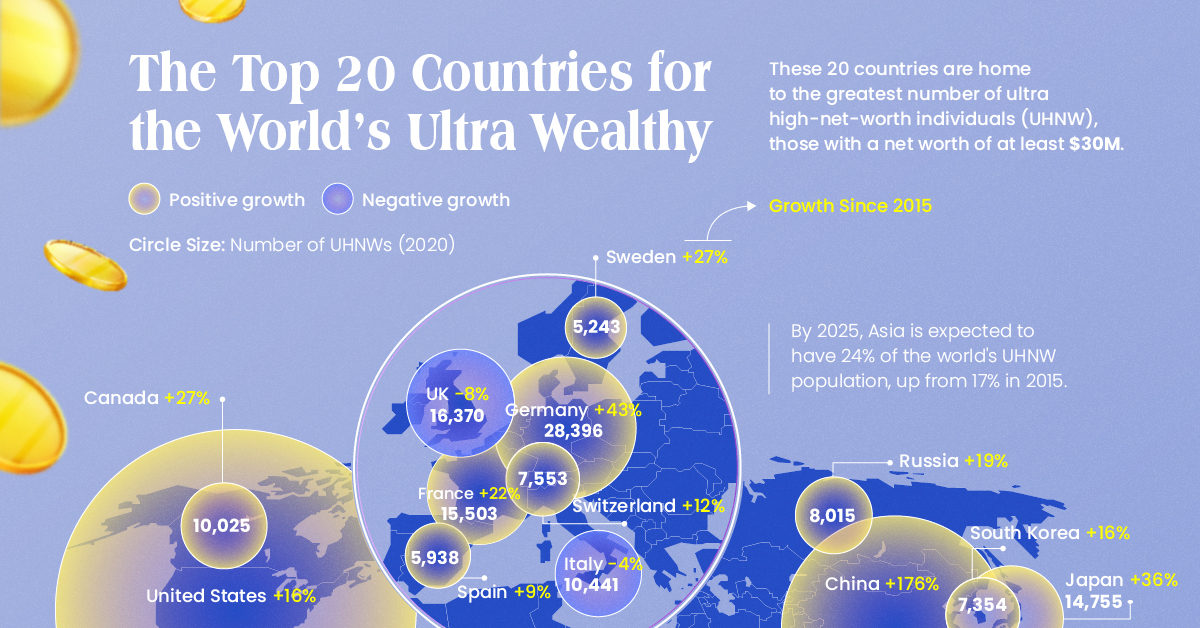
The Top 20 Countries for Ultra High Net Worth Individuals
Despite the global hardships of the COVID-19 pandemic, the world’s ultra high net worth (UHNW) population increased by 2.4% in 2020, reaching an all-time high of 521,653.
In this chart, we’ve used data from The Wealth Report 2021 by Knight Frank to list the 20 countries with the most UHNW individuals.
What is Considered Ultra High Net Worth?
To be considered an UHNW individual, one must have a net worth of at least $30 million.
Net worth is a measure of someone’s current financial position, and is calculated as the value of their assets minus their liabilities. The following table lists examples of each:
| Assets | Liabilities |
|---|---|
|
|
In short, assets are anything that can be sold for money, while liabilities are any debts or financial obligations that one may have.
The Top 20 Countries
Out of the 521,653 UHNW individuals in the world, 414,308 were located in the countries below. This means that almost 80% of the world’s UHNW individuals live in just 20 countries.
| Rank | Country | Number of Ultra Wealthy | Growth Since 2015 |
|---|---|---|---|
| #1 | 🇺🇸 U.S. | 180,060 | 16% |
| #2 | 🇨🇳 China (Mainland) | 70,426 | 137% |
| #3 | 🇩🇪 Germany | 28,396 | 43% |
| #4 | 🇬🇧 UK | 16,370 | -8% |
| #5 | 🇫🇷 France | 15,503 | 22% |
| #6 | 🇯🇵 Japan | 14,755 | 36% |
| #7 | 🇮🇹 Italy | 10,441 | -4% |
| #8 | 🇨🇦 Canada | 10,025 | 27% |
| #9 | 🇷🇺 Russia | 8,015 | 19% |
| #10 | 🇨🇭 Switzerland | 7,553 | 12% |
| #11 | 🇰🇷 South Korea | 7,354 | 16% |
| #12 | 🇸🇦 Saudi Arabia | 7,020 | 227% |
| #13 | 🇮🇳 India | 6,884 | 27% |
| #14 | 🇪🇸 Spain | 5,938 | 9% |
| #15 | 🇸🇪 Sweden | 5,243 | 27% |
| #16 | 🇧🇷 Brazil | 5,140 | -9% |
| #17 | 🇭🇰 Hong Kong SAR | 5,042 | 48% |
| #18 | 🇸🇬 Singapore | 3,732 | 37% |
| #19 | 🇲🇽 Mexico | 3,287 | -4% |
| #20 | 🇦🇺 Australia | 3,124 | 57% |
With just over 180,000 UHNW individuals within its borders, the U.S. continues to be the long-standing leader in this metric. Its five-year growth rate of 16%, however, falls far behind the Chinese Mainland’s impressive 137%.
Whether China can overtake the U.S. as the leader in UHNW population remains to be seen, but momentum appears to be in the Asian nation’s favor. Recently, China became the world’s dominant trading partner, and was one of few countries to report positive GDP growth for 2020.
»Like this? Then you might enjoy this article on the world’s richest families.
Where does this data come from?
Source: Knight Frank
Note: Knight Frank’s dataset lists Hong Kong separately from China


Datastream
Can You Calculate Your Daily Carbon Footprint?
Discover how the average person’s carbon footprint impacts the environment and learn how carbon credits can offset your carbon footprint.


The Briefing
- A person’s carbon footprint is substantial, with activities such as food consumption creating as much as 4,500 g of CO₂ emissions daily.
- By purchasing carbon credits from Carbon Streaming Corporation, you can offset your own emissions and fund positive climate action.
Your Everyday Carbon Footprint
While many large businesses and countries have committed to net-zero goals, it is essential to acknowledge that your everyday activities also contribute to global emissions.
In this graphic, sponsored by Carbon Streaming Corporation, we will explore how the choices we make and the products we use have a profound impact on our carbon footprint.
Carbon Emissions by Activity
Here are some of the daily activities and products of the average person and their carbon footprint, according to Clever Carbon.
| Household Activities & Products | CO2 Emissions (g) |
|---|---|
| 💡 Standard Light Bulb (100 watts, four hours) | 172 g |
| 📱 Mobile Phone Use (195 minutes per day)* | 189 g |
| 👕 Washing Machine (0.63 kWh) | 275 g |
| 🔥 Electric Oven (1.56 kWh) | 675 g |
| ♨️ Tumble Dryer (2.5 kWh) | 1,000 g |
| 🧻 Toilet Roll (2 ply) | 1,300 g |
| 🚿 Hot Shower (10 mins) | 2,000 g |
| 🚙 Daily Commute (one hour, by car) | 3,360 g |
| 🍽️ Average Daily Food Consumption (three meals of 600 calories) | 4,500 g |
| *Phone use based on yearly use of 69kg per the source, Reboxed | |
Your choice of transportation plays a crucial role in determining your carbon footprint. For instance, a 15 km daily commute to work on public transport generates an average of 1,464 g of CO₂ emissions. Compared to 3,360 g—twice the volume for a journey the same length by car.
By opting for more sustainable modes of transport, such as cycling, walking, or public transportation, you can significantly reduce your carbon footprint.
Addressing Your Carbon Footprint
One way to compensate for your emissions is by purchasing high-quality carbon credits.
Carbon credits are used to help fund projects that avoid, reduce or remove CO₂ emissions. This includes nature-based solutions such as reforestation and improved forest management, or technology-based solutions such as the production of biochar and carbon capture and storage (CCS).
While carbon credits offer a potential solution for individuals to help reduce global emissions, public awareness remains a significant challenge. A BCG-Patch survey revealed that only 34% of U.S. consumers are familiar with carbon credits, and only 3% have purchased them in the past.
About Carbon Streaming
By financing the creation or expansion of carbon projects, Carbon Streaming Corporation secures the rights to future carbon credits generated by these sustainable projects. You can then purchase these carbon credits to help fund climate solutions around the world and compensate for your own emissions.
Ready to get involved?
>> Learn more about purchasing carbon credits at Carbon Streaming

-

 Real Estate2 weeks ago
Visualizing America’s Shortage of Affordable Homes
-

 Technology1 week ago
Ranked: Semiconductor Companies by Industry Revenue Share
-

 Money1 week ago
Which States Have the Highest Minimum Wage in America?
-

 Real Estate1 week ago
Ranked: The Most Valuable Housing Markets in America
-

 Business1 week ago
Charted: Big Four Market Share by S&P 500 Audits
-

 AI2 weeks ago
The Stock Performance of U.S. Chipmakers So Far in 2024
-

 Misc2 weeks ago
Almost Every EV Stock is Down After Q1 2024
-

 Money2 weeks ago
Where Does One U.S. Tax Dollar Go?