Datastream
Ranked: The Top 10 Strongest Nation Brands


The Briefing
- A nation’s brand strength is calculated using a number of societal and economic factors
- This year, three new nation’s made the top 10 that weren’t included in 2019— the U.K., Canada, and France
- The new additions bumped Luxembourg, U.A.E, and Finland off the list
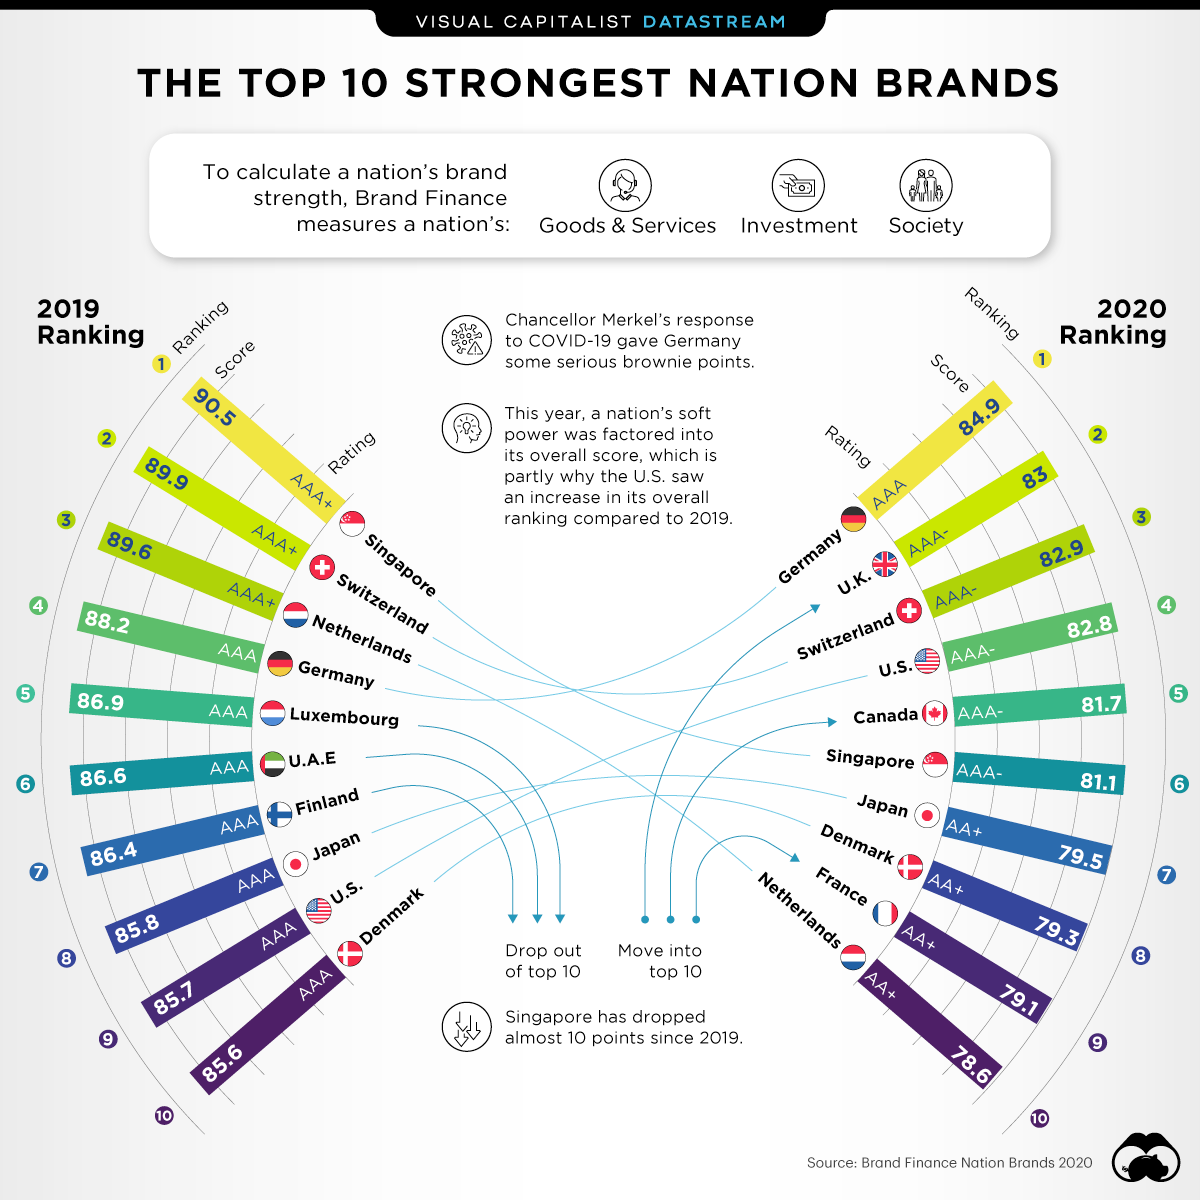
The Top 10 Strongest Nation Brands
Even the strongest nations have been put through the wringer this year. As countries struggle to cope with the impacts of COVID-19, the value of a stable and strong nation brand has become increasingly more apparent.
This might be why Brand Finance’s annual Nation Brands report—which ranks the strongest nation brands across the globe—looks a little bit different this year.
Each year, Brand Finance measures the value and strength of nation brands. Using a number of metrics and data, nations are given a score out of 100. Here’s a look at the top 10 strongest nations, and how they scored:
| Rank | Country | Score |
|---|---|---|
| 1 | 🇩🇪 Germany | 84.9 |
| 2 | 🇬🇧 United Kingdom | 83 |
| 3 | 🇨🇭 Switzerland | 82.9 |
| 4 | 🇺🇸 United States | 82.8 |
| 5 | 🇨🇦 Canada | 81.7 |
| 6 | 🇸🇬 Singapore | 81.1 |
| 7 | 🇯🇵 Japan | 79.5 |
| 8 | 🇩🇰 Denmark | 79.3 |
| 9 | 🇫🇷 France | 79.1 |
| 10 | 🇳🇱 Netherlands | 78.6 |
Since 2015, Singapore has held first place as the strongest nation brand because of its world-class education, low crime, and prosperous economy.
However, Germany stole the top spot this year, which makes sense given Chancellor Merkel’s well-received response to COVID.
The Soft Power Index
This year, Brand Finance also added a new metric to the index, which measured a nation’s “soft power,” or its international reputation and influence.
| Rank | Country | Score |
|---|---|---|
| 1 | 🇺🇸 United States | 67.1 |
| 2 | 🇩🇪 Germany | 61.9 |
| 3 | 🇬🇧 United Kingdom | 61.8 |
| 4 | 🇯🇵 Japan | 60.2 |
| 5 | 🇨🇳 China | 58.7 |
| 6 | 🇫🇷 France | 58.5 |
| 7 | 🇨🇦 Canada | 54.5 |
| 8 | 🇨🇭 Switzerland | 54.5 |
| 9 | 🇸🇪 Sweden | 51.9 |
| 10 | 🇷🇺 Russia | 51.0 |
Germany ranked second on the soft power index, while Singapore didn’t even make the top 10 list. This could be another reason why Germany was able to surmount Singapore as the strongest nation brand in this year’s edition of the report.
Where does this data come from?
Source: Brand Finance Nation Brands 2020
Note: Nation Brand Strength is determined by reference to dozens of data points across 3 “pillars” – Goods & Services, Investment, and Society. See report for full methodology


Datastream
Can You Calculate Your Daily Carbon Footprint?
Discover how the average person’s carbon footprint impacts the environment and learn how carbon credits can offset your carbon footprint.


The Briefing
- A person’s carbon footprint is substantial, with activities such as food consumption creating as much as 4,500 g of CO₂ emissions daily.
- By purchasing carbon credits from Carbon Streaming Corporation, you can offset your own emissions and fund positive climate action.
Your Everyday Carbon Footprint
While many large businesses and countries have committed to net-zero goals, it is essential to acknowledge that your everyday activities also contribute to global emissions.
In this graphic, sponsored by Carbon Streaming Corporation, we will explore how the choices we make and the products we use have a profound impact on our carbon footprint.
Carbon Emissions by Activity
Here are some of the daily activities and products of the average person and their carbon footprint, according to Clever Carbon.
| Household Activities & Products | CO2 Emissions (g) |
|---|---|
| 💡 Standard Light Bulb (100 watts, four hours) | 172 g |
| 📱 Mobile Phone Use (195 minutes per day)* | 189 g |
| 👕 Washing Machine (0.63 kWh) | 275 g |
| 🔥 Electric Oven (1.56 kWh) | 675 g |
| ♨️ Tumble Dryer (2.5 kWh) | 1,000 g |
| 🧻 Toilet Roll (2 ply) | 1,300 g |
| 🚿 Hot Shower (10 mins) | 2,000 g |
| 🚙 Daily Commute (one hour, by car) | 3,360 g |
| 🍽️ Average Daily Food Consumption (three meals of 600 calories) | 4,500 g |
| *Phone use based on yearly use of 69kg per the source, Reboxed | |
Your choice of transportation plays a crucial role in determining your carbon footprint. For instance, a 15 km daily commute to work on public transport generates an average of 1,464 g of CO₂ emissions. Compared to 3,360 g—twice the volume for a journey the same length by car.
By opting for more sustainable modes of transport, such as cycling, walking, or public transportation, you can significantly reduce your carbon footprint.
Addressing Your Carbon Footprint
One way to compensate for your emissions is by purchasing high-quality carbon credits.
Carbon credits are used to help fund projects that avoid, reduce or remove CO₂ emissions. This includes nature-based solutions such as reforestation and improved forest management, or technology-based solutions such as the production of biochar and carbon capture and storage (CCS).
While carbon credits offer a potential solution for individuals to help reduce global emissions, public awareness remains a significant challenge. A BCG-Patch survey revealed that only 34% of U.S. consumers are familiar with carbon credits, and only 3% have purchased them in the past.
About Carbon Streaming
By financing the creation or expansion of carbon projects, Carbon Streaming Corporation secures the rights to future carbon credits generated by these sustainable projects. You can then purchase these carbon credits to help fund climate solutions around the world and compensate for your own emissions.
Ready to get involved?
>> Learn more about purchasing carbon credits at Carbon Streaming

-

 Markets1 week ago
U.S. Debt Interest Payments Reach $1 Trillion
-

 Markets2 weeks ago
Ranked: The Most Valuable Housing Markets in America
-

 Money2 weeks ago
Which States Have the Highest Minimum Wage in America?
-

 AI2 weeks ago
Ranked: Semiconductor Companies by Industry Revenue Share
-

 Markets2 weeks ago
Ranked: The World’s Top Flight Routes, by Revenue
-

 Countries2 weeks ago
Population Projections: The World’s 6 Largest Countries in 2075
-

 Markets2 weeks ago
The Top 10 States by Real GDP Growth in 2023
-

 Money2 weeks ago
The Smallest Gender Wage Gaps in OECD Countries