Markets
Mapped: The World’s Top 10 Cities in 2035
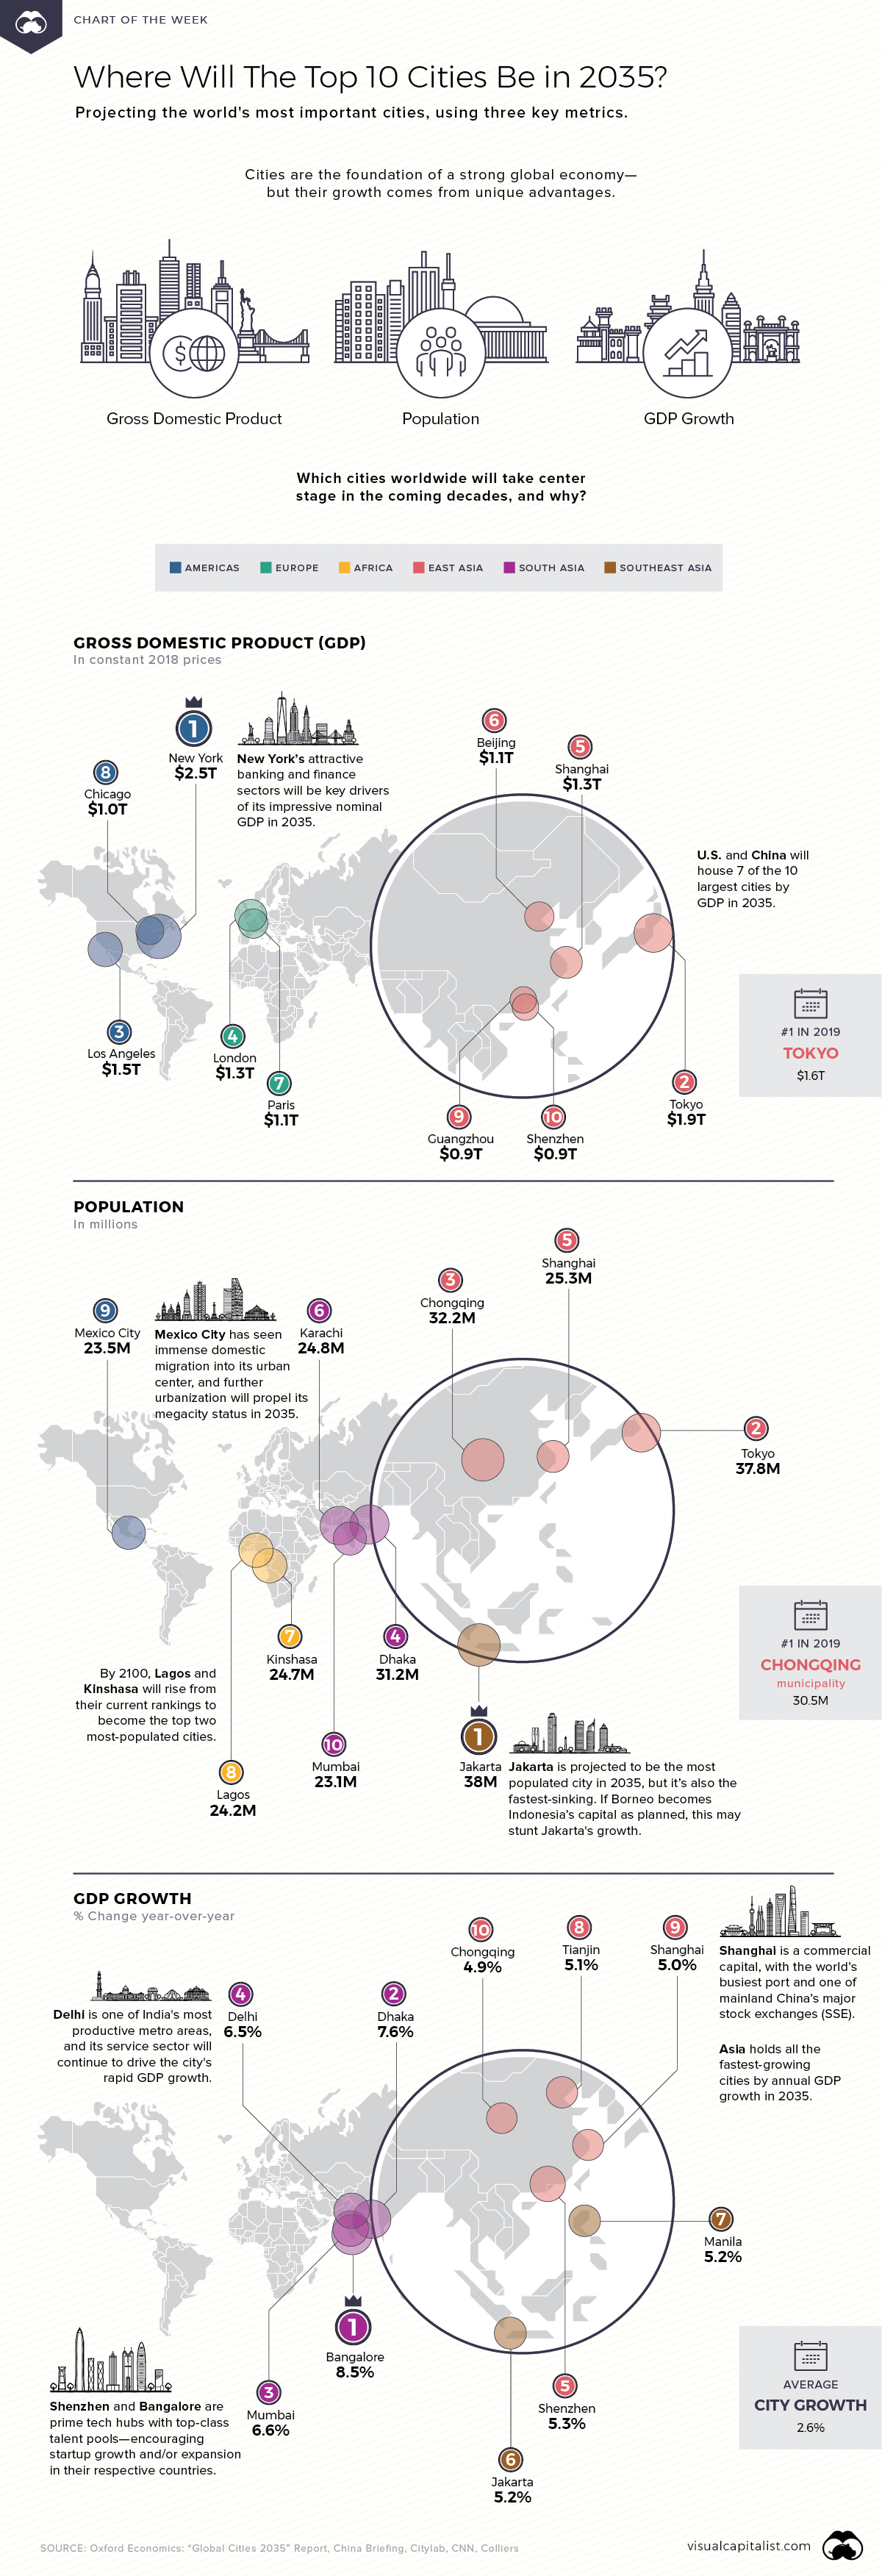
Mapped: Where Will The Top 10 Cities Be in 2035?
Cities are the engines of the modern economy. Over half of the world now lives in urban areas, and urbanization continues to shape the trajectory of global growth in unprecedented ways.
However, the most important cities of today may be quite different than those leading the charge in the future. This week’s chart looks forward to 2035, using a report by Oxford Economics to forecast the top 10 cities by measures of economic size, population, and GDP growth rate.
Each map is categorized by one of these metrics—and depending on which one you look at, the leaders vary greatly.
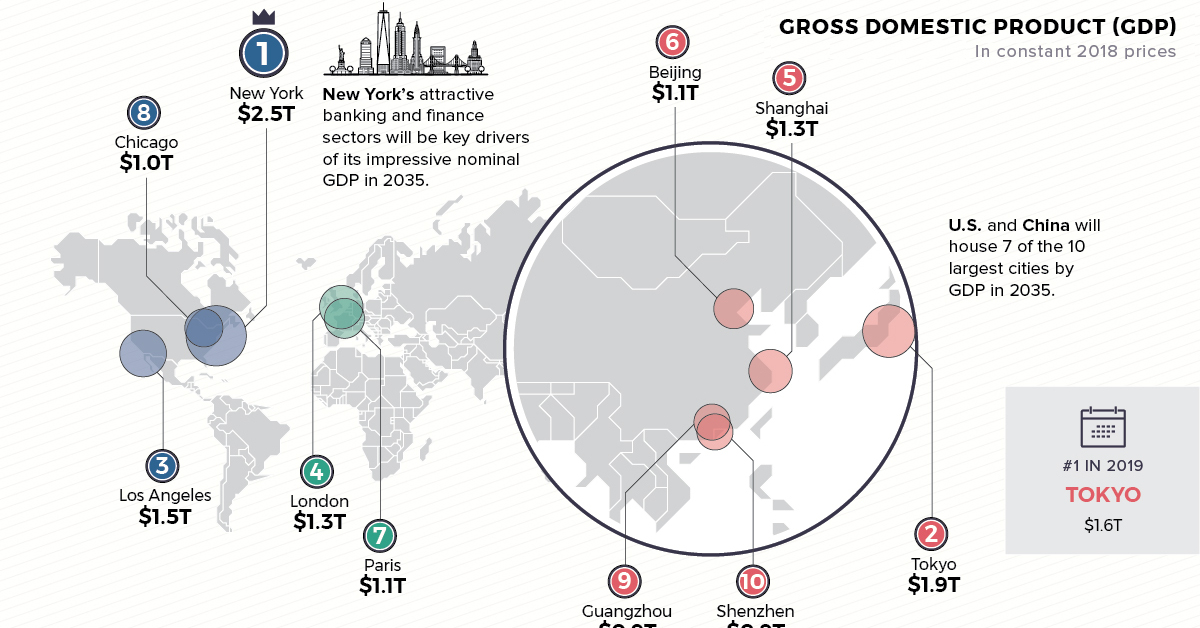
Top 10 Cities by Projected GDP
The top 10 cities by gross domestic product (GDP) in 2035 will be fairly widespread. Three cities are expected to be in the U.S.—New York, Los Angeles, and Chicago. The Big Apple’s forecasted $2.5 trillion GDP likely stems from its strong banking and finance sectors.
| Rank | City | Country | 2035 GDP |
|---|---|---|---|
| #1 | New York | 🇺🇸 United States | $2.5T |
| #2 | Tokyo | 🇯🇵 Japan | $1.9T |
| #3 | Los Angeles | 🇺🇸 United States | $1.5T |
| #4 | London | 🇬🇧 United Kingdom | $1.3T |
| #5 | Shanghai | 🇨🇳 China | $1.3T |
| #6 | Beijing | 🇨🇳 China | $1.1T |
| #7 | Paris | 🇫🇷 France | $1.1T |
| #8 | Chicago | 🇺🇸 United States | $1.0T |
| #9 | Guangzhou | 🇨🇳 China | $0.9T |
| #10 | Shenzhen | 🇨🇳 China | $0.9T |
Four cities will be found in China, while London, Paris, and Tokyo are set to round out the last three. Interestingly, Tokyo is the #1 city today, with an estimated $1.6 trillion GDP in 2019.
Altogether, these top 10 cities will contribute an impressive $13.5 trillion in GDP by 2035. Clusters of such metropolitan areas are typically considered megaregions—which account for a large share of global economic activity.
Top 10 Cities by Future Population
Next, it’s clear that top cities by population will follow a distinct global distribution. By 2035, the most highly-populated cities will shift towards the East, with seven cities located in Asia.
| Rank | City | Country | 2035 Population |
|---|---|---|---|
| #1 | Jakarta | 🇮🇩 Indonesia | 38 million |
| #2 | Tokyo | 🇯🇵 Japan | 37.8 million |
| #3 | Chongqing | 🇨🇳 China | 32.2 million |
| #4 | Dhaka | 🇧🇩 Bangladesh | 31.2 million |
| #5 | Shanghai | 🇨🇳 China | 25.3 million |
| #6 | Karachi | 🇵🇰 Pakistan | 24.8 million |
| #7 | Kinshasa | 🇨🇩 DR Congo | 24.7 million |
| #8 | Lagos | 🇳🇬 Nigeria | 24.2 million |
| #9 | Mexico City | 🇲🇽 Mexico | 23.5 million |
| #10 | Mumbai | 🇮🇳 India | 23.1 million |
While Jakarta’s 38 million-strong population is expected to emerge in first place, the city may not retain its status as Indonesia’s capital for much longer. Rising sea levels and poor water infrastructure management mean that Jakarta is rapidly sinking—and the government now plans to pivot the capital to Borneo island.
On the African continent, Kinshasa and Lagos are already among the world’s largest megacities (home to over 10 million people), and will hold top spots by the turn of the century.
Population and demographics can be major assets to a country’s growth. For example, India’s burgeoning working-age demographics will present a unique advantage—and the country is projected to contain several of the fastest growing cities in the coming years.
Top 10 Cities By Estimated Annual GDP Growth
When comparing cities based on their pace of economic growth, there are some clear standouts. Average annual GDP growth across cities is 2.6%, but the top 10 surpass this by a fair amount.
The kicker? All of 2035’s major players will be found in Asia: four of the fastest-growing cities will be in mainland China, another four in India, and the last two in Southeast Asia.
| Rank | City | Country | Annual Growth |
|---|---|---|---|
| #1 | Bengaluru | 🇮🇳 India | 8.5% |
| #2 | Dhaka | 🇧🇩 Bangladesh | 7.6% |
| #3 | Mumbai | 🇮🇳 India | 6.6% |
| #4 | Delhi | 🇮🇳 India | 6.5% |
| #5 | Shenzhen | 🇨🇳 China | 5.3% |
| #6 | Jakarta | 🇮🇩 Indonesia | 5.2% |
| #7 | Manila | 🇵🇭 Philippines | 5.2% |
| #8 | Tianjin | 🇨🇳 China | 5.1% |
| #9 | Shanghai | 🇨🇳 China | 5.0% |
| #10 | Chongqing | 🇨🇳 China | 4.9% |
At #1 by 2035 is Bangalore with an expected 8.5% annual growth forecast—its high-quality talent pool makes the city a breeding ground for tech startups. Jakarta makes another appearance, with its projected 5.2% growth at double the city average.
Shanghai finds its way onto all three lists. The commercial capital hosts the world’s busiest port, and one of China’s two major stock exchanges. These sectors could help boost Shanghai’s annual GDP growth to 5% in 2035.
Looking to the Future
Of course, any number of variables could impact these 2035 projections, from financial recessions and political uncertainty, to rapid urbanization and technological advances.
But one thing’s certain—in the coming decades, cities are where many of these factors will converge and play out.


Markets
Ranked: The Largest U.S. Corporations by Number of Employees
We visualized the top U.S. companies by employees, revealing the massive scale of retailers like Walmart, Target, and Home Depot.


The Largest U.S. Corporations by Number of Employees
This was originally posted on our Voronoi app. Download the app for free on Apple or Android and discover incredible data-driven charts from a variety of trusted sources.
Revenue and profit are common measures for measuring the size of a business, but what about employee headcount?
To see how big companies have become from a human perspective, we’ve visualized the top U.S. companies by employees. These figures come from companiesmarketcap.com, and were accessed in March 2024. Note that this ranking includes publicly-traded companies only.
Data and Highlights
The data we used to create this list of largest U.S. corporations by number of employees can be found in the table below.
| Company | Sector | Number of Employees |
|---|---|---|
| Walmart | Consumer Staples | 2,100,000 |
| Amazon | Consumer Discretionary | 1,500,000 |
| UPS | Industrials | 500,000 |
| Home Depot | Consumer Discretionary | 470,000 |
| Concentrix | Information Technology | 440,000 |
| Target | Consumer Staples | 440,000 |
| Kroger | Consumer Staples | 430,000 |
| UnitedHealth | Health Care | 400,000 |
| Berkshire Hathaway | Financials | 383,000 |
| Starbucks | Consumer Discretionary | 381,000 |
| Marriott International | Consumer Discretionary | 377,000 |
| Cognizant | Information Technology | 346,600 |
Retail and Logistics Top the List
Companies like Walmart, Target, and Kroger have a massive headcount due to having many locations spread across the country, which require everything from cashiers to IT professionals.
Moving goods around the world is also highly labor intensive, explaining why UPS has half a million employees globally.
Below the Radar?
Two companies that rank among the largest U.S. corporations by employees which may be less familiar to the public include Concentrix and Cognizant. Both of these companies are B2B brands, meaning they primarily work with other companies rather than consumers. This contrasts with brands like Amazon or Home Depot, which are much more visible among average consumers.
A Note on Berkshire Hathaway
Warren Buffett’s company doesn’t directly employ 383,000 people. This headcount actually includes the employees of the firm’s many subsidiaries, such as GEICO (insurance), Dairy Queen (retail), and Duracell (batteries).
If you’re curious to see how Buffett’s empire has grown over the years, check out this animated graphic that visualizes the growth of Berkshire Hathaway’s portfolio from 1994 to 2022.

-

 Business2 weeks ago
America’s Top Companies by Revenue (1994 vs. 2023)
-

 Environment1 week ago
Ranked: Top Countries by Total Forest Loss Since 2001
-

 Real Estate1 week ago
Visualizing America’s Shortage of Affordable Homes
-

 Maps2 weeks ago
Mapped: Average Wages Across Europe
-

 Mining2 weeks ago
Charted: The Value Gap Between the Gold Price and Gold Miners
-

 Demographics2 weeks ago
Visualizing the Size of the Global Senior Population
-

 Misc2 weeks ago
Tesla Is Once Again the World’s Best-Selling EV Company
-

 Technology2 weeks ago
Ranked: The Most Popular Smartphone Brands in the U.S.