Markets
A Timeline of U-Turns from the Chinese Market
China’s economic surge is one of the biggest stories of the 21st century.
Hundreds of millions of people have been lifted out of poverty, and China’s swelling middle class has attracted the interest of Western companies.
As many American companies have discovered, doing business in China is far from straightforward. Recent history is littered with examples of companies that entered the Chinese market to great fanfare, only to retreat a few years later.
Calling Off The Offensive
Today’s infographic highlights 11 companies that ended up tapping the brakes on their ambitious forays on the other side of the Pacific.
Then, we take a look at the factors that influenced these strategic withdrawals.
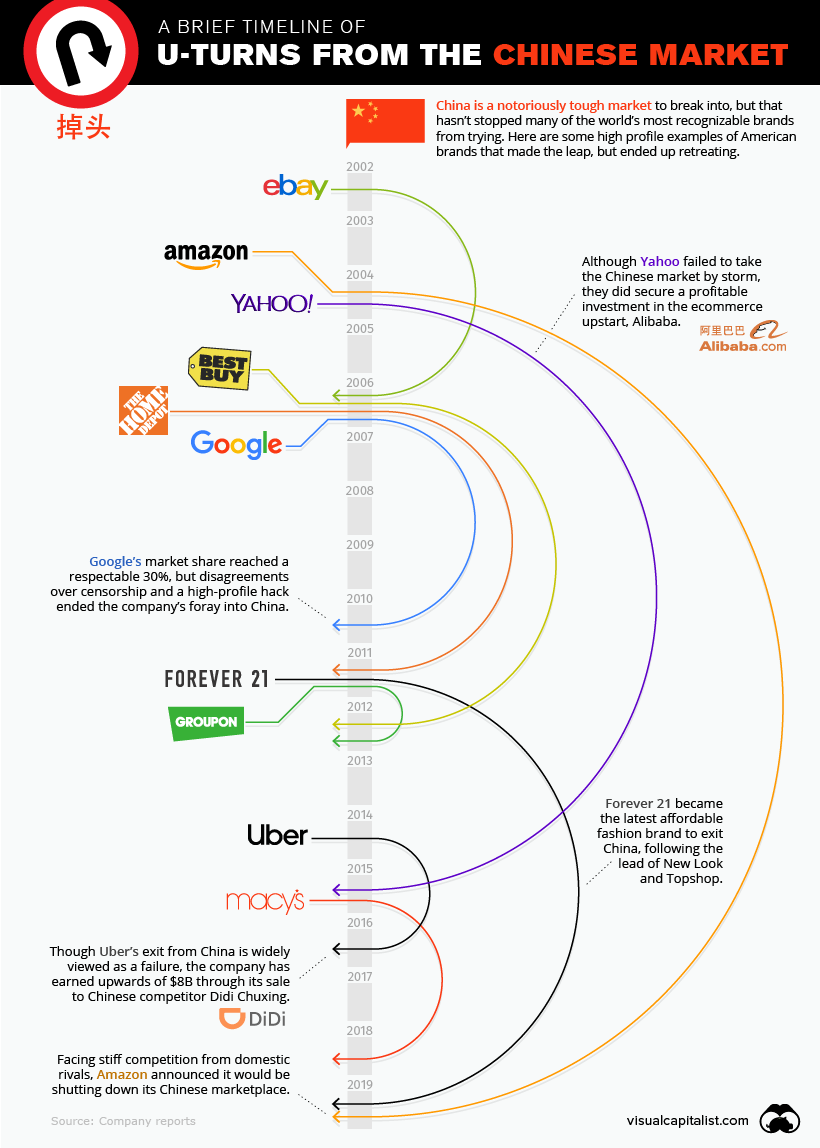
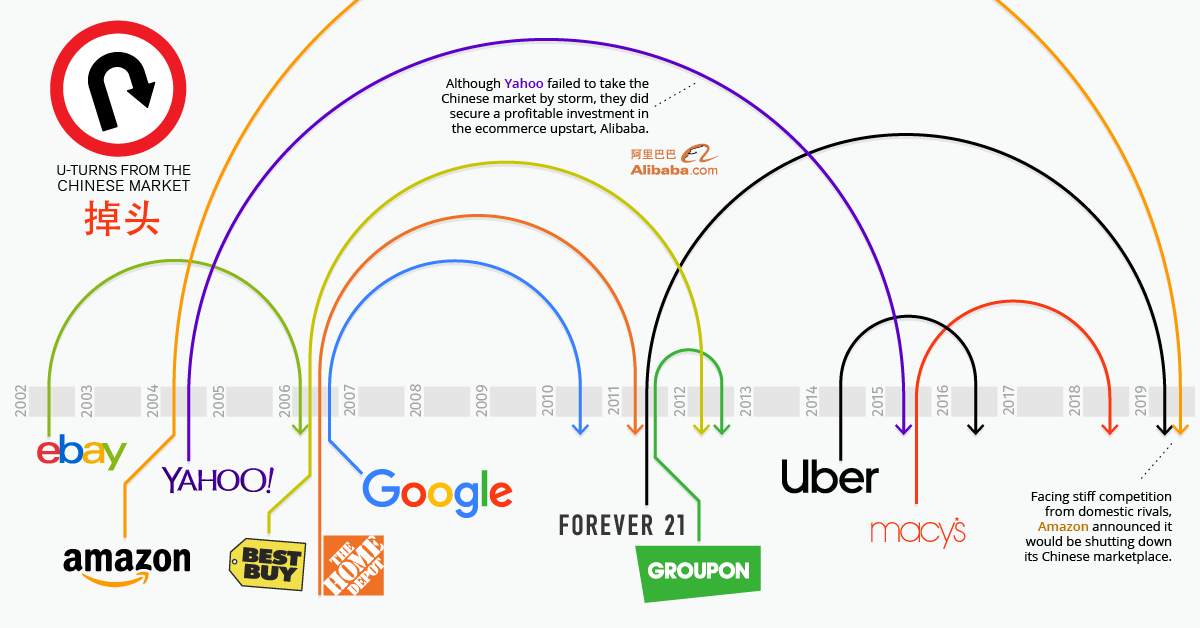
Here are some high profile examples of corporate u-turns by American companies operating in the Chinese market:
When Google China’s search engine was launched in 2006, the company had made the controversial decision to censor search results within the country. Google publicly displayed a disclaimer indicating that some results were removed, which created tensions with the Chinese government.
For a while, things seemed to be going well. Even though a domestic company, Baidu, had captured the majority of the Chinese search market, Google did have a respectable market share of about 30%.
Google China’s fortune took a turn for the worse in 2010 after a major hack – Operation Aurora – exposed user data as well as intellectual property. The hack, which originated from within China, was the last straw for Google’s executive team. After one last ditch effort to provide unfiltered search results within China, the company retreated beyond the firewall.
Amazon
Amazon was an early entrant into the Chinese market. In 2004, the company acquired Joyo – an online shopping site – which was eventually rebranded to Amazon China in 2011.
Amazon China achieved some early success hitting a market share of around 15%, but today, that market share has eroded to less than 1%. Facing nearly insurmountable competition from domestic e-commerce platforms like JD and Taobao, the company recently announced it would be exiting the Chinese market.
Uber
After arriving fashionably late for the ride-hailing party in 2014, it quickly became clear that Uber was facing an uphill battle against well-funded domestic rivals. After only two years, Uber elected to u-turn out of the Chinese market.
Though Uber’s tactical exit from China is often viewed as a failure, the company has earned upwards of $8B through its sale to competitor Didi Chuxing.
A Two-Way Street
Now that red-hot growth at home is beginning to taper off, a number of Chinese companies have begun their push into other markets around the world. Much like their American counterparts, brands pushing beyond China’s borders are seeing varied success in their expansion efforts.
One high-profile example is Huawei. The telecommunications giant has been making inroads in countries around the world – particularly in emerging markets – but has seen pushback and scrutiny in a number of developed economies. Huawei has become a lightning rod for growing concerns over government surveillance and China’s growing influence over the global communications network.
Already, Australia has blocked the company from participating in its 5G network, and in the United States, government agencies are banned from buying Huawei gear.
If negative sentiment continues to build, it remains to be seen whether Huawei and other Chinese companies will follow the playbook of American brands in China, and turn the car around.


Markets
U.S. Debt Interest Payments Reach $1 Trillion
U.S. debt interest payments have surged past the $1 trillion dollar mark, amid high interest rates and an ever-expanding debt burden.


U.S. Debt Interest Payments Reach $1 Trillion
This was originally posted on our Voronoi app. Download the app for free on iOS or Android and discover incredible data-driven charts from a variety of trusted sources.
The cost of paying for America’s national debt crossed the $1 trillion dollar mark in 2023, driven by high interest rates and a record $34 trillion mountain of debt.
Over the last decade, U.S. debt interest payments have more than doubled amid vast government spending during the pandemic crisis. As debt payments continue to soar, the Congressional Budget Office (CBO) reported that debt servicing costs surpassed defense spending for the first time ever this year.
This graphic shows the sharp rise in U.S. debt payments, based on data from the Federal Reserve.
A $1 Trillion Interest Bill, and Growing
Below, we show how U.S. debt interest payments have risen at a faster pace than at another time in modern history:
| Date | Interest Payments | U.S. National Debt |
|---|---|---|
| 2023 | $1.0T | $34.0T |
| 2022 | $830B | $31.4T |
| 2021 | $612B | $29.6T |
| 2020 | $518B | $27.7T |
| 2019 | $564B | $23.2T |
| 2018 | $571B | $22.0T |
| 2017 | $493B | $20.5T |
| 2016 | $460B | $20.0T |
| 2015 | $435B | $18.9T |
| 2014 | $442B | $18.1T |
| 2013 | $425B | $17.2T |
| 2012 | $417B | $16.4T |
| 2011 | $433B | $15.2T |
| 2010 | $400B | $14.0T |
| 2009 | $354B | $12.3T |
| 2008 | $380B | $10.7T |
| 2007 | $414B | $9.2T |
| 2006 | $387B | $8.7T |
| 2005 | $355B | $8.2T |
| 2004 | $318B | $7.6T |
| 2003 | $294B | $7.0T |
| 2002 | $298B | $6.4T |
| 2001 | $318B | $5.9T |
| 2000 | $353B | $5.7T |
| 1999 | $353B | $5.8T |
| 1998 | $360B | $5.6T |
| 1997 | $368B | $5.5T |
| 1996 | $362B | $5.3T |
| 1995 | $357B | $5.0T |
| 1994 | $334B | $4.8T |
| 1993 | $311B | $4.5T |
| 1992 | $306B | $4.2T |
| 1991 | $308B | $3.8T |
| 1990 | $298B | $3.4T |
| 1989 | $275B | $3.0T |
| 1988 | $254B | $2.7T |
| 1987 | $240B | $2.4T |
| 1986 | $225B | $2.2T |
| 1985 | $219B | $1.9T |
| 1984 | $205B | $1.7T |
| 1983 | $176B | $1.4T |
| 1982 | $157B | $1.2T |
| 1981 | $142B | $1.0T |
| 1980 | $113B | $930.2B |
| 1979 | $96B | $845.1B |
| 1978 | $84B | $789.2B |
| 1977 | $69B | $718.9B |
| 1976 | $61B | $653.5B |
| 1975 | $55B | $576.6B |
| 1974 | $50B | $492.7B |
| 1973 | $45B | $469.1B |
| 1972 | $39B | $448.5B |
| 1971 | $36B | $424.1B |
| 1970 | $35B | $389.2B |
| 1969 | $30B | $368.2B |
| 1968 | $25B | $358.0B |
| 1967 | $23B | $344.7B |
| 1966 | $21B | $329.3B |
Interest payments represent seasonally adjusted annual rate at the end of Q4.
At current rates, the U.S. national debt is growing by a remarkable $1 trillion about every 100 days, equal to roughly $3.6 trillion per year.
As the national debt has ballooned, debt payments even exceeded Medicaid outlays in 2023—one of the government’s largest expenditures. On average, the U.S. spent more than $2 billion per day on interest costs last year. Going further, the U.S. government is projected to spend a historic $12.4 trillion on interest payments over the next decade, averaging about $37,100 per American.
Exacerbating matters is that the U.S. is running a steep deficit, which stood at $1.1 trillion for the first six months of fiscal 2024. This has accelerated due to the 43% increase in debt servicing costs along with a $31 billion dollar increase in defense spending from a year earlier. Additionally, a $30 billion increase in funding for the Federal Deposit Insurance Corporation in light of the regional banking crisis last year was a major contributor to the deficit increase.
Overall, the CBO forecasts that roughly 75% of the federal deficit’s increase will be due to interest costs by 2034.

-

 Real Estate2 weeks ago
Visualizing America’s Shortage of Affordable Homes
-

 Technology1 week ago
Ranked: Semiconductor Companies by Industry Revenue Share
-

 Money1 week ago
Which States Have the Highest Minimum Wage in America?
-

 Real Estate1 week ago
Ranked: The Most Valuable Housing Markets in America
-

 Business2 weeks ago
Charted: Big Four Market Share by S&P 500 Audits
-

 AI2 weeks ago
The Stock Performance of U.S. Chipmakers So Far in 2024
-

 Misc2 weeks ago
Almost Every EV Stock is Down After Q1 2024
-

 Money2 weeks ago
Where Does One U.S. Tax Dollar Go?