Markets
A Timeline of U-Turns from the Chinese Market
China’s economic surge is one of the biggest stories of the 21st century.
Hundreds of millions of people have been lifted out of poverty, and China’s swelling middle class has attracted the interest of Western companies.
As many American companies have discovered, doing business in China is far from straightforward. Recent history is littered with examples of companies that entered the Chinese market to great fanfare, only to retreat a few years later.
Calling Off The Offensive
Today’s infographic highlights 11 companies that ended up tapping the brakes on their ambitious forays on the other side of the Pacific.
Then, we take a look at the factors that influenced these strategic withdrawals.
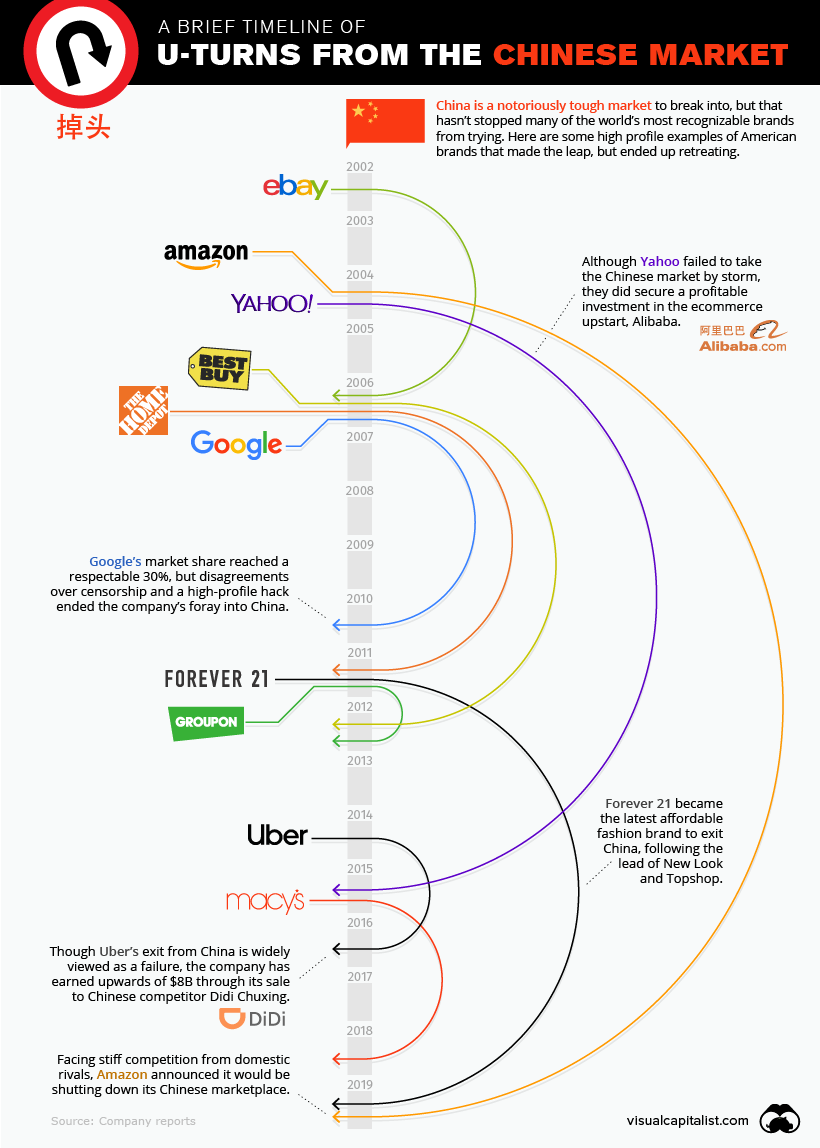
Here are some high profile examples of corporate u-turns by American companies operating in the Chinese market:
When Google China’s search engine was launched in 2006, the company had made the controversial decision to censor search results within the country. Google publicly displayed a disclaimer indicating that some results were removed, which created tensions with the Chinese government.
For a while, things seemed to be going well. Even though a domestic company, Baidu, had captured the majority of the Chinese search market, Google did have a respectable market share of about 30%.
Google China’s fortune took a turn for the worse in 2010 after a major hack – Operation Aurora – exposed user data as well as intellectual property. The hack, which originated from within China, was the last straw for Google’s executive team. After one last ditch effort to provide unfiltered search results within China, the company retreated beyond the firewall.
Amazon
Amazon was an early entrant into the Chinese market. In 2004, the company acquired Joyo – an online shopping site – which was eventually rebranded to Amazon China in 2011.
Amazon China achieved some early success hitting a market share of around 15%, but today, that market share has eroded to less than 1%. Facing nearly insurmountable competition from domestic e-commerce platforms like JD and Taobao, the company recently announced it would be exiting the Chinese market.
Uber
After arriving fashionably late for the ride-hailing party in 2014, it quickly became clear that Uber was facing an uphill battle against well-funded domestic rivals. After only two years, Uber elected to u-turn out of the Chinese market.
Though Uber’s tactical exit from China is often viewed as a failure, the company has earned upwards of $8B through its sale to competitor Didi Chuxing.
A Two-Way Street
Now that red-hot growth at home is beginning to taper off, a number of Chinese companies have begun their push into other markets around the world. Much like their American counterparts, brands pushing beyond China’s borders are seeing varied success in their expansion efforts.
One high-profile example is Huawei. The telecommunications giant has been making inroads in countries around the world – particularly in emerging markets – but has seen pushback and scrutiny in a number of developed economies. Huawei has become a lightning rod for growing concerns over government surveillance and China’s growing influence over the global communications network.
Already, Australia has blocked the company from participating in its 5G network, and in the United States, government agencies are banned from buying Huawei gear.
If negative sentiment continues to build, it remains to be seen whether Huawei and other Chinese companies will follow the playbook of American brands in China, and turn the car around.


Markets
The European Stock Market: Attractive Valuations Offer Opportunities
On average, the European stock market has valuations that are nearly 50% lower than U.S. valuations. But how can you access the market?


European Stock Market: Attractive Valuations Offer Opportunities
Europe is known for some established brands, from L’Oréal to Louis Vuitton. However, the European stock market offers additional opportunities that may be lesser known.
The above infographic, sponsored by STOXX, outlines why investors may want to consider European stocks.
Attractive Valuations
Compared to most North American and Asian markets, European stocks offer lower or comparable valuations.
| Index | Price-to-Earnings Ratio | Price-to-Book Ratio |
|---|---|---|
| EURO STOXX 50 | 14.9 | 2.2 |
| STOXX Europe 600 | 14.4 | 2 |
| U.S. | 25.9 | 4.7 |
| Canada | 16.1 | 1.8 |
| Japan | 15.4 | 1.6 |
| Asia Pacific ex. China | 17.1 | 1.8 |
Data as of February 29, 2024. See graphic for full index names. Ratios based on trailing 12 month financials. The price to earnings ratio excludes companies with negative earnings.
On average, European valuations are nearly 50% lower than U.S. valuations, potentially offering an affordable entry point for investors.
Research also shows that lower price ratios have historically led to higher long-term returns.
Market Movements Not Closely Connected
Over the last decade, the European stock market had low-to-moderate correlation with North American and Asian equities.
The below chart shows correlations from February 2014 to February 2024. A value closer to zero indicates low correlation, while a value of one would indicate that two regions are moving in perfect unison.
| EURO STOXX 50 | STOXX EUROPE 600 | U.S. | Canada | Japan | Asia Pacific ex. China |
|
|---|---|---|---|---|---|---|
| EURO STOXX 50 | 1.00 | 0.97 | 0.55 | 0.67 | 0.24 | 0.43 |
| STOXX EUROPE 600 | 1.00 | 0.56 | 0.71 | 0.28 | 0.48 | |
| U.S. | 1.00 | 0.73 | 0.12 | 0.25 | ||
| Canada | 1.00 | 0.22 | 0.40 | |||
| Japan | 1.00 | 0.88 | ||||
| Asia Pacific ex. China | 1.00 |
Data is based on daily USD returns.
European equities had relatively independent market movements from North American and Asian markets. One contributing factor could be the differing sector weights in each market. For instance, technology makes up a quarter of the U.S. market, but health care and industrials dominate the broader European market.
Ultimately, European equities can enhance portfolio diversification and have the potential to mitigate risk for investors.
Tracking the Market
For investors interested in European equities, STOXX offers a variety of flagship indices:
| Index | Description | Market Cap |
|---|---|---|
| STOXX Europe 600 | Pan-regional, broad market | €10.5T |
| STOXX Developed Europe | Pan-regional, broad-market | €9.9T |
| STOXX Europe 600 ESG-X | Pan-regional, broad market, sustainability focus | €9.7T |
| STOXX Europe 50 | Pan-regional, blue-chip | €5.1T |
| EURO STOXX 50 | Eurozone, blue-chip | €3.5T |
Data is as of February 29, 2024. Market cap is free float, which represents the shares that are readily available for public trading on stock exchanges.
The EURO STOXX 50 tracks the Eurozone’s biggest and most traded companies. It also underlies one of the world’s largest ranges of ETFs and mutual funds. As of November 2023, there were €27.3 billion in ETFs and €23.5B in mutual fund assets under management tracking the index.
“For the past 25 years, the EURO STOXX 50 has served as an accurate, reliable and tradable representation of the Eurozone equity market.”
— Axel Lomholt, General Manager at STOXX
Partnering with STOXX to Track the European Stock Market
Are you interested in European equities? STOXX can be a valuable partner:
- Comprehensive, liquid and investable ecosystem
- European heritage, global reach
- Highly sophisticated customization capabilities
- Open architecture approach to using data
- Close partnerships with clients
- Part of ISS STOXX and Deutsche Börse Group
With a full suite of indices, STOXX can help you benchmark against the European stock market.
Learn how STOXX’s European indices offer liquid and effective market access.

-

 Economy1 day ago
Economic Growth Forecasts for G7 and BRICS Countries in 2024
The IMF has released its economic growth forecasts for 2024. How do the G7 and BRICS countries compare?
-

 Markets1 week ago
U.S. Debt Interest Payments Reach $1 Trillion
U.S. debt interest payments have surged past the $1 trillion dollar mark, amid high interest rates and an ever-expanding debt burden.
-

 United States1 week ago
Ranked: The Largest U.S. Corporations by Number of Employees
We visualized the top U.S. companies by employees, revealing the massive scale of retailers like Walmart, Target, and Home Depot.
-

 Markets2 weeks ago
The Top 10 States by Real GDP Growth in 2023
This graphic shows the states with the highest real GDP growth rate in 2023, largely propelled by the oil and gas boom.
-

 Markets2 weeks ago
Ranked: The World’s Top Flight Routes, by Revenue
In this graphic, we show the highest earning flight routes globally as air travel continued to rebound in 2023.
-

 Markets2 weeks ago
Ranked: The Most Valuable Housing Markets in America
The U.S. residential real estate market is worth a staggering $47.5 trillion. Here are the most valuable housing markets in the country.


-

 Mining1 week ago
Gold vs. S&P 500: Which Has Grown More Over Five Years?
-
Markets2 weeks ago
Ranked: The Most Valuable Housing Markets in America
-

 Money2 weeks ago
Which States Have the Highest Minimum Wage in America?
-

 AI2 weeks ago
Ranked: Semiconductor Companies by Industry Revenue Share
-
Markets2 weeks ago
Ranked: The World’s Top Flight Routes, by Revenue
-

 Countries2 weeks ago
Population Projections: The World’s 6 Largest Countries in 2075
-
Markets2 weeks ago
The Top 10 States by Real GDP Growth in 2023
-

 Demographics2 weeks ago
The Smallest Gender Wage Gaps in OECD Countries