Misc
Timelapse Maps: An Overview of Our Changing Planet
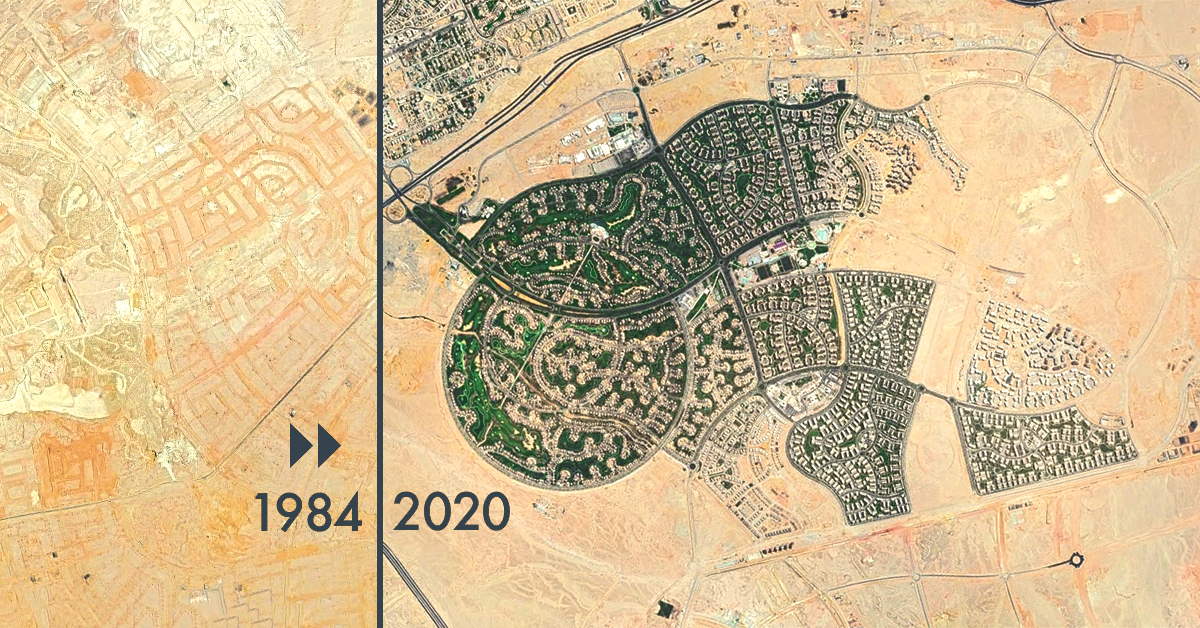
The dramatic growth of Dubai, UAE (1984–2018)
Humankind’s impact on the world is obvious, but our spatial patterns are sometimes difficult to recognize from the ground.
Publicly accessible, high-quality satellite imagery has been a game changer in terms of understanding the scope of forces such as urbanization and land use patterns.
Google Timelapse Maps
Google Earth’s timelapsed satellite maps capture the drastic changes the planet’s surface has undergone over the past 34 years. Each timelapse comprises 35 cloud-free pictures, which have been made interactive by the CREATE Lab at Carnegie Mellon University.
Three different satellites acquired 15 million images over the past three decades. The majority of the images come from Landsat, a joint USGS/NASA Earth observation program. For the years 2015 to 2018, Google combined imagery from Landsat 8 and Sentinel-2A. Sentinel is part of the European Commission and European Space Agency’s Copernicus Earth observation program.
Deforestation, urban growth, and natural resource extraction are just some of the human patterns and impacts that can be visualized.
Editor’s note: to view the following timelapses, press the play button on any map. You can also view individual years in the time periods as well. On slower internet connections you may need to have patience, as the series of images can take some time to load or display.
Cities and Infrastructure
Urban Growth: Pearl River Delta, China
Up to 1979, China’s Pearl River Delta had seen little urbanization. However in 1980, the People’s Republic of China established a special economic zone, Shenzhen, to attract foreign investment. In the following years, buildings and paved surfaces rapidly replaced the rural settings around the river delta. This is the Lunjiao area just south of Guangzhou.
Urban Growth: Cairo, Egypt
The present-day location of Cairo has been a city for more than 1,000 years, and its constrained urban footprint is now bursting at the seams thanks to Egypt’s population growth. A new city is being built in the nearby stretch of desert land (agricultural land is scarce) that will one day replace ancient Cairo as Egypt’s capital. If the government’s ambitious plans are realized, this desert boomtown could have a population of over 6 million people.
The Egyptian state needed this kind of project a long time ago. Cairo [is] a capital that is full of traffic jams, very crowded. The infrastructure cannot absorb more people.
– Khaled el-Husseiny Soliman
Urban Growth: Phoenix, Arizona
According to estimates from the U.S. Census Bureau, Phoenix is the fastest-growing city in the United States. Over the past two decades, the suburb of Chandler evolved from agricultural uses to sprawling residential developments. This pattern was repeated in a number of cities in the Southern U.S., most notably Las Vegas.
Construction: The Brandenburg Airport, Germany
Berlin’s long overdue Brandenburg Airport began construction in 2006, with the airport initially expected to open in 2011. However, the airport has been subject to numerous delays and the airport now has a new opening date. Berlin Brandenburg Airport is now expected to open on Oct. 31, 2020.
Megaproject: Yangshan Port
The Port of Shanghai became one of the most important transportation hubs in the world after the completion of its offshore expansion – the Yangshan Port.
Building this massive port was a gargantuan engineering feat. First, land reclamation was used to connect two islands 20 miles southeast of Shanghai. Next, the port was connected to the mainland via the Donghai Bridge, which opened in 2005 as the world’s longest sea crossing. The six-lane bridge took 6,000 workers two and half years to construct.
In 2016, the Port of Shanghai was the largest shipping port in the world, handling 37.1 million twenty-foot container equivalents.
Resource Extraction
Mining: Chuquicamata, Chile
Chuquicamata is the largest open pit copper mine by volume in the world, located 800 miles north of the Chilean capital, Santiago. In 2019, Chile’s national mining company Codelco initiated underground mining at Chuquicamata.
Deforestation: Ñuflo de Chávez, Bolivia
Ñuflo de Chávez is one of the 15 provinces of the Bolivian Santa Cruz Department. Satellite images of southern Ñuflo de Chávez illustrate deforestation from agrarian expansion in the jungles of the Amazon. From the air, the deforestation takes on a unique grid pattern with circular clearings. Developed as part of an organized resettlement scheme, each circle is anchored by community amenities and housing, and surrounded by fields of soybeans cultivated for export.
According to Brazil’s National Institute for Space Research, 8.4 million soccer fields of land have been deforested in the Amazon over the past decade.
Shale Gas Boom: Odessa, Texas
The small town of Odessa sits in the middle of one of the most productive shale gas regions in the world, the Permian Basin. The region is expected to generate an average of 3.9 million barrels per day, roughly a third of total U.S. oil production. While the gas may come from underground, the pursuit of this source of energy has drastically altered the landscape, marking the terrain with roads, wells, and housing for workers.
Changing Environment
Drying of the Aral Sea: Kazakhstan and Uzbekistan
It took almost 30 years to make a sea disappear. When the Soviet Union diverted the Amu Darya and Syr Darya rivers to irrigate cotton and rice fields in the 1960s, it turned the Aral Sea into a desert. Once the world’s fourth largest lake, the region is struggling to restore water levels and aquatic habitats.
Glacier Retreat: Columbia Glacier, Alaska, USA
The Columbia Glacier is a tidewater glacier that flows through the valleys of the Chugach Mountains and into Alaska’s Prince William Sound. Increased temperatures initiated a retreat in the length of the glacier over three decades ago. Once in motion, a glacier’s retreat accelerates due to glacial mechanics. It is one of the most rapidly changing glaciers in the world.
Changing Rivers: Iquitos, Peru
Not all change is from humans. There are natural physical processes that continue to shape the Earth’s surface. For example, rivers that experience heavy water flows can be altered through erosion, changing the bends.
Better Perspectives, Better Decisions?
Often, the greatest impacts that occur are out of sight and mind. However, with the increasing availability of satellite technology and improved distribution of images through platforms such as Google Timelapse, the impact of human activity is impossible to ignore.
The bulk of visible changes come from human economic activity, because it is more easily observable on a smaller time scale. However, it’s also worth remembering that there are still many natural processes that take generations, if not thousands of years to affect change.
It is one thing to hear the facts and figures of humankind’s impact on the environment, but to see the change is a whole other story.


Misc
How Hard Is It to Get Into an Ivy League School?
We detail the admission rates and average annual cost for Ivy League schools, as well as the median SAT scores required to be accepted.


How Hard Is It to Get Into an Ivy League School?
This was originally posted on our Voronoi app. Download the app for free on iOS or Android and discover incredible data-driven charts from a variety of trusted sources.
Ivy League institutions are renowned worldwide for their academic excellence and long-standing traditions. But how hard is it to get into one of the top universities in the U.S.?
In this graphic, we detail the admission rates and average annual cost for Ivy League schools, as well as the median SAT scores required to be accepted. The data comes from the National Center for Education Statistics and was compiled by 24/7 Wall St.
Note that “average annual cost” represents the net price a student pays after subtracting the average value of grants and/or scholarships received.
Harvard is the Most Selective
The SAT is a standardized test commonly used for college admissions in the United States. It’s taken by high school juniors and seniors to assess their readiness for college-level academic work.
When comparing SAT scores, Harvard and Dartmouth are among the most challenging universities to gain admission to. The median SAT scores for their students are 760 for reading and writing and 790 for math. Still, Harvard has half the admission rate (3.2%) compared to Dartmouth (6.4%).
| School | Admission rate (%) | SAT Score: Reading & Writing | SAT Score: Math | Avg Annual Cost* |
|---|---|---|---|---|
| Harvard University | 3.2 | 760 | 790 | $13,259 |
| Columbia University | 3.9 | 750 | 780 | $12,836 |
| Yale University | 4.6 | 760 | 780 | $16,341 |
| Brown University | 5.1 | 760 | 780 | $26,308 |
| Princeton University | 5.7 | 760 | 780 | $11,080 |
| Dartmouth College | 6.4 | 760 | 790 | $33,023 |
| University of Pennsylvania | 6.5 | 750 | 790 | $14,851 |
| Cornell University | 7.5 | 750 | 780 | $29,011 |
*Costs after receiving federal financial aid.
Additionally, Dartmouth has the highest average annual cost at $33,000. Princeton has the lowest at $11,100.
While student debt has surged in the United States in recent years, hitting $1.73 trillion in 2023, the worth of obtaining a degree from any of the schools listed surpasses mere academics. This is evidenced by the substantial incomes earned by former students.
Harvard grads, for example, have the highest average starting salary in the country, at $91,700.

-

 Real Estate2 weeks ago
Visualizing America’s Shortage of Affordable Homes
-

 Technology1 week ago
Ranked: Semiconductor Companies by Industry Revenue Share
-

 Money1 week ago
Which States Have the Highest Minimum Wage in America?
-

 Real Estate1 week ago
Ranked: The Most Valuable Housing Markets in America
-

 Business2 weeks ago
Charted: Big Four Market Share by S&P 500 Audits
-

 AI2 weeks ago
The Stock Performance of U.S. Chipmakers So Far in 2024
-

 Misc2 weeks ago
Almost Every EV Stock is Down After Q1 2024
-

 Money2 weeks ago
Where Does One U.S. Tax Dollar Go?