Money
Ranked: The World’s Richest Families in 2020
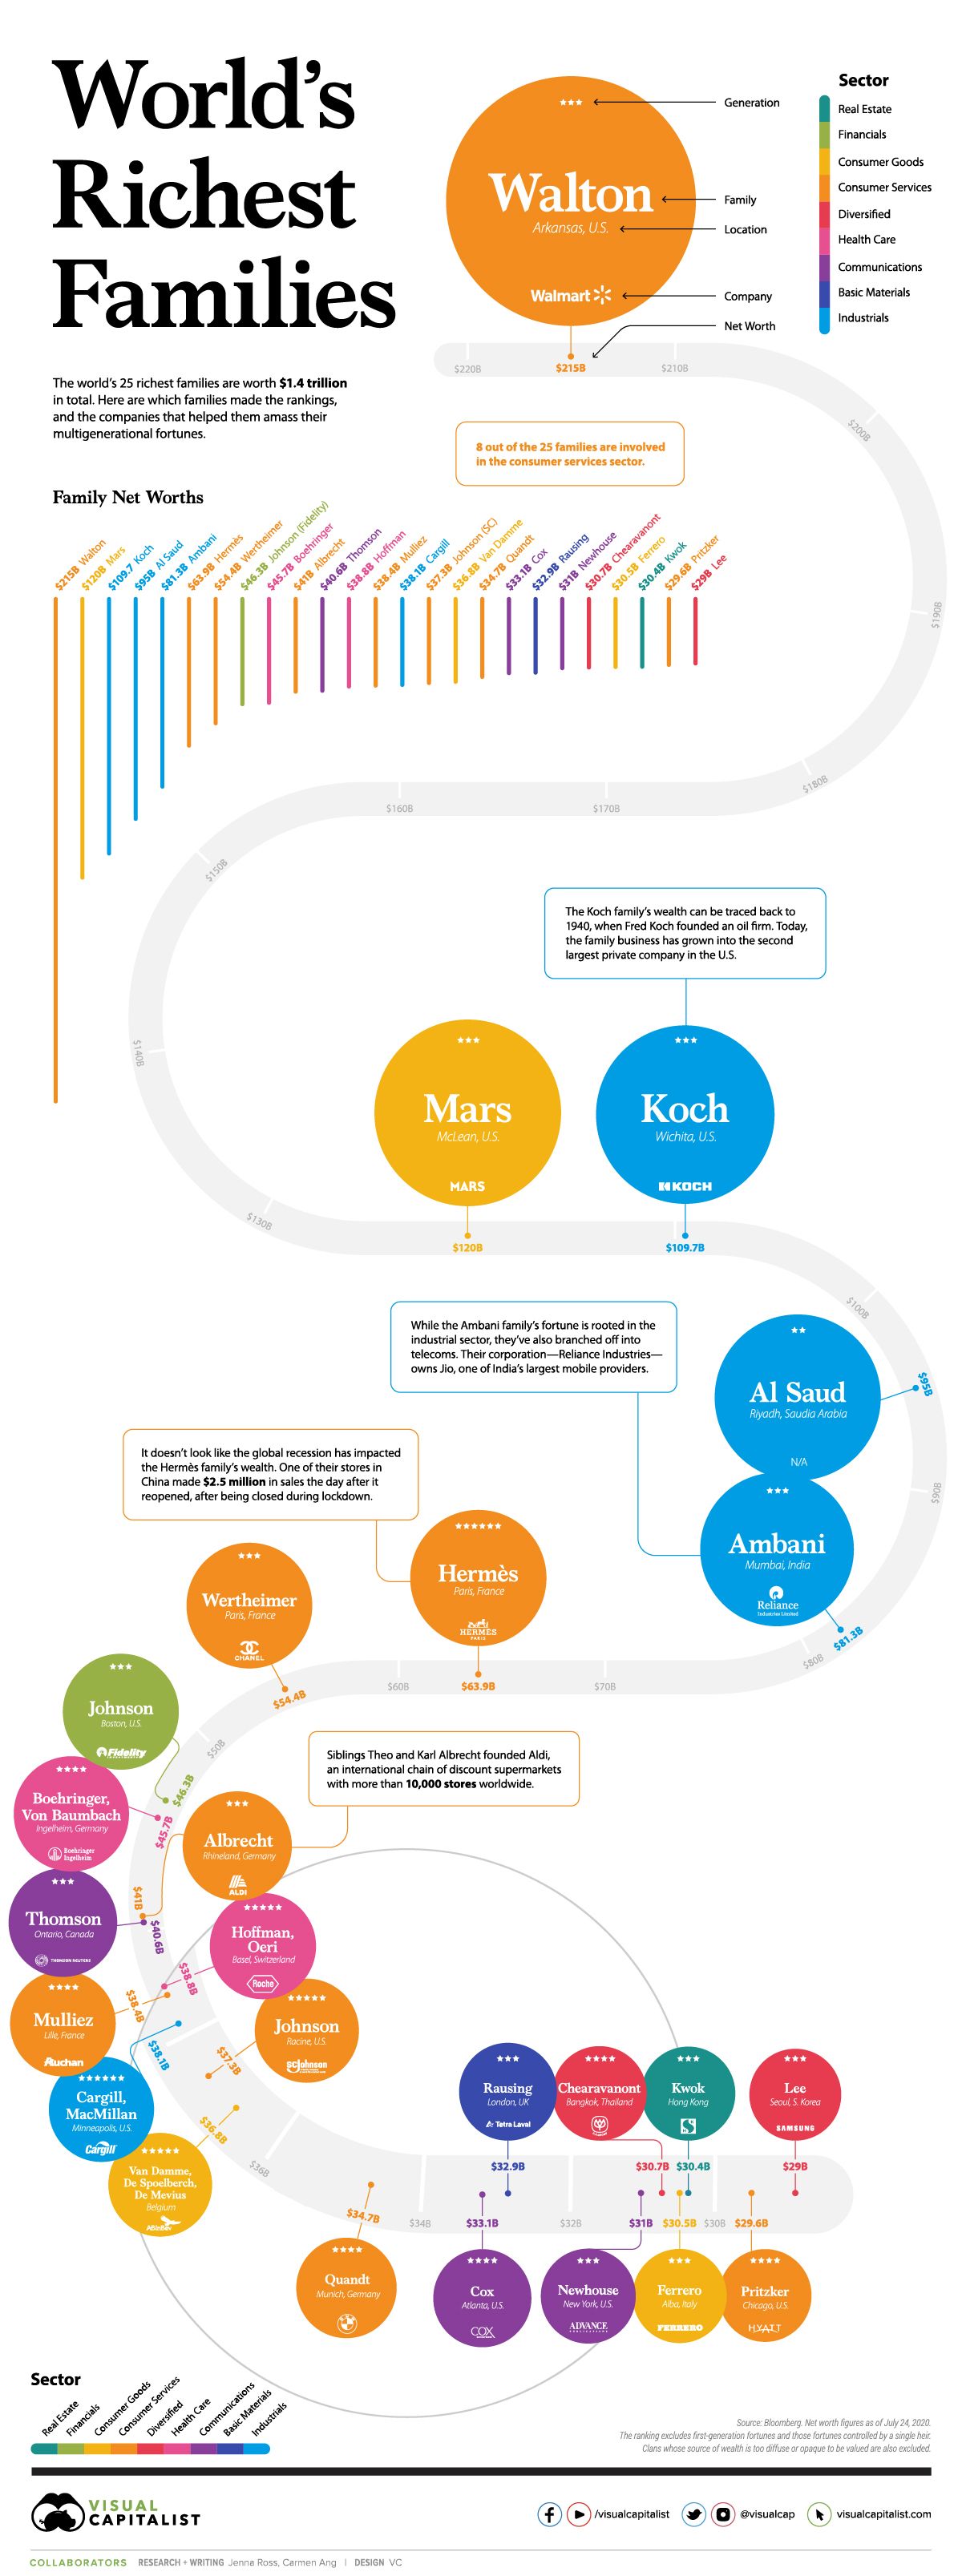


The World’s Richest Families in 2020
The COVID-19 pandemic hasn’t stopped the world’s wealthiest families from growing their fortunes. Over the past year, the richest family—the Waltons—grew their wealth by $25 billion, or almost $3 million per hour.
This graphic, using data from Bloomberg, ranks the 25 most wealthy families in the world. The data excludes first-generation wealth and wealth controlled by a single heir, which is why you don’t see Jeff Bezos or Bill Gates on the list. Families whose source of wealth is too diffused or opaque to be valued are also excluded.
The Full Breakdown
Intergenerational wealth is a powerful thing. It often prevails through market crashes, social turmoil, and economic uncertainty, and this year has been no exception.
Here’s a look at the 25 most wealthy families in 2020:
| Rank | Name | Company | Wealth, $B | Sector | Location |
|---|---|---|---|---|---|
| 1 | Walton | Walmart | 215 | Consumer services | 🇺🇸 Bentonville, Arkansas |
| 2 | Mars | Mars | 120 | Consumer goods | 🇺🇸 McLean, Virginia |
| 3 | Koch | Koch Industries | 109.7 | Industrials | 🇺🇸 Wichita, Kansas |
| 4 | Al Saud | N/A | 95 | Industrials | 🇸🇦 Riyadh, Saudi Arabia |
| 5 | Ambani | Reliance Industries | 81.3 | Industrials | 🇮🇳 Mumbai, India |
| 6 | Hermès | Hermès | 63.9 | Consumer services | 🇫🇷 Paris, France |
| 7 | Wertheimer | Chanel | 54.4 | Consumer services | 🇫🇷 Paris, France |
| 8 | Johnson (Fidelity) | Fidelity Investments | 46.3 | Financials | 🇺🇸 Boston, New York |
| 9 | Boehringer, Von Baumbach | Boehringer Ingelheim | 45.7 | Health care | 🇩🇪 Inglheim, Germany |
| 10 | Albrecht | Aldi | 41 | Consumer services | 🇩🇪 Rhineland, Germany |
| 11 | Thomson | Thomson Reuters | 40.6 | Communication | 🇨🇦 Ontario, Canada |
| 12 | Hoffmann, Oeri | Roche | 38.8 | Health care | 🇨🇭 Basel, Switzerland |
| 13 | Mulliez | Auchan | 38.4 | Consumer services | 🇫🇷 Lille, France |
| 14 | Cargill, MacMillan | Cargill | 38.1 | Industrials | 🇺🇸 Minneapolis, Minnesota |
| 15 | Johnson (SC) | SC Johnson | 37.3 | Consumer services | 🇺🇸 Racine, Wisconsin |
| 16 | Van Damme, De Spoelberch, De Mevius | Anheuser-Busch InBev | 36.8 | Consumer goods | 🇧🇪 Belgium |
| 17 | Quandt | BMW | 34.7 | Consumer services | 🇩🇪 Munich, Germany |
| 18 | Cox | Cox Enterprises | 33.1 | Communication | 🇺🇸 Atlanta, Georgia |
| 19 | Rausing | Tetra Laval | 32.9 | Materials | 🇬🇧 London, England |
| 20 | Newhouse | Advance Publications | 31 | Communication | 🇺🇸 New York, New York |
| 21 | Chearavanont | Charoen Pokphand Group | 30.7 | Diversified | 🇹🇭 Bangkok, Thailand |
| 22 | Ferrero | Ferrero | 30.5 | Consumer goods | 🇮🇹 Alba, Italy |
| 23 | Kwok | Sun Hung Kai Properties | 30.4 | Real estate | 🇭🇰 Hong Kong |
| 24 | Pritzker | Hyatt Hotels | 29.6 | Consumer services | 🇺🇸 Chicago, Illinois |
| 25 | Lee | Samsung | 29 | Diversified | 🇰🇷 Seoul, South Korea |
*Note: The Al Saud’s net worth is based on cumulative payouts royal family members were estimated to have received over the past 50 years.
The Waltons are the richest family on the list by far, with a net worth of $215 billion—that’s $95 billion more than the second wealthiest family. Sam Walton, the family’s patriarch, founded Walmart in 1962. Since then, it’s become the world’s largest retailer by revenue.
When Sam passed away in 1992, his three children—James, Alice, and Rob—inherited his fortune. Now, the trio co-owns about half of Walmart.
In second place is the Mars family, with a net worth of $120 billion. The family is well-known for their candy empire, but interestingly, about half of the company’s value comes from pet care holdings. Mars Inc. owns several popular pet food brands, including Pedigree, Cesar, and Royal Canin—and it expanded its pet presence further in 2017 when it acquired VCA, a company with almost 800 small animal vet hospitals across the U.S. and Canada.
The Koch family is the world’s third-richest family. Their fortune is rooted in an oil firm founded by Fred C. Koch. Following Fred’s death in 1967, the firm was inherited by his four sons—Frederick, Charles, David, and William. After a family feud, Frederick and William left the business, and Charles and David went on to build the mega industrial conglomerate known as Koch Industries.
Despite being affected by the oil crash this year, the Koch family’s wealth still sits at $109.7 billion. Before David’s passing in 2019, he and his brother Charles were heavily involved in politics—and their political efforts were the subject of much scrutiny.
Richest Families, by Sector
It’s important to note that many of these families have diversified their investments across a variety of industries. For instance, while the Koch family’s wealth is largely concentrated in the industrial sector and commodities, they also dabble in real-estate—in May 2020, they made a $200 million bet on U.S. rental homes.
That being said, it’s interesting to see where each of these families started, and which sectors have bred the highest number of ultra-wealthy families.
Here’s a breakdown of each sector and how many families on the list got started in them:
| Sector | Number of Families | Total Wealth, $B |
|---|---|---|
| Consumer Services | 8 | 514.3 |
| Industrials | 4 | 324.1 |
| Consumer Goods | 3 | 187.3 |
| Communications | 3 | 104.7 |
| Health Care | 2 | 84.5 |
| Diversified | 2 | 59.7 |
| Financials | 1 | 46.3 |
| Basical Materials | 1 | 32.9 |
| Real Estate | 1 | 30.4 |
The top sector is consumer services—8 of the 25 families are heavily involved in this sector. Walmart helped generate the most wealth out of families in this space, while luxury brands Hermès and Chanel were the source of fortune for the next two wealthiest families.
Industrial is the second largest sector, with 4 of the 25 families involved. It’s also one of the most lucrative sectors—out of the top five wealthiest families on the list, three are in industrials. The Koch family is the wealthiest family in this category, followed by the Al Saud family and the Ambani family, respectively.
Communications and consumer goods are tied for third, with 3 of the 25 families in each. The Thomsons, who founded Thomson Reuters, are the wealthiest family in communications, while the Mars family has the highest net worth in the consumer goods sector.
Resilient, but not Bulletproof
Despite a global recession, most of the world’s wealthiest families seem to be doing just fine—however, not everyone on the list has been thriving this year.
The Koch family’s fortune dropped by $15 billion from 2019 to 2020, and the current political climate in Hong Kong has had a negative impact on the Kwok family’s real estate empire.
While intergenerational wealth certainty has resilience, how much economic and social turmoil can it withstand? It’ll be interesting to see which families make the list in 2021.


Money
How Debt-to-GDP Ratios Have Changed Since 2000
See how much the debt-to-GDP ratios of advanced economies have grown (or shrank) since the year 2000.


How Debt-to-GDP Ratios Have Changed Since 2000
This was originally posted on our Voronoi app. Download the app for free on Apple or Android and discover incredible data-driven charts from a variety of trusted sources.
Government debt levels have grown in most parts of the world since the 2008 financial crisis, and even more so after the COVID-19 pandemic.
To gain perspective on this long-term trend, we’ve visualized the debt-to-GDP ratios of advanced economies, as of 2000 and 2024 (estimated). All figures were sourced from the IMF’s World Economic Outlook.
Data and Highlights
The data we used to create this graphic is listed in the table below. “Government gross debt” consists of all liabilities that require payment(s) of interest and/or principal in the future.
| Country | 2000 (%) | 2024 (%) | Change (pp) |
|---|---|---|---|
| 🇯🇵 Japan | 135.6 | 251.9 | +116.3 |
| 🇸🇬 Singapore | 82.3 | 168.3 | +86.0 |
| 🇺🇸 United States | 55.6 | 126.9 | +71.3 |
| 🇬🇧 United Kingdom | 36.6 | 105.9 | +69.3 |
| 🇬🇷 Greece | 104.9 | 160.2 | +55.3 |
| 🇫🇷 France | 58.9 | 110.5 | +51.6 |
| 🇵🇹 Portugal | 54.2 | 104.0 | +49.8 |
| 🇪🇸 Spain | 57.8 | 104.7 | +46.9 |
| 🇸🇮 Slovenia | 25.9 | 66.5 | +40.6 |
| 🇫🇮 Finland | 42.4 | 76.5 | +34.1 |
| 🇭🇷 Croatia | 35.4 | 61.8 | +26.4 |
| 🇨🇦 Canada | 80.4 | 103.3 | +22.9 |
| 🇨🇾 Cyprus | 56.0 | 70.9 | +14.9 |
| 🇦🇹 Austria | 65.7 | 74.0 | +8.3 |
| 🇸🇰 Slovak Republic | 50.5 | 56.5 | +6.0 |
| 🇩🇪 Germany | 59.3 | 64.0 | +4.7 |
| 🇧🇪 Belgium | 109.6 | 106.8 | -2.8 |
| 🇮🇱 Israel | 77.4 | 56.8 | -20.6 |
| 🇮🇸 Iceland | 75.8 | 54.6 | -21.2 |
The debt-to-GDP ratio indicates how much a country owes compared to the size of its economy, reflecting its ability to manage and repay debts. Percentage point (pp) changes shown above indicate the increase or decrease of these ratios.
Countries with the Biggest Increases
Japan (+116 pp), Singapore (+86 pp), and the U.S. (+71 pp) have grown their debt as a percentage of GDP the most since the year 2000.
All three of these countries have stable, well-developed economies, so it’s unlikely that any of them will default on their growing debts. With that said, higher government debt leads to increased interest payments, which in turn can diminish available funds for future government budgets.
This is a rising issue in the U.S., where annual interest payments on the national debt have surpassed $1 trillion for the first time ever.
Only 3 Countries Saw Declines
Among this list of advanced economies, Belgium (-2.8 pp), Iceland (-21.2 pp), and Israel (-20.6 pp) were the only countries that decreased their debt-to-GDP ratio since the year 2000.
According to Fitch Ratings, Iceland’s debt ratio has decreased due to strong GDP growth and the use of its cash deposits to pay down upcoming maturities.
See More Debt Graphics from Visual Capitalist
Curious to see which countries have the most government debt in dollars? Check out this graphic that breaks down $97 trillion in debt as of 2023.

-

 Real Estate2 weeks ago
Visualizing America’s Shortage of Affordable Homes
-

 Technology1 week ago
Ranked: Semiconductor Companies by Industry Revenue Share
-

 Money2 weeks ago
Which States Have the Highest Minimum Wage in America?
-

 Real Estate2 weeks ago
Ranked: The Most Valuable Housing Markets in America
-

 Business2 weeks ago
Charted: Big Four Market Share by S&P 500 Audits
-

 AI2 weeks ago
The Stock Performance of U.S. Chipmakers So Far in 2024
-

 Misc2 weeks ago
Almost Every EV Stock is Down After Q1 2024
-

 Money2 weeks ago
Where Does One U.S. Tax Dollar Go?