Markets
The World’s Most Powerful Reserve Currencies
The World’s Most Powerful Reserve Currencies
When we think of network effects, we’re usually thinking of them in the context of technology and Metcalfe’s Law.
Metcalfe’s Law states that the more users that a network has, the more valuable it is to those users. It’s a powerful idea that is exploited by companies like LinkedIn, Airbnb, or Uber — all companies that provide a more beneficial service as their networks gain more nodes.
But network effects don’t apply just to technology and related fields.
In the financial sector, for example, stock exchanges grow in utility when they have more buyers, sellers, and volume. Likewise, in international finance, a currency can become increasingly entrenched when it’s accepted, used, and trusted all over the world.
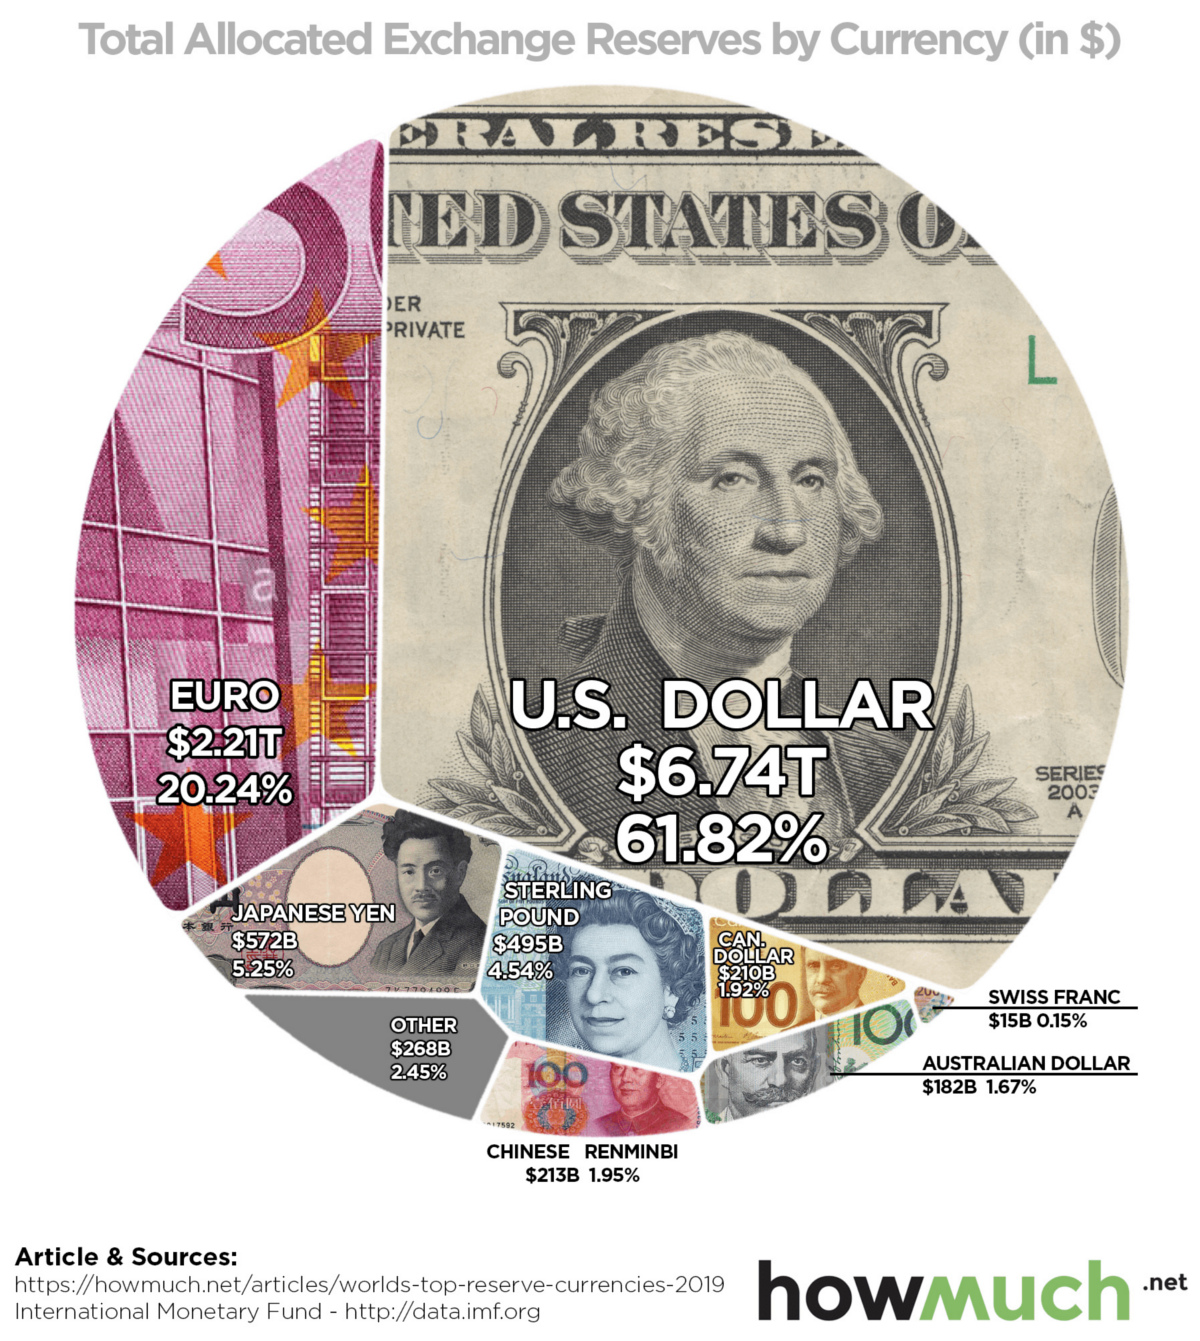
What’s a Reserve Currency?
Today’s visualization comes to us from HowMuch.net, and it breaks down foreign reserves held by countries — but what is a reserve currency, anyways?
In essence, reserve currencies (i.e. U.S. dollar, pound sterling, euro, etc.) are held on to by central banks for the following major reasons:
- To maintain a stable exchange rate for the domestic currency
- To ensure liquidity in the case of an economic or political crisis
- To provide confidence to international buyers and foreign investors
- To fulfill international obligations, such as paying down debt
- To diversify central bank portfolios, reducing overall risk
Not surprisingly, central banks benefit the most from stockpiling widely-held reserve currencies such as the U.S. dollar or the euro.
Because these currencies are accepted almost everywhere, they provide third-parties with extra confidence and perceived liquidity. This is a network effect that snowballs from the growing use of a particular reserve currency over others.
Reserve Currencies Over Time
Here is how the usage of reserve currencies has evolved over the last 15 years:
| 🇺🇸 U.S. Dollar | 🇪🇺 Euro | 🇯🇵 Japanese Yen | 🇬🇧 Pound Sterling | 🌐 Other | |
| 2004 | 65.5% | 24.7% | 4.3% | 3.5% | 2.0% |
| 2009 | 62.1% | 27.7% | 2.9% | 4.3% | 3.0% |
| 2014 | 65.1% | 21.2% | 3.5% | 3.7% | 6.5% |
| 2019 | 61.8% | 20.2% | 5.3% | 4.5% | 8.2% |
Over this timeframe, there have been small ups and downs in most reserve currencies.
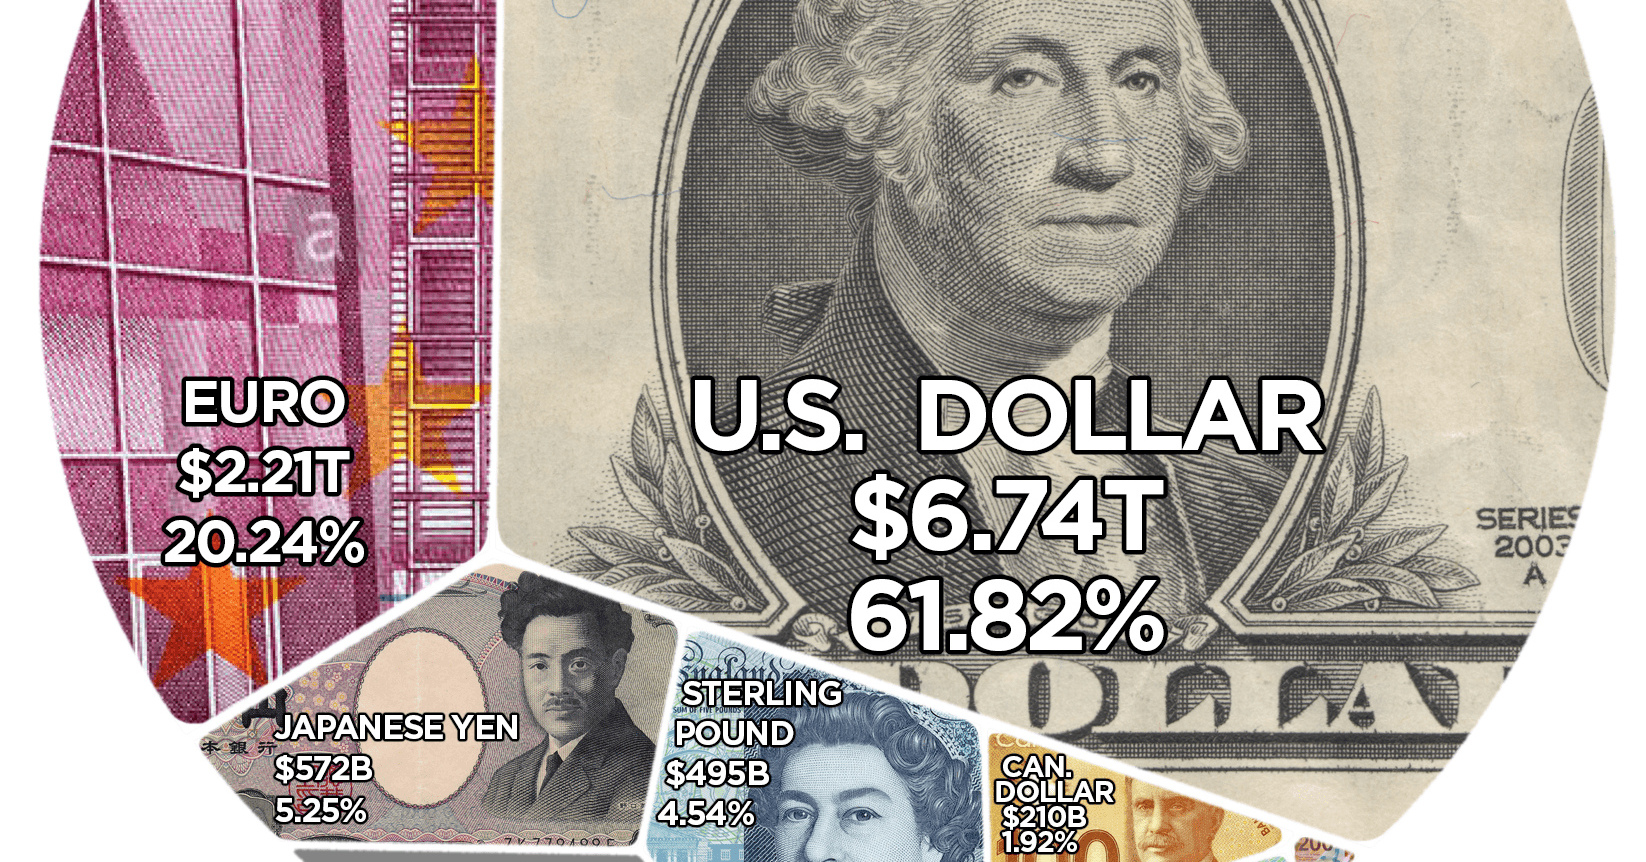
Today, the U.S. dollar is the world’s most powerful reserve currency, making up over 61% of foreign reserves. The dollar gets an extensive network effect from its use abroad, and this translates into several advantages for the multi-trillion dollar U.S. economy.
The euro, yen, and pound sterling are the other mainstay reserve currencies, adding up to roughly 30% of foreign reserves.
Finally, the most peculiar data series above is “Other”, which grew from 2.0% to 8.4% of worldwide foreign reserves over the last 15 years. This bucket includes the Canadian dollar, the Australian dollar, the Swiss franc, and the Chinese renminbi.
Accepted Everywhere?
There have been rumblings in the media for decades now about the rise of the Chinese renminbi as a potential new challenger on the reserve currency front.
While there are still big structural problems that will prevent this from happening as fast as some may expect, the currency is still on the rise internationally.
What will the composition of global foreign reserves look like in another 15 years?


Markets
U.S. Debt Interest Payments Reach $1 Trillion
U.S. debt interest payments have surged past the $1 trillion dollar mark, amid high interest rates and an ever-expanding debt burden.


U.S. Debt Interest Payments Reach $1 Trillion
This was originally posted on our Voronoi app. Download the app for free on iOS or Android and discover incredible data-driven charts from a variety of trusted sources.
The cost of paying for America’s national debt crossed the $1 trillion dollar mark in 2023, driven by high interest rates and a record $34 trillion mountain of debt.
Over the last decade, U.S. debt interest payments have more than doubled amid vast government spending during the pandemic crisis. As debt payments continue to soar, the Congressional Budget Office (CBO) reported that debt servicing costs surpassed defense spending for the first time ever this year.
This graphic shows the sharp rise in U.S. debt payments, based on data from the Federal Reserve.
A $1 Trillion Interest Bill, and Growing
Below, we show how U.S. debt interest payments have risen at a faster pace than at another time in modern history:
| Date | Interest Payments | U.S. National Debt |
|---|---|---|
| 2023 | $1.0T | $34.0T |
| 2022 | $830B | $31.4T |
| 2021 | $612B | $29.6T |
| 2020 | $518B | $27.7T |
| 2019 | $564B | $23.2T |
| 2018 | $571B | $22.0T |
| 2017 | $493B | $20.5T |
| 2016 | $460B | $20.0T |
| 2015 | $435B | $18.9T |
| 2014 | $442B | $18.1T |
| 2013 | $425B | $17.2T |
| 2012 | $417B | $16.4T |
| 2011 | $433B | $15.2T |
| 2010 | $400B | $14.0T |
| 2009 | $354B | $12.3T |
| 2008 | $380B | $10.7T |
| 2007 | $414B | $9.2T |
| 2006 | $387B | $8.7T |
| 2005 | $355B | $8.2T |
| 2004 | $318B | $7.6T |
| 2003 | $294B | $7.0T |
| 2002 | $298B | $6.4T |
| 2001 | $318B | $5.9T |
| 2000 | $353B | $5.7T |
| 1999 | $353B | $5.8T |
| 1998 | $360B | $5.6T |
| 1997 | $368B | $5.5T |
| 1996 | $362B | $5.3T |
| 1995 | $357B | $5.0T |
| 1994 | $334B | $4.8T |
| 1993 | $311B | $4.5T |
| 1992 | $306B | $4.2T |
| 1991 | $308B | $3.8T |
| 1990 | $298B | $3.4T |
| 1989 | $275B | $3.0T |
| 1988 | $254B | $2.7T |
| 1987 | $240B | $2.4T |
| 1986 | $225B | $2.2T |
| 1985 | $219B | $1.9T |
| 1984 | $205B | $1.7T |
| 1983 | $176B | $1.4T |
| 1982 | $157B | $1.2T |
| 1981 | $142B | $1.0T |
| 1980 | $113B | $930.2B |
| 1979 | $96B | $845.1B |
| 1978 | $84B | $789.2B |
| 1977 | $69B | $718.9B |
| 1976 | $61B | $653.5B |
| 1975 | $55B | $576.6B |
| 1974 | $50B | $492.7B |
| 1973 | $45B | $469.1B |
| 1972 | $39B | $448.5B |
| 1971 | $36B | $424.1B |
| 1970 | $35B | $389.2B |
| 1969 | $30B | $368.2B |
| 1968 | $25B | $358.0B |
| 1967 | $23B | $344.7B |
| 1966 | $21B | $329.3B |
Interest payments represent seasonally adjusted annual rate at the end of Q4.
At current rates, the U.S. national debt is growing by a remarkable $1 trillion about every 100 days, equal to roughly $3.6 trillion per year.
As the national debt has ballooned, debt payments even exceeded Medicaid outlays in 2023—one of the government’s largest expenditures. On average, the U.S. spent more than $2 billion per day on interest costs last year. Going further, the U.S. government is projected to spend a historic $12.4 trillion on interest payments over the next decade, averaging about $37,100 per American.
Exacerbating matters is that the U.S. is running a steep deficit, which stood at $1.1 trillion for the first six months of fiscal 2024. This has accelerated due to the 43% increase in debt servicing costs along with a $31 billion dollar increase in defense spending from a year earlier. Additionally, a $30 billion increase in funding for the Federal Deposit Insurance Corporation in light of the regional banking crisis last year was a major contributor to the deficit increase.
Overall, the CBO forecasts that roughly 75% of the federal deficit’s increase will be due to interest costs by 2034.

-

 Real Estate2 weeks ago
Visualizing America’s Shortage of Affordable Homes
-

 Technology1 week ago
Ranked: Semiconductor Companies by Industry Revenue Share
-

 Money1 week ago
Which States Have the Highest Minimum Wage in America?
-

 Real Estate1 week ago
Ranked: The Most Valuable Housing Markets in America
-

 Business1 week ago
Charted: Big Four Market Share by S&P 500 Audits
-

 AI1 week ago
The Stock Performance of U.S. Chipmakers So Far in 2024
-

 Misc2 weeks ago
Almost Every EV Stock is Down After Q1 2024
-

 Money2 weeks ago
Where Does One U.S. Tax Dollar Go?