Money
The World’s Billionaires, by Generation

The World’s Billionaires, by Generation
What similarities do the world’s billionaires share? What are their differences?
At the age of 12, Elon Musk built his first video game. Similarly, Mark Zuckerberg shared an interest in computer programming, building a simple messaging platform at the same age. The co-founder of Oracle, Larry Ellison, developed programming skills at college. All three span different generations and made their fortunes in tech.
In this infographic from BusinessFinancing.co.uk, we explore some characteristics of billionaires across generations, including their average net worth, top sectors, number of children, and most common city of residence.
The World’s Billionaires, by Generation
Using data from Forbes here is how each generation of the world’s billionaires break down.
Silent Generation
- Born: 1928-1945
- Average Net Worth: $5.5 billion
- Most Popular Residence: New York, U.S.
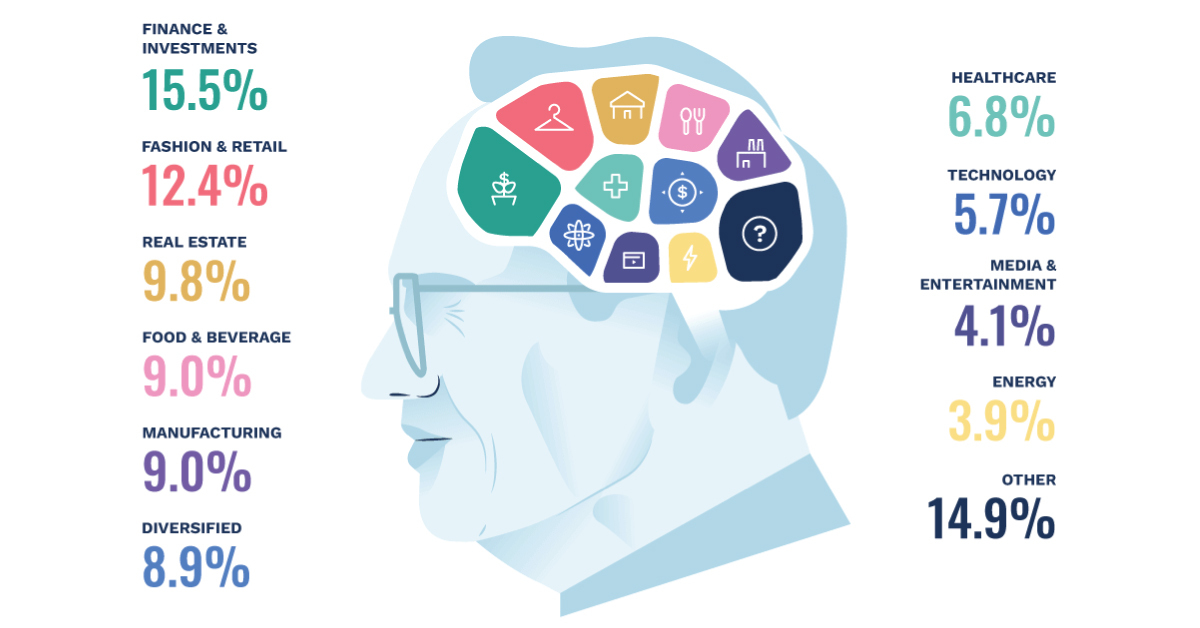
Silent Generation billionaires are the wealthiest on average across generations. With CEO of Berkshire Hathaway Warren Buffett and Zara founder Amancio Ortega among its ranks, Silent Generation billionaires are most likely to be in finance, fashion, and real estate industries.
| Top 5 | Sector | % |
|---|---|---|
| 1 | Finance & Investments | 15.5% |
| 2 | Fashion & Retail | 12.4% |
| 3 | Real Estate | 9.8% |
| 4 | Food & Beverage | 9.0% |
| 5 | Manufacturing | 9.0% |
Media mogul Rupert Murdoch, who owns The Wall Street Journal, Fox News, and The New York Post, is also part of this group. He has a net worth of $13 billion.
Baby Boomer
- Born: 1946-1964
- Average Net Worth: $4.6 billion
- Most Popular Residence: New York, U.S.
Like the Silent Generation, billionaire Boomers are most likely to be in finance. Stephen Schwarzman, founder of private equity firm Blackstone Group, R. Budi Hartono, the richest person in Indonesia, and Ray Dalio, head of Bridgewater Associates, all fall into this generation.
Boomer billionaires are much less likely to be in the tech industry, though Jeff Bezos and Bill Gates have amassed their fortunes in this area.
| Top 5 | Sector | % |
|---|---|---|
| 1 | Finance & Investments | 14.2% |
| 2 | Manufacturing | 12.9% |
| 3 | Fashion & Retail | 10.6% |
| 4 | Technology | 8.7% |
| 5 | Healthcare | 8.5% |
With a net worth of $150 billion, LVMH chair Bernard Arnault is the second richest person in the world. Francoise Bettencourt-Meyers, vice-chairwoman of L’Oreal, ranks 12th. Both fashion conglomerates are based in France and helmed by billionaire Boomers.
Generation X
- Born: 1965-1980
- Average Net Worth: $4.4 billion
- Most popular Residence: Beijing, China
The world’s billionaires in Gen X are not only predominantly in tech, but are most likely to live in Beijing, China. Ma Huateng, founder of social media conglomerate Tencent Holdings, created instant messaging platform QQ in his early 20s. Colin Huang built one of China’s largest e-commerce platforms, Pinduoduo, in 2015.
| Top 5 | Sector | % |
|---|---|---|
| 1 | Technology | 24.2% |
| 2 | Manufacturing | 13.4% |
| 3 | Finance & Investments | 11.6% |
| 4 | Healthcare | 8.0% |
| 5 | Fashion & Retail | 7.6% |
Gen X billionaires also include Elon Musk and Google co-founder Larry Page.
Millennials
- Born: 1981-1996
- Average Net Worth: $5.1 billion
- Most Popular Residence: San Francisco, U.S.
With the second-highest average net worth after the Silent Generation, millennial billionaires are seen predominantly in tech and finance. Roughly 100 billionaires worldwide fall into this category overall.
Mark Zuckerberg is the only millennial billionaire among the top 10 richest globally.
| Top 5 | Sector | % |
|---|---|---|
| 1 | Technology | 31.0% |
| 2 | Finance & Investments | 12.9% |
| 3 | Fashion & Retail | 8.6% |
| 4 | Media & Entertainment | 8.6% |
| 5 | Automotive | 6.9% |
Brian Chesky (co-founder of Airbnb), Bobby Murphy and Evan Spiegel (co-founders of Snapchat), and Swiss billionaire Guillaume Pousaz are all part of this billionaire cohort.
Generational Trends
What other trends are seen across the world’s billionaires?
| Silent Generation Billionaires | Baby Boomer Billionaires | Generation X Billionaires | Millennial Billionaires | |
|---|---|---|---|---|
| Women | 9.6% | 9.8% | 11.9% | 19.1% |
| Self-Made | 65.7% | 71.0% | 80.7% | 66.4% |
| U.S. Citizens | 38.2% | 27.3% | 17.7% | 30.2% |
| EU Citizens | 17.5% | 11.7% | 13.0% | 18.1% |
| Living Outside the U.S. | 61.9% | 73.2% | 81.8% | 65.5% |
| Married | 78.9% | 86.5% | 83.6% | 68.4% |
Millennial billionaires are the most likely to be women, with roughly double the rate of all other generations at 19%. Notable billionaire women include Anna Kasprzak, who co-owns Danish shoe company ECCO and Brazil’s Anne-Marie Werninghaus.
Self-made billionaires are most likely to be Gen X. Over 80% of billionaires are in this category, including Google co-founder Sergey Brin and Mu Rongjun, co-founder of Meituan, a company similar to Yelp. At the same time, the most billionaires living outside of the U.S. (81%) were born in this generation.
Billionaire Boomers are most likely to be married. The Silent Generation, meanwhile, are most likely to be U.S. citizens, with hedge fund manager George Soros and the world’s oldest billionaire, George Joseph (100) who founded insurance firm Mercury General, in this set.
Notable exceptions include Robert Kuok (98), the richest person in Malaysia, and Masatoshi Ito (97), chair of Japan’s largest retailer.
Money
How Debt-to-GDP Ratios Have Changed Since 2000
See how much the debt-to-GDP ratios of advanced economies have grown (or shrank) since the year 2000.
How Debt-to-GDP Ratios Have Changed Since 2000
This was originally posted on our Voronoi app. Download the app for free on Apple or Android and discover incredible data-driven charts from a variety of trusted sources.
Government debt levels have grown in most parts of the world since the 2008 financial crisis, and even more so after the COVID-19 pandemic.
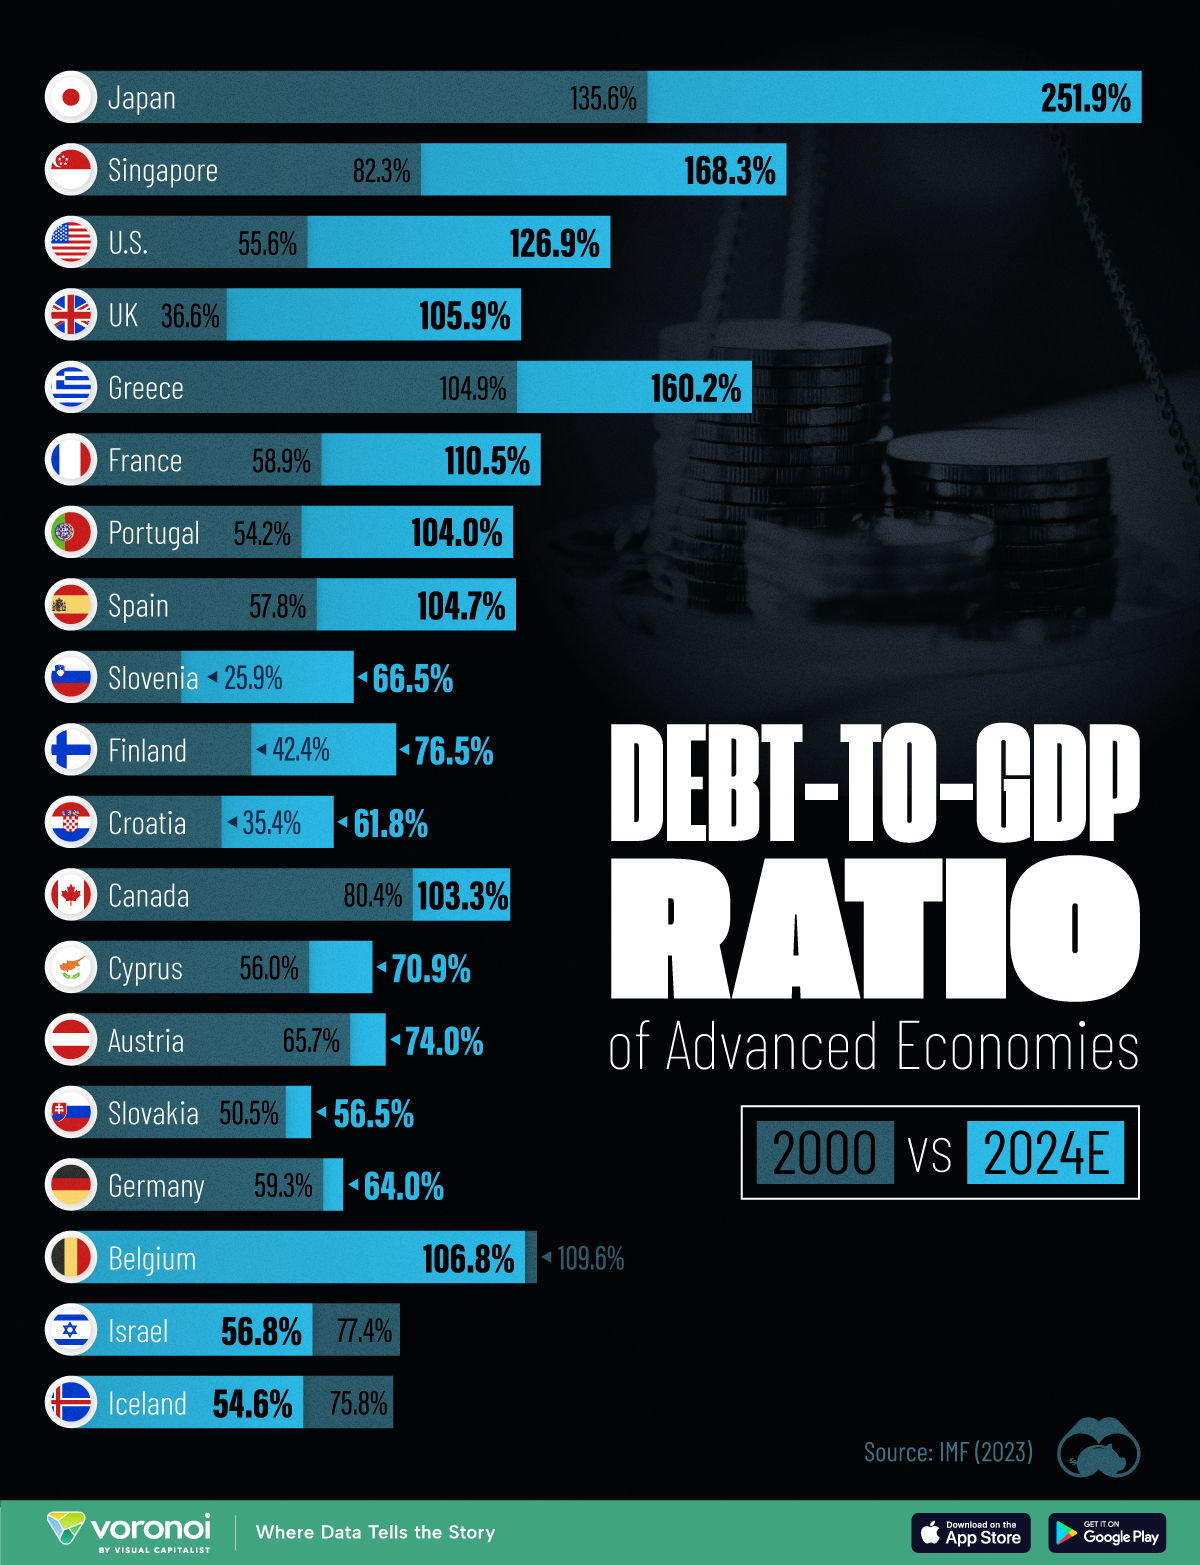
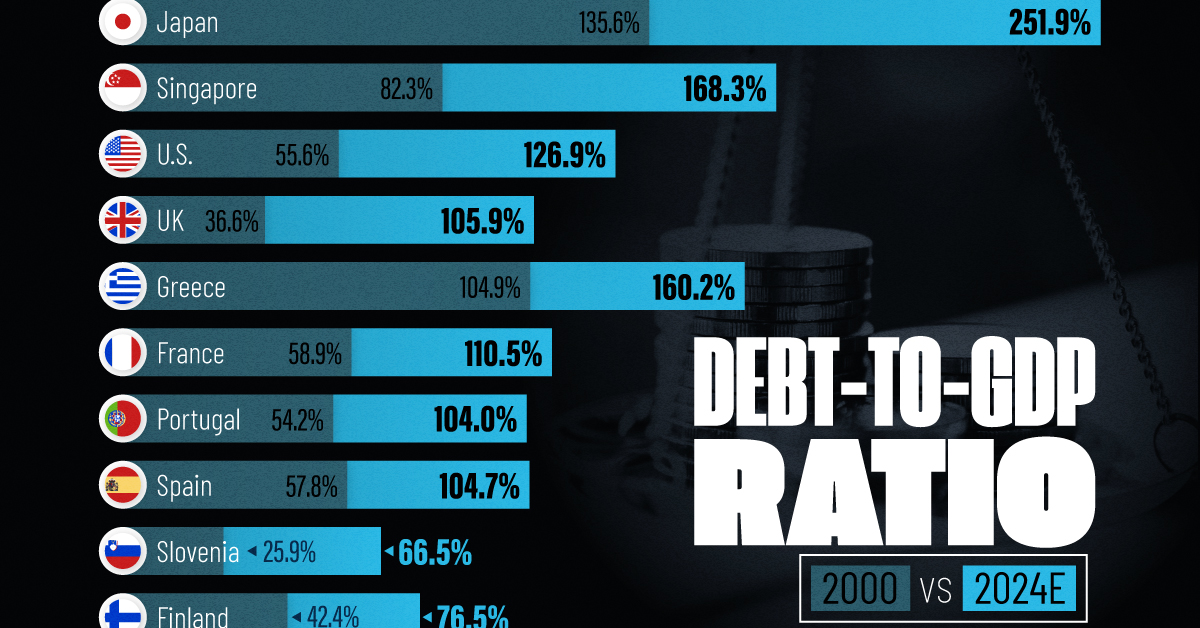
To gain perspective on this long-term trend, we’ve visualized the debt-to-GDP ratios of advanced economies, as of 2000 and 2024 (estimated). All figures were sourced from the IMF’s World Economic Outlook.
Data and Highlights
The data we used to create this graphic is listed in the table below. “Government gross debt” consists of all liabilities that require payment(s) of interest and/or principal in the future.
| Country | 2000 (%) | 2024 (%) | Change (pp) |
|---|---|---|---|
| 🇯🇵 Japan | 135.6 | 251.9 | +116.3 |
| 🇸🇬 Singapore | 82.3 | 168.3 | +86.0 |
| 🇺🇸 United States | 55.6 | 126.9 | +71.3 |
| 🇬🇧 United Kingdom | 36.6 | 105.9 | +69.3 |
| 🇬🇷 Greece | 104.9 | 160.2 | +55.3 |
| 🇫🇷 France | 58.9 | 110.5 | +51.6 |
| 🇵🇹 Portugal | 54.2 | 104.0 | +49.8 |
| 🇪🇸 Spain | 57.8 | 104.7 | +46.9 |
| 🇸🇮 Slovenia | 25.9 | 66.5 | +40.6 |
| 🇫🇮 Finland | 42.4 | 76.5 | +34.1 |
| 🇭🇷 Croatia | 35.4 | 61.8 | +26.4 |
| 🇨🇦 Canada | 80.4 | 103.3 | +22.9 |
| 🇨🇾 Cyprus | 56.0 | 70.9 | +14.9 |
| 🇦🇹 Austria | 65.7 | 74.0 | +8.3 |
| 🇸🇰 Slovak Republic | 50.5 | 56.5 | +6.0 |
| 🇩🇪 Germany | 59.3 | 64.0 | +4.7 |
| 🇧🇪 Belgium | 109.6 | 106.8 | -2.8 |
| 🇮🇱 Israel | 77.4 | 56.8 | -20.6 |
| 🇮🇸 Iceland | 75.8 | 54.6 | -21.2 |
The debt-to-GDP ratio indicates how much a country owes compared to the size of its economy, reflecting its ability to manage and repay debts. Percentage point (pp) changes shown above indicate the increase or decrease of these ratios.
Countries with the Biggest Increases
Japan (+116 pp), Singapore (+86 pp), and the U.S. (+71 pp) have grown their debt as a percentage of GDP the most since the year 2000.
All three of these countries have stable, well-developed economies, so it’s unlikely that any of them will default on their growing debts. With that said, higher government debt leads to increased interest payments, which in turn can diminish available funds for future government budgets.
This is a rising issue in the U.S., where annual interest payments on the national debt have surpassed $1 trillion for the first time ever.
Only 3 Countries Saw Declines
Among this list of advanced economies, Belgium (-2.8 pp), Iceland (-21.2 pp), and Israel (-20.6 pp) were the only countries that decreased their debt-to-GDP ratio since the year 2000.
According to Fitch Ratings, Iceland’s debt ratio has decreased due to strong GDP growth and the use of its cash deposits to pay down upcoming maturities.
See More Debt Graphics from Visual Capitalist
Curious to see which countries have the most government debt in dollars? Check out this graphic that breaks down $97 trillion in debt as of 2023.
-

 Real Estate2 weeks ago
Visualizing America’s Shortage of Affordable Homes
-

 Technology1 week ago
Ranked: Semiconductor Companies by Industry Revenue Share
-

 Money1 week ago
Which States Have the Highest Minimum Wage in America?
-

 Real Estate1 week ago
Ranked: The Most Valuable Housing Markets in America
-

 Business2 weeks ago
Charted: Big Four Market Share by S&P 500 Audits
-

 AI2 weeks ago
The Stock Performance of U.S. Chipmakers So Far in 2024
-

 Misc2 weeks ago
Almost Every EV Stock is Down After Q1 2024
-

 Money2 weeks ago
Where Does One U.S. Tax Dollar Go?

