Markets
The World of Wine: Visualizing an Industry Ripe for Disruption
View the full-size version of this infographic.
Visualizing an Industry Ripe for Disruption
View the full-size version of this infographic by clicking here.
Winemaking is often thought of as a symbol of transformation.
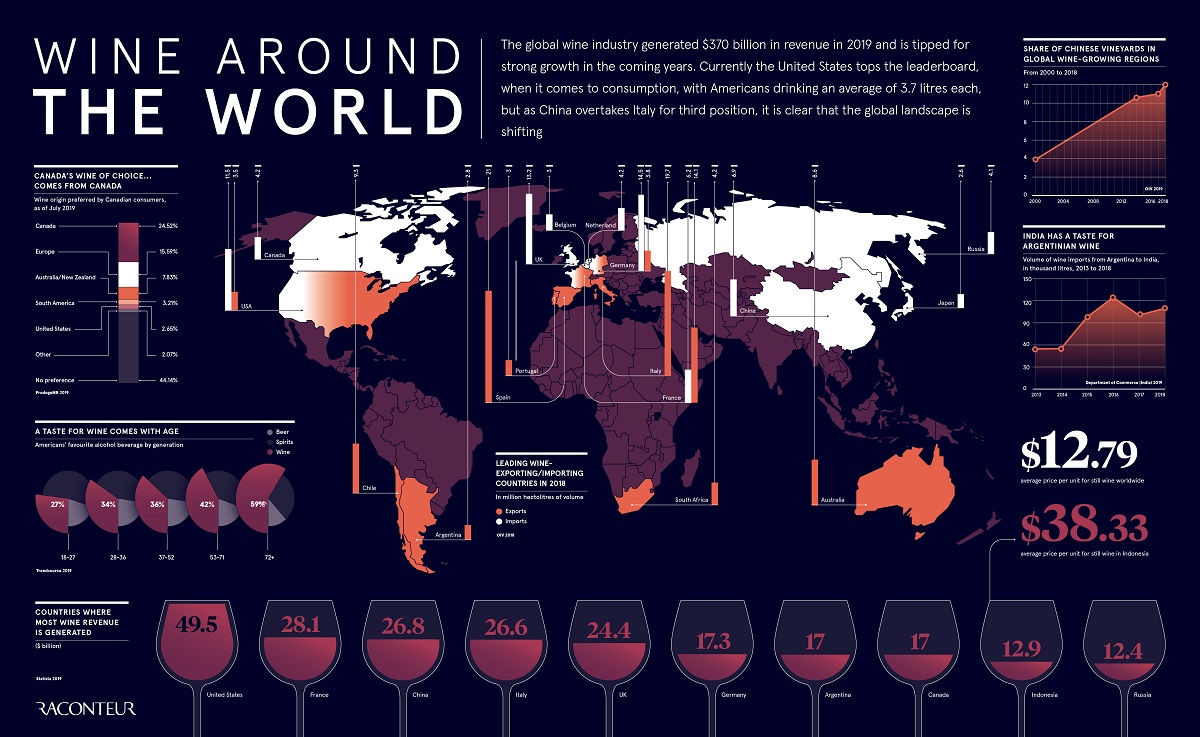
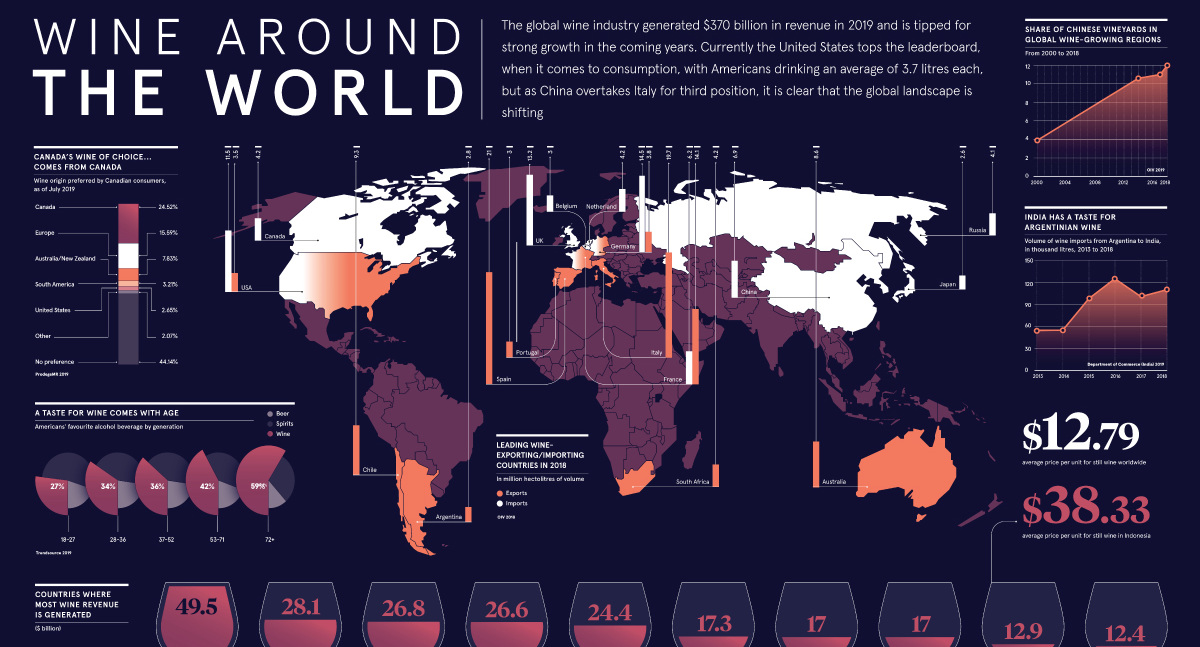
While the fermented drink dates back 9,000 years, the wine market is now experiencing its own transformation due to technological innovation, and the introduction of new business models. Generating $370 billion in revenue in 2019, the global industry is expected to grow considerably over the next decade—but not as we know it.
Today’s infographic from Raconteur explores wine consumption by region, and looks at how changing tastes are driving a new era of the millennia-old staple.
Will the industry continue to get better with age, or will it join the countless other industries that have fallen victim to disruption?
The Wine Leaders of the World
To start, let’s take a look at the countries around the world that have the biggest economic footprints linked to the trade and consumption of wine:
Exports: Spain is the largest exporter of wine globally, producing 21 million hectoliters of volume in 2018, followed by Italy with 19.7 million hectoliters.
Imports: Germany leads on imports with 14.5 million hectoliters of volume in 2018, while the UK is the second-largest importer with 13.2 million hectoliters.
Consumption: The U.S. currently leads on wine consumption, with Americans drinking an average of 3.7 liters per person—generating almost $50 billion in revenue.
| Rank | Country | Revenue | |||||
|---|---|---|---|---|---|---|---|
| #1 | 🇺🇸 United States | $49.5B | |||||
| #2 | 🇫🇷 France | $28B | |||||
| #3 | 🇨🇳 China | $27B | |||||
| #4 | 🇮🇹 Italy | $27B | |||||
| #5 | 🇬🇧 UK | $24B | |||||
| #6 | 🇩🇪 Germany | $17B | |||||
| #7 | 🇦🇷 Argentina | $17B | |||||
| #8 | 🇨🇦 Canada | $17B | |||||
| #9 | 🇮🇩 Indonesia | $13B | |||||
| #10 | 🇷🇺 Russia | $12B |
Currently, 80% of all wine consumed within China is produced domestically, and with a growing middle class, there is a huge potential for the Chinese industry to gain ground in comparison to other leading wine markets.
Rapidly Changing Tastes
While older generations prefer wine to other alcoholic beverages, spirits are the drink of choice for those aged 18 to 27. In fact, only 27% of this age group prefers wine to spirits or beer, meaning wine companies will need to adapt to these younger audiences and their differing values.
Marketing could create an opportunity to connect with this audience in a more meaningful way, with packaging having the most potential to sway their decision making process by providing a number of unique benefits:
- Sustainability
- Smaller serving sizes
- Portability
Interestingly, canned wine is already a $70 million industry in the United States — and by 2025, it could make up 10% of total sales.
New Threats to the Industry
Along with changing expectations for packaging, millennials also crave new experiences, with more alternative options appealing to this age group, such as cannabis-infused beverages, craft beer, and whiskey.
Dealcoholized cannabis-infused wine is a new product innovation that could also appeal to this audience and have direct implications for the industry—but while cannabis companies have shown an interest in the category, collaboration with the tech industry is proving to be the most transformative.
When Two Valleys Collide
Technology is squeezing every opportunity it can get out of the wine industry, impacting different parts of the supply chain.
Winemaking
Drones are making farms and vineyards across the globe more efficient, while new technologies used to improve harvesting, sorting, and filtration during the winemaking process are also cropping up and providing new solutions to antiquated problems.
Consumption
Traditionally, decanting wine has been a slow and delicate process. Smart wine decanters however, can expedite that process.
These decanters use air filtration systems to remove impurities and enhance the aroma in just a few minutes—streamlining the decanting process, which typically takes around three hours.
Impact on the Environment
Industry experts predict that packaging such as edible bottles made from sugar substitutes, and compostable, non-plastic glass will replace glass bottles.
Meanwhile, QR codes have the potential to replace paper labels on wine bottles entirely, and a growing number of wine brands are already using augmented reality to deliver more immersive experiences to end consumers.
For an industry steeped in history and tradition, the future holds exciting potential for new innovations that will transform the way we look at wine forever.


Markets
U.S. Debt Interest Payments Reach $1 Trillion
U.S. debt interest payments have surged past the $1 trillion dollar mark, amid high interest rates and an ever-expanding debt burden.


U.S. Debt Interest Payments Reach $1 Trillion
This was originally posted on our Voronoi app. Download the app for free on iOS or Android and discover incredible data-driven charts from a variety of trusted sources.
The cost of paying for America’s national debt crossed the $1 trillion dollar mark in 2023, driven by high interest rates and a record $34 trillion mountain of debt.
Over the last decade, U.S. debt interest payments have more than doubled amid vast government spending during the pandemic crisis. As debt payments continue to soar, the Congressional Budget Office (CBO) reported that debt servicing costs surpassed defense spending for the first time ever this year.
This graphic shows the sharp rise in U.S. debt payments, based on data from the Federal Reserve.
A $1 Trillion Interest Bill, and Growing
Below, we show how U.S. debt interest payments have risen at a faster pace than at another time in modern history:
| Date | Interest Payments | U.S. National Debt |
|---|---|---|
| 2023 | $1.0T | $34.0T |
| 2022 | $830B | $31.4T |
| 2021 | $612B | $29.6T |
| 2020 | $518B | $27.7T |
| 2019 | $564B | $23.2T |
| 2018 | $571B | $22.0T |
| 2017 | $493B | $20.5T |
| 2016 | $460B | $20.0T |
| 2015 | $435B | $18.9T |
| 2014 | $442B | $18.1T |
| 2013 | $425B | $17.2T |
| 2012 | $417B | $16.4T |
| 2011 | $433B | $15.2T |
| 2010 | $400B | $14.0T |
| 2009 | $354B | $12.3T |
| 2008 | $380B | $10.7T |
| 2007 | $414B | $9.2T |
| 2006 | $387B | $8.7T |
| 2005 | $355B | $8.2T |
| 2004 | $318B | $7.6T |
| 2003 | $294B | $7.0T |
| 2002 | $298B | $6.4T |
| 2001 | $318B | $5.9T |
| 2000 | $353B | $5.7T |
| 1999 | $353B | $5.8T |
| 1998 | $360B | $5.6T |
| 1997 | $368B | $5.5T |
| 1996 | $362B | $5.3T |
| 1995 | $357B | $5.0T |
| 1994 | $334B | $4.8T |
| 1993 | $311B | $4.5T |
| 1992 | $306B | $4.2T |
| 1991 | $308B | $3.8T |
| 1990 | $298B | $3.4T |
| 1989 | $275B | $3.0T |
| 1988 | $254B | $2.7T |
| 1987 | $240B | $2.4T |
| 1986 | $225B | $2.2T |
| 1985 | $219B | $1.9T |
| 1984 | $205B | $1.7T |
| 1983 | $176B | $1.4T |
| 1982 | $157B | $1.2T |
| 1981 | $142B | $1.0T |
| 1980 | $113B | $930.2B |
| 1979 | $96B | $845.1B |
| 1978 | $84B | $789.2B |
| 1977 | $69B | $718.9B |
| 1976 | $61B | $653.5B |
| 1975 | $55B | $576.6B |
| 1974 | $50B | $492.7B |
| 1973 | $45B | $469.1B |
| 1972 | $39B | $448.5B |
| 1971 | $36B | $424.1B |
| 1970 | $35B | $389.2B |
| 1969 | $30B | $368.2B |
| 1968 | $25B | $358.0B |
| 1967 | $23B | $344.7B |
| 1966 | $21B | $329.3B |
Interest payments represent seasonally adjusted annual rate at the end of Q4.
At current rates, the U.S. national debt is growing by a remarkable $1 trillion about every 100 days, equal to roughly $3.6 trillion per year.
As the national debt has ballooned, debt payments even exceeded Medicaid outlays in 2023—one of the government’s largest expenditures. On average, the U.S. spent more than $2 billion per day on interest costs last year. Going further, the U.S. government is projected to spend a historic $12.4 trillion on interest payments over the next decade, averaging about $37,100 per American.
Exacerbating matters is that the U.S. is running a steep deficit, which stood at $1.1 trillion for the first six months of fiscal 2024. This has accelerated due to the 43% increase in debt servicing costs along with a $31 billion dollar increase in defense spending from a year earlier. Additionally, a $30 billion increase in funding for the Federal Deposit Insurance Corporation in light of the regional banking crisis last year was a major contributor to the deficit increase.
Overall, the CBO forecasts that roughly 75% of the federal deficit’s increase will be due to interest costs by 2034.

-

 Real Estate2 weeks ago
Visualizing America’s Shortage of Affordable Homes
-

 Technology1 week ago
Ranked: Semiconductor Companies by Industry Revenue Share
-

 Money2 weeks ago
Which States Have the Highest Minimum Wage in America?
-

 Real Estate2 weeks ago
Ranked: The Most Valuable Housing Markets in America
-

 Business2 weeks ago
Charted: Big Four Market Share by S&P 500 Audits
-

 AI2 weeks ago
The Stock Performance of U.S. Chipmakers So Far in 2024
-

 Misc2 weeks ago
Almost Every EV Stock is Down After Q1 2024
-

 Money2 weeks ago
Where Does One U.S. Tax Dollar Go?