Misc
The Spiraling Opioid Epidemic in America


The Spiraling Opioid Epidemic in America
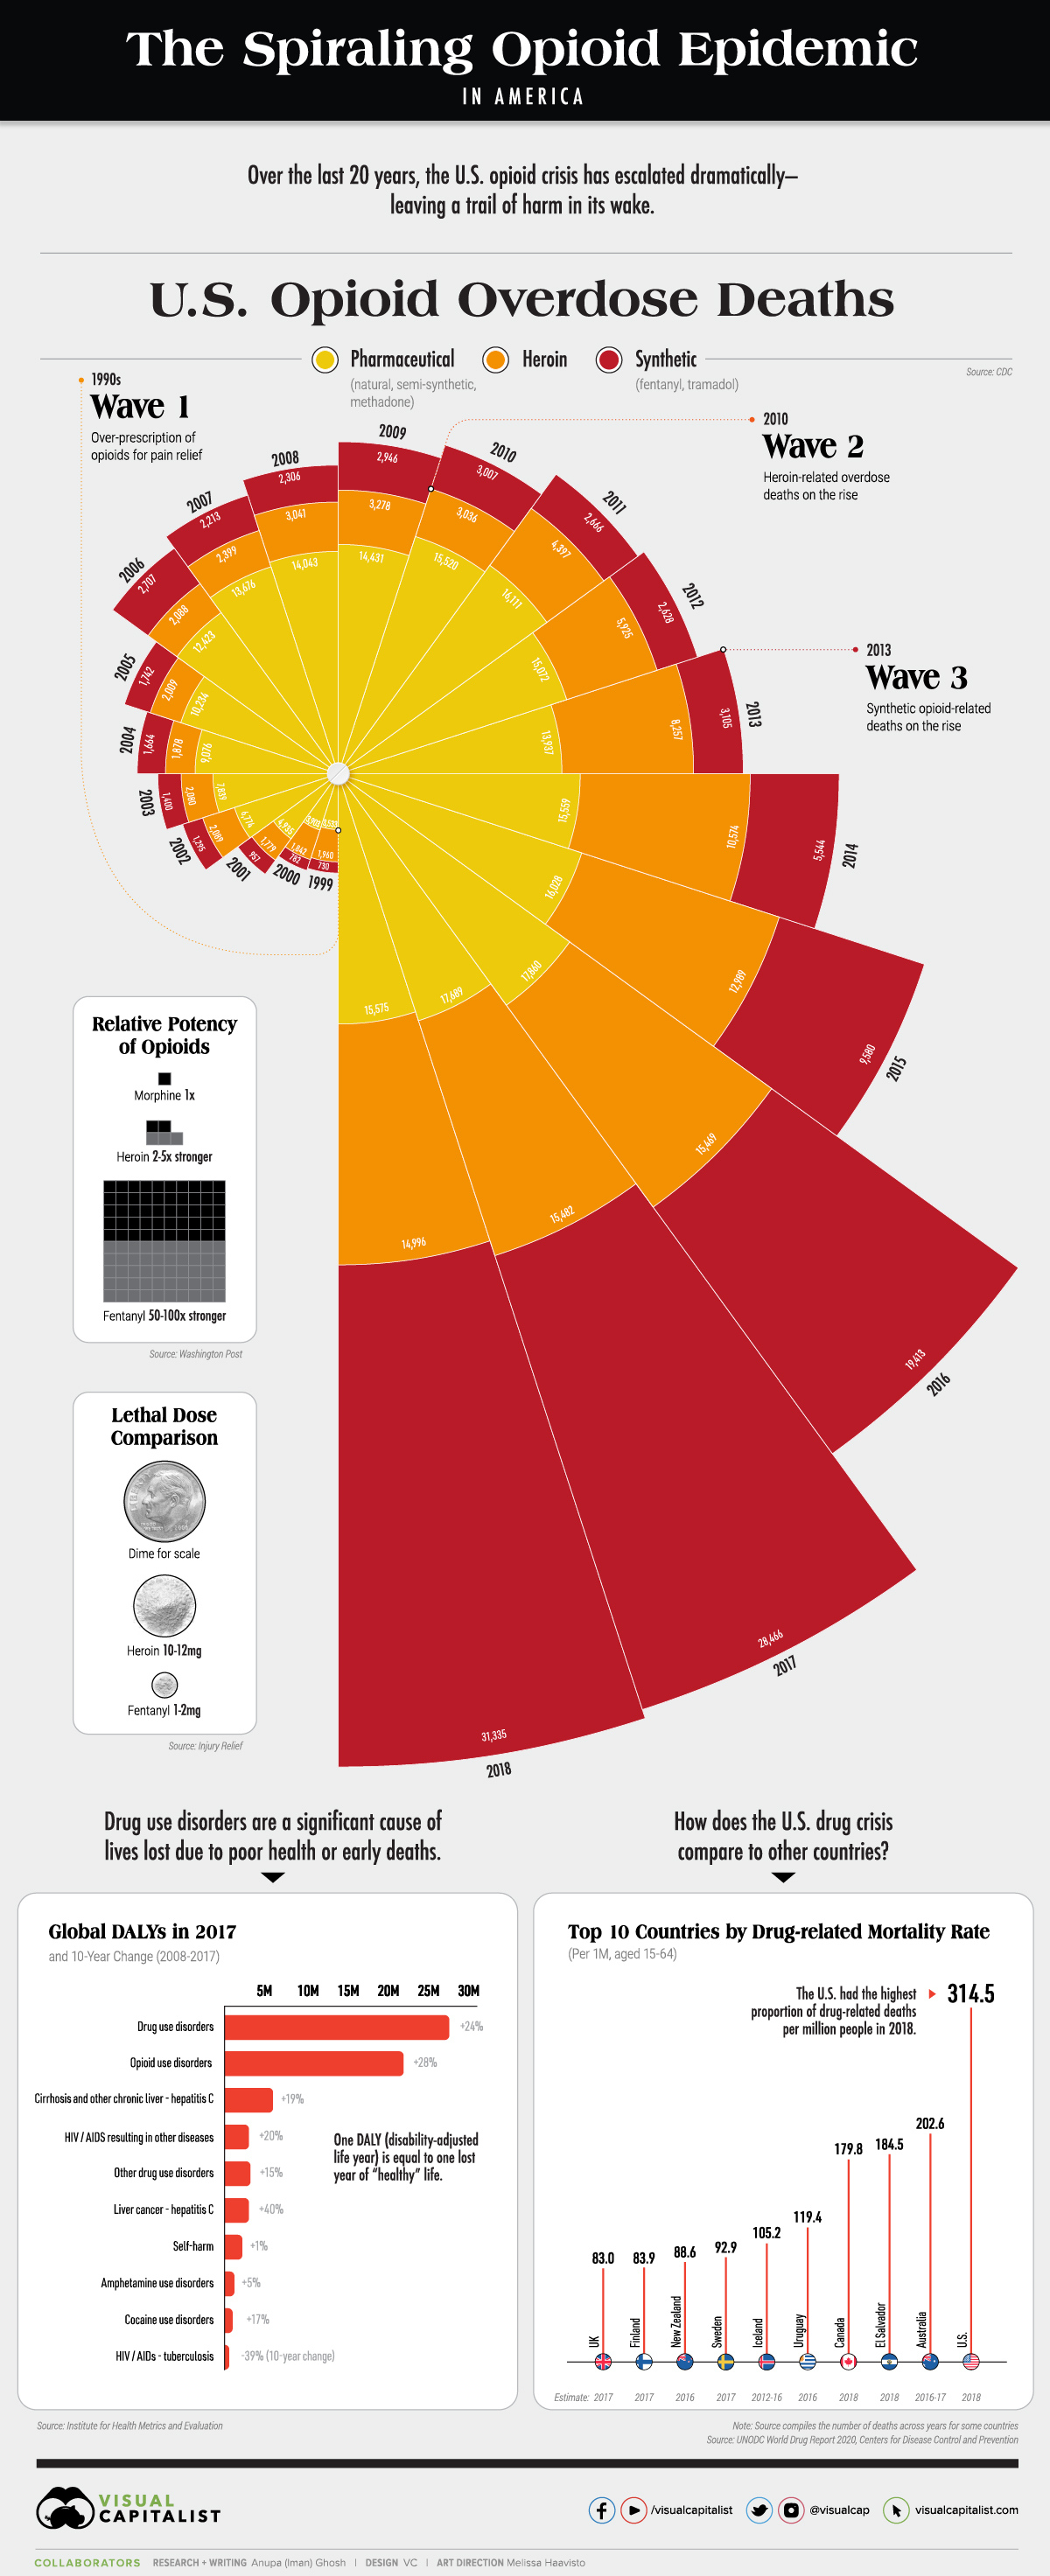
Over the last 20 years, the ongoing U.S. opioid crisis has claimed tens of thousands of lives. In fact, opioid overdose deaths accounted for nearly 70% of all drug overdose deaths in 2018.
Although the damage of the opioid epidemic is well documented, what people might not know is that it has escalated in three distinct waves.
We pull the latest statistics from the UN World Drug Report 2020 to uncover the scope of the opioid crisis in the U.S., and how national drug-related death rates compare to other countries.
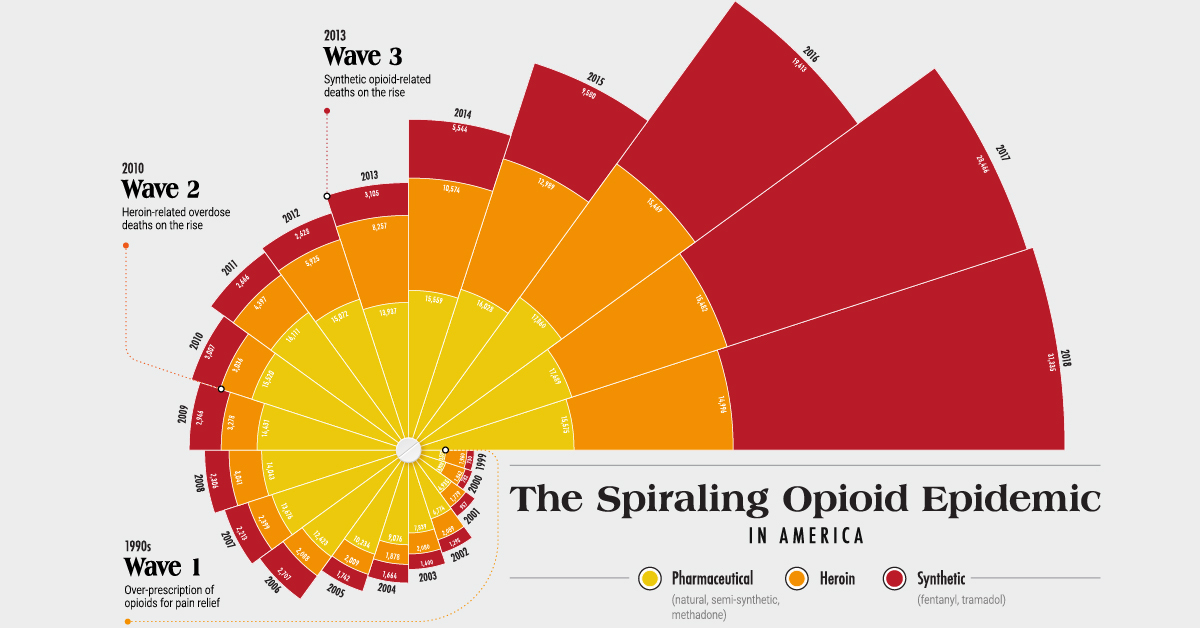
Three Waves of the Opioid Crisis
According to the CDC, the opioid epidemic can be traced back to the 1990s, when opioids started being over-prescribed for pain relief purposes.
- 1990s – Wave 1
Over-prescription of opioids for pain relief, including natural opioids, semi-synthetic opioids, and methadone. Addiction risks were widely downplayed. - 2010 – Wave 2
Heroin-related overdose deaths on the rise. - 2013 – Wave 3
Synthetic opioid-related deaths on the rise, particularly fentanyl and tramadol.
Here’s how that breaks down in terms of opioid-related overdose deaths over the years. Note that by the year 2018, 67% of overdose deaths involved synthetic opioids such as fentanyl.
| Year | Any opioids | Heroin | Pharmaceutical opioids | Synthetic opioids |
|---|---|---|---|---|
| 1999 | 8,050 | 1,960 | 3,533 | 730 |
| 2000 | 8,407 | 1,842 | 3,903 | 782 |
| 2001 | 9,496 | 1,779 | 4,935 | 957 |
| 2002 | 11,920 | 2,089 | 6,774 | 1,295 |
| 2003 | 12,940 | 2,080 | 7,839 | 1,400 |
| 2004 | 13,756 | 1,878 | 9,076 | 1,664 |
| 2005 | 14,918 | 2,009 | 10,234 | 1,742 |
| 2006 | 17,545 | 2,088 | 12,423 | 2,707 |
| 2007 | 18,516 | 2,399 | 13,676 | 2,213 |
| 2008 | 19,582 | 3,041 | 14,043 | 2,306 |
| 2009 | 20,422 | 3,278 | 14,431 | 2,946 |
| 2010 | 21,089 | 3,036 | 15,520 | 3,007 |
| 2011 | 22,784 | 4,397 | 16,111 | 2,666 |
| 2012 | 23,166 | 5,925 | 15,072 | 2,628 |
| 2013 | 25,052 | 8,257 | 13,937 | 3,105 |
| 2014 | 28,647 | 10,574 | 15,559 | 5,544 |
| 2015 | 33,091 | 12,989 | 16,028 | 9,580 |
| 2016 | 42,249 | 15,469 | 17,860 | 19,413 |
| 2017 | 47,600 | 15,482 | 17,689 | 28,466 |
| 2018 | 46,802 | 14,996 | 15,575 | 31,335 |
Overdose deaths from synthetic opioids such as fentanyl and tramadol shot up by over 4,000% between 1999-2018. This can be attributed to two things: their relative potency, and the minute quantities of each that qualify as a lethal dose.
As per the medical and legal standard, opioids are often compared to morphine. To that end, heroin is 2-5x stronger—while fentanyl is 50-100x more potent. Put another way, roughly a dime-size or 10-12mg of heroin is considered a lethal dose, compared to only 1-2mg of fentanyl.
What’s worse, fentanyl is typically mixed with other types of drugs such as heroin or cocaine to increase their effects, which is how it ends up unintentionally ingested. Between 2008-2017, drug-use disorders as a whole claimed the most healthy lives due to poor health or early deaths—measured in disability-adjusted life years (DALYs)—followed in close second by opioid use disorders.
The Death Toll of U.S. Drug Overdoses
It’s undeniable that the opioid epidemic in America has caused significant harm to communities. But how does the U.S. drug crisis compare to the same issue in other countries?
The UN Drug Report further puts these numbers into perspective by comparing drug-related deaths per million population. Note that the source also compiled the total deaths across years for selected countries.
| Country (Latest Year) | Latest Years of Estimate | Total Deaths | Rate per 1M (Aged 15-64) |
|---|---|---|---|
| 🇺🇸 U.S. | 2018 | 67,367 | 314.5 |
| 🇦🇺 Australia | 2016-2017 | 3,240 | 202.6 |
| 🇸🇻 El Salvador | 2018 | 765 | 184.5 |
| 🇨🇦 Canada | 2018 | 4,460 | 179.8 |
| 🇺🇾 Uruguay | 2016 | 264 | 119.4 |
| 🇮🇸 Iceland | 2012-2016 | 23 | 105.2 |
| 🇸🇪 Sweden | 2017 | 575 | 92.9 |
| 🇳🇿 New Zealand | 2016 | 269 | 88.6 |
| 🇫🇮 Finland | 2017 | 289 | 83.9 |
| 🇬🇧 UK | 2017 | 3,547 | 83 |
With 314.5 deaths per million, the U.S. by far had the highest proportion of drug-related deaths per million people in 2018. It also had the highest overall number at 67.4K deaths.
Elephant in the Room?
Another drug rearing its head on the streets is carfentanil. Formerly developed as ‘elephant tranquilizer’, this synthetic opioid is similar in appearance to other illicit drugs such as heroin, making it indistinguishable when mixed in. However, there’s one big problem—carfentanil is 100x more potent than fentanyl itself.
In response to the continued crisis, an additional $35.7 billion was requested for counter-drug funding efforts in the FY2021 Budget. This amount is expected to go towards prevention and treatment efforts ($18.6 billion) and law enforcement efforts ($17.1 billion) both domestically and internationally.
But will these efforts properly combat the crisis, or are we already in the midst of a fourth wave of the opioid epidemic?


Maps
The Largest Earthquakes in the New York Area (1970-2024)
The earthquake that shook buildings across New York in April 2024 was the third-largest quake in the Northeast U.S. over the past 50 years.


The Largest Earthquakes in the New York Area
This was originally posted on our Voronoi app. Download the app for free on Apple or Android and discover incredible data-driven charts from a variety of trusted sources.
The 4.8 magnitude earthquake that shook buildings across New York on Friday, April 5th, 2024 was the third-largest quake in the U.S. Northeast area over the past 50 years.
In this map, we illustrate earthquakes with a magnitude of 4.0 or greater recorded in the Northeastern U.S. since 1970, according to the United States Geological Survey (USGS).
Shallow Quakes and Older Buildings
The earthquake that struck the U.S. Northeast in April 2024 was felt by millions of people from Washington, D.C., to north of Boston. It even caused a full ground stop at Newark Airport.
The quake, occurring just 5 km beneath the Earth’s surface, was considered shallow, which is what contributed to more intense shaking at the surface.
According to the USGS, rocks in the eastern U.S. are significantly older, denser, and harder than those on the western side, compressed by time. This makes them more efficient conduits for seismic energy. Additionally, buildings in the Northeast tend to be older and may not adhere to the latest earthquake codes.
Despite disrupting work and school life, the earthquake was considered minor, according to the Michigan Technological University magnitude scale:
| Magnitude | Earthquake Effects | Estimated Number Each Year |
|---|---|---|
| 2.5 or less | Usually not felt, but can be recorded by seismograph. | Millions |
| 2.5 to 5.4 | Often felt, but only causes minor damage. | 500,000 |
| 5.5 to 6.0 | Slight damage to buildings and other structures. | 350 |
| 6.1 to 6.9 | May cause a lot of damage in very populated areas. | 100 |
| 7.0 to 7.9 | Major earthquake. Serious damage. | 10-15 |
| 8.0 or greater | Great earthquake. Can totally destroy communities near the epicenter. | One every year or two |
The largest earthquake felt in the area over the past 50 years was a 5.3 magnitude quake that occurred in Au Sable Forks, New York, in 2002. It damaged houses and cracked roads in a remote corner of the Adirondack Mountains, but caused no injuries.
| Date | Magnitude | Location | State |
|---|---|---|---|
| April 20, 2002 | 5.3 | Au Sable Forks | New York |
| October 7, 1983 | 5.1 | Newcomb | New York |
| April 5, 2024 | 4.8 | Whitehouse Station | New Jersey |
| October 16, 2012 | 4.7 | Hollis Center | Maine |
| January 16, 1994 | 4.6 | Sinking Spring | Pennsylvania |
| January 19, 1982 | 4.5 | Sanbornton | New Hampshire |
| September 25, 1998 | 4.5 | Adamsville | Pennsylvania |
| June 9, 1975 | 4.2 | Altona | New York |
| May 29, 1983 | 4.2 | Peru | Maine |
| April 23, 1984 | 4.2 | Conestoga | Pennsylvania |
| January 16, 1994 | 4.2 | Sinking Spring | Pennsylvania |
| November 3, 1975 | 4 | Long Lake | New York |
| June 17, 1991 | 4 | Worcester | New York |
The largest earthquake in U.S. history, however, was the 1964 Good Friday quake in Alaska, measuring 9.2 magnitude and killing 131 people.

-

 Business2 weeks ago
America’s Top Companies by Revenue (1994 vs. 2023)
-

 Environment1 week ago
Ranked: Top Countries by Total Forest Loss Since 2001
-

 Markets1 week ago
Visualizing America’s Shortage of Affordable Homes
-

 Maps2 weeks ago
Mapped: Average Wages Across Europe
-

 Mining2 weeks ago
Charted: The Value Gap Between the Gold Price and Gold Miners
-

 Demographics2 weeks ago
Visualizing the Size of the Global Senior Population
-

 Misc2 weeks ago
Tesla Is Once Again the World’s Best-Selling EV Company
-

 Technology2 weeks ago
Ranked: The Most Popular Smartphone Brands in the U.S.