Money
The Richest People in the World in 2023


The Richest People in the World in 2023
After witnessing record gains in wealth, ultra-high net worth individuals (UHNWIs) lost a combined $10 trillion last year.
A lagging stock market dented these fortunes against high interest rates, energy shocks, and economic uncertainty. But in 2023, some of the world’s billionaires have flourished, posting sky-high revenues in spite of inflationary pressures.
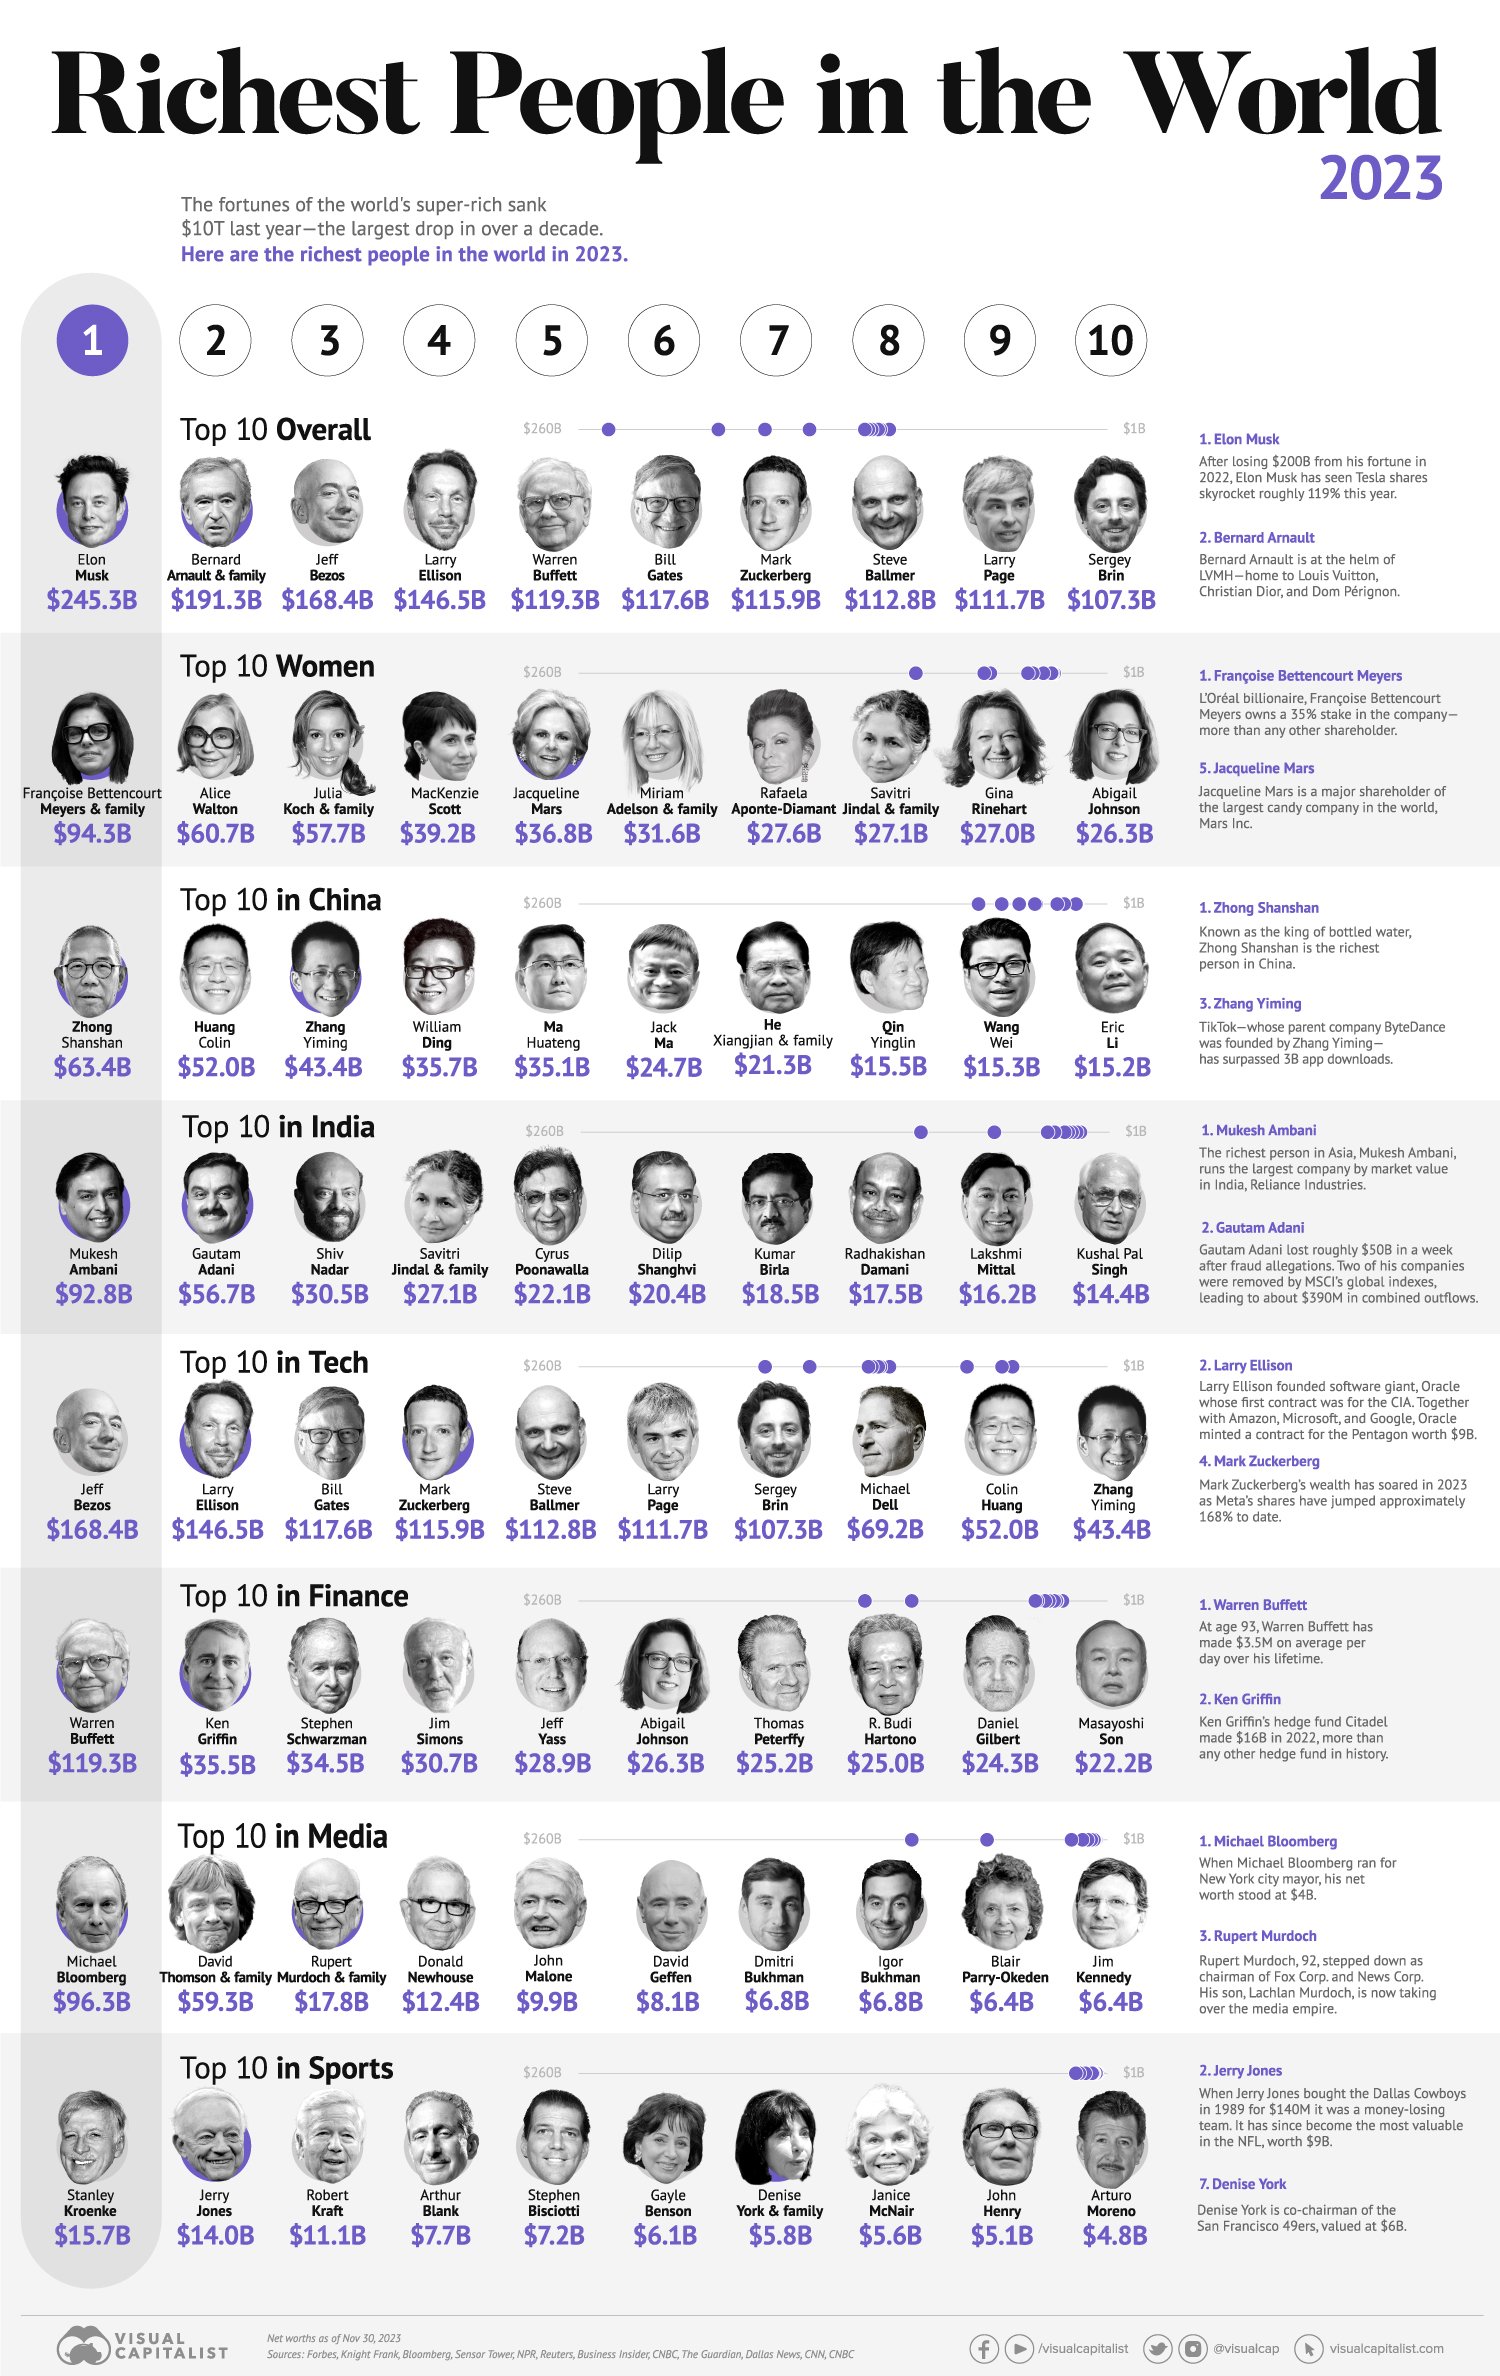
With data from Forbes Real-Time Billionaires List, we feature a snapshot of the richest people in the world in 2023.
Elon Musk at the Top
Elon Musk, CEO of Tesla and the company’s largest shareholder, is the wealthiest person in the world. Musk’s net worth stands at over $245 billion.
In November, Tesla launched its Cybertruck, its first new passenger vehicle in three years. Musk called it the company’s “best product ever.” The event drew mixed responses, with some complaining that cheaper models had jumped $20,000 from previous price targets.
In the table below, we show the world’s 10 richest people with data as of November 30, 2023:
| Rank | Name | Source | Net Worth Dec 2023 |
|---|---|---|---|
| 1 | Elon Musk | Tesla, SpaceX | $245B |
| 2 | Bernard Arnault & family | LVMH | $191B |
| 3 | Jeff Bezos | Amazon | $168B |
| 4 | Larry Ellison | Oracle | $147B |
| 5 | Warren Buffett | Berkshire Hathaway | $119B |
| 6 | Bill Gates | Microsoft | $118B |
| 7 | Mark Zuckerberg | Meta (Facebook) | $116B |
| 8 | Steve Ballmer | Microsoft | $113B |
| 9 | Larry Page | $112B | |
| 10 | Sergey Brin | $107B |
The second-richest person in the world is France’s Bernard Arnault, chairman and CEO of LVMH. With 75 brands, the luxury conglomerate owns Louis Vuitton, Christian Dior, and Tiffany.
Third on the list is Jeff Bezos, followed by Oracle founder Larry Ellison. Oracle, a multi-billion dollar cloud provider, is partnering with Nvidia in its artificial intelligence (AI) supercomputing platform designed for enterprises across multiple industries.
Fifth on the list is Warren Buffett. In his 2022 annual letter to shareholders, he discussed how Berkshire Hathaway reported record operating profits despite economic headwinds. The company outperformed the S&P 500 Index by about 22% in 2022.
How Fortunes Have Changed
Given multiple economic crosscurrents, billionaire wealth has diverged over the last year. Zuckerberg’s wealth has soared the fastest, at 57%, followed by Ellison at 43%.
In its “year of efficiency,” Meta has laid off over 10,000 employees this year on top of 11,000 in November of 2022. Meanwhile, online advertising has bounced back in 2023, and the company posted better-than-expected revenues in the third quarter.
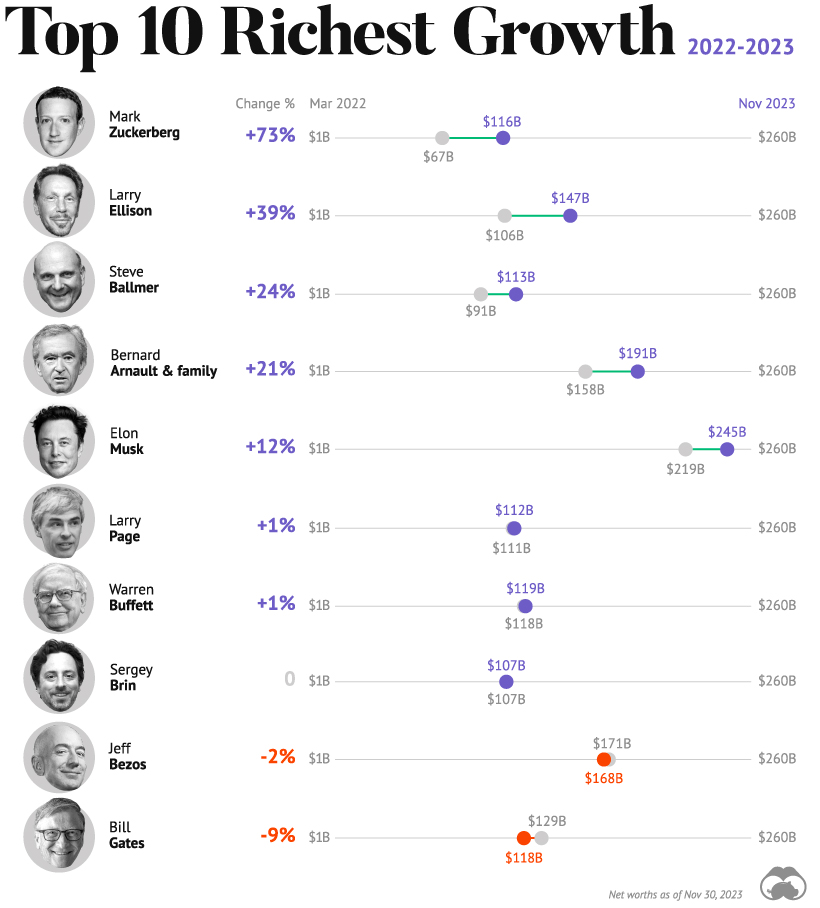
Bill Gates has seen his wealth decline 9%, or $11 billion, the most across the top 10 richest.
So far this year, AI market euphoria has led fortunes in big tech to rebound, although not all have fully recovered. In 2022, the top 10 tech billionaires lost almost $500 billion in combined wealth.
Taylor Swift Reaches Billionaire Status
Thanks to the stunning success of the Eras Tour, Taylor Swift became one of the newest members of the Forbes list in October, with a $1.1 billion net worth.
The tour has added an estimated $4.3 billion to U.S. GDP.
Swift’s music sales have generated the majority of her fortune, at $400 million since 2019. This is followed by ticket sales and merchandise ($370 million), streaming earnings ($120 million), and the value of her five personal properties ($110 million).


Money
How Debt-to-GDP Ratios Have Changed Since 2000
See how much the debt-to-GDP ratios of advanced economies have grown (or shrank) since the year 2000.


How Debt-to-GDP Ratios Have Changed Since 2000
This was originally posted on our Voronoi app. Download the app for free on Apple or Android and discover incredible data-driven charts from a variety of trusted sources.
Government debt levels have grown in most parts of the world since the 2008 financial crisis, and even more so after the COVID-19 pandemic.
To gain perspective on this long-term trend, we’ve visualized the debt-to-GDP ratios of advanced economies, as of 2000 and 2024 (estimated). All figures were sourced from the IMF’s World Economic Outlook.
Data and Highlights
The data we used to create this graphic is listed in the table below. “Government gross debt” consists of all liabilities that require payment(s) of interest and/or principal in the future.
| Country | 2000 (%) | 2024 (%) | Change (pp) |
|---|---|---|---|
| 🇯🇵 Japan | 135.6 | 251.9 | +116.3 |
| 🇸🇬 Singapore | 82.3 | 168.3 | +86.0 |
| 🇺🇸 United States | 55.6 | 126.9 | +71.3 |
| 🇬🇧 United Kingdom | 36.6 | 105.9 | +69.3 |
| 🇬🇷 Greece | 104.9 | 160.2 | +55.3 |
| 🇫🇷 France | 58.9 | 110.5 | +51.6 |
| 🇵🇹 Portugal | 54.2 | 104.0 | +49.8 |
| 🇪🇸 Spain | 57.8 | 104.7 | +46.9 |
| 🇸🇮 Slovenia | 25.9 | 66.5 | +40.6 |
| 🇫🇮 Finland | 42.4 | 76.5 | +34.1 |
| 🇭🇷 Croatia | 35.4 | 61.8 | +26.4 |
| 🇨🇦 Canada | 80.4 | 103.3 | +22.9 |
| 🇨🇾 Cyprus | 56.0 | 70.9 | +14.9 |
| 🇦🇹 Austria | 65.7 | 74.0 | +8.3 |
| 🇸🇰 Slovak Republic | 50.5 | 56.5 | +6.0 |
| 🇩🇪 Germany | 59.3 | 64.0 | +4.7 |
| 🇧🇪 Belgium | 109.6 | 106.8 | -2.8 |
| 🇮🇱 Israel | 77.4 | 56.8 | -20.6 |
| 🇮🇸 Iceland | 75.8 | 54.6 | -21.2 |
The debt-to-GDP ratio indicates how much a country owes compared to the size of its economy, reflecting its ability to manage and repay debts. Percentage point (pp) changes shown above indicate the increase or decrease of these ratios.
Countries with the Biggest Increases
Japan (+116 pp), Singapore (+86 pp), and the U.S. (+71 pp) have grown their debt as a percentage of GDP the most since the year 2000.
All three of these countries have stable, well-developed economies, so it’s unlikely that any of them will default on their growing debts. With that said, higher government debt leads to increased interest payments, which in turn can diminish available funds for future government budgets.
This is a rising issue in the U.S., where annual interest payments on the national debt have surpassed $1 trillion for the first time ever.
Only 3 Countries Saw Declines
Among this list of advanced economies, Belgium (-2.8 pp), Iceland (-21.2 pp), and Israel (-20.6 pp) were the only countries that decreased their debt-to-GDP ratio since the year 2000.
According to Fitch Ratings, Iceland’s debt ratio has decreased due to strong GDP growth and the use of its cash deposits to pay down upcoming maturities.
See More Debt Graphics from Visual Capitalist
Curious to see which countries have the most government debt in dollars? Check out this graphic that breaks down $97 trillion in debt as of 2023.

-

 Markets2 weeks ago
Visualizing America’s Shortage of Affordable Homes
-

 Technology1 week ago
Ranked: Semiconductor Companies by Industry Revenue Share
-

 Money1 week ago
Which States Have the Highest Minimum Wage in America?
-

 Real Estate1 week ago
Ranked: The Most Valuable Housing Markets in America
-

 Business2 weeks ago
Charted: Big Four Market Share by S&P 500 Audits
-

 AI2 weeks ago
The Stock Performance of U.S. Chipmakers So Far in 2024
-

 Misc2 weeks ago
Almost Every EV Stock is Down After Q1 2024
-

 Money2 weeks ago
Where Does One U.S. Tax Dollar Go?