Misc
The Psychology of Prices
The Psychology of Prices
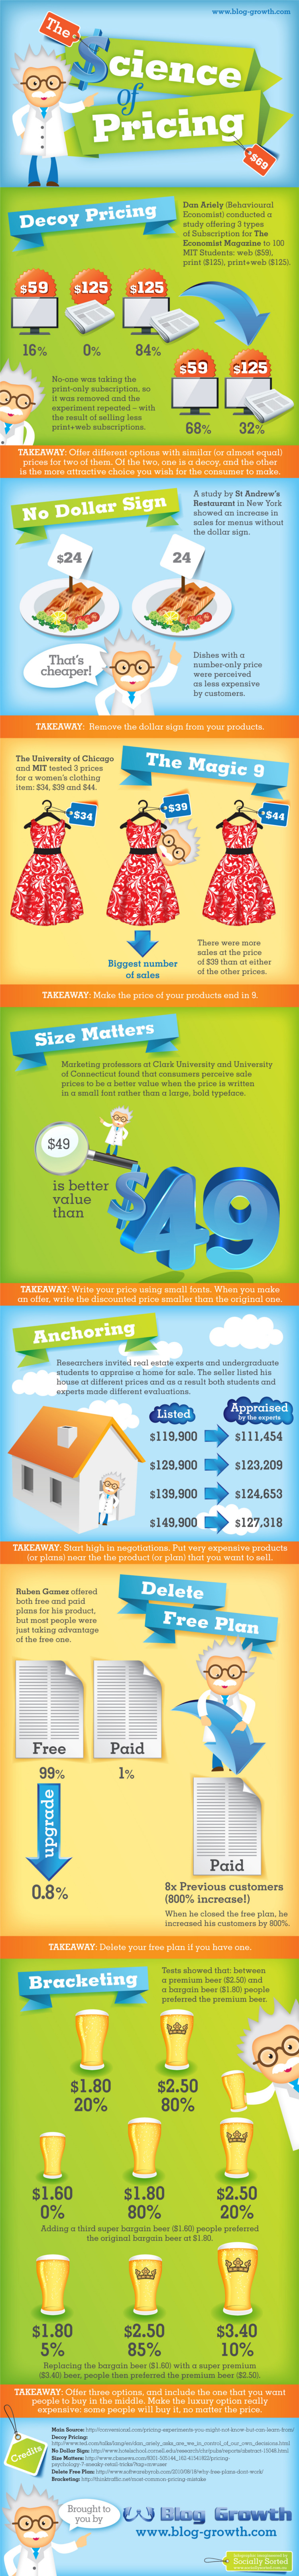
The fascinating infographic we share today focuses in on the psychology of pricing strategy.
In other words: do the actual pricing options provided to a consumer influence overall buying behavior? It turns out the answer to that is a “yes”, and studies show that the extent to which it is a factor in buying decisions is actually very significant.
Aside from just being interesting information, we reckon that there is a parallel with finance and investing as well that may be worth a look.
Investors, like customers, like to get value with what they buy. That’s why, ultimately, the option they choose is a reflection of the prices offered to them as well as the perceived value of each option.
This “perceived value” changes based on the options offered. For example, when potential customers are offered only two subscription options for The Economist (web-only or web + print), only 32% of students would take the more expensive web + print edition. However, when a “decoy” option was added in, offering the print-only edition at a similar price, the amount of web + print subscriptions jumped from 32% to 84%.
What biases do investors or speculators have towards securities that are perceived to have “value” in a given instance?
This is a question worth some self-reflection, because sometimes investors can be their own worst enemies.
Original graphics by: Blog-Growth


Maps
The Largest Earthquakes in the New York Area (1970-2024)
The earthquake that shook buildings across New York in April 2024 was the third-largest quake in the Northeast U.S. over the past 50 years.


The Largest Earthquakes in the New York Area
This was originally posted on our Voronoi app. Download the app for free on Apple or Android and discover incredible data-driven charts from a variety of trusted sources.
The 4.8 magnitude earthquake that shook buildings across New York on Friday, April 5th, 2024 was the third-largest quake in the U.S. Northeast area over the past 50 years.
In this map, we illustrate earthquakes with a magnitude of 4.0 or greater recorded in the Northeastern U.S. since 1970, according to the United States Geological Survey (USGS).
Shallow Quakes and Older Buildings
The earthquake that struck the U.S. Northeast in April 2024 was felt by millions of people from Washington, D.C., to north of Boston. It even caused a full ground stop at Newark Airport.
The quake, occurring just 5 km beneath the Earth’s surface, was considered shallow, which is what contributed to more intense shaking at the surface.
According to the USGS, rocks in the eastern U.S. are significantly older, denser, and harder than those on the western side, compressed by time. This makes them more efficient conduits for seismic energy. Additionally, buildings in the Northeast tend to be older and may not adhere to the latest earthquake codes.
Despite disrupting work and school life, the earthquake was considered minor, according to the Michigan Technological University magnitude scale:
| Magnitude | Earthquake Effects | Estimated Number Each Year |
|---|---|---|
| 2.5 or less | Usually not felt, but can be recorded by seismograph. | Millions |
| 2.5 to 5.4 | Often felt, but only causes minor damage. | 500,000 |
| 5.5 to 6.0 | Slight damage to buildings and other structures. | 350 |
| 6.1 to 6.9 | May cause a lot of damage in very populated areas. | 100 |
| 7.0 to 7.9 | Major earthquake. Serious damage. | 10-15 |
| 8.0 or greater | Great earthquake. Can totally destroy communities near the epicenter. | One every year or two |
The largest earthquake felt in the area over the past 50 years was a 5.3 magnitude quake that occurred in Au Sable Forks, New York, in 2002. It damaged houses and cracked roads in a remote corner of the Adirondack Mountains, but caused no injuries.
| Date | Magnitude | Location | State |
|---|---|---|---|
| April 20, 2002 | 5.3 | Au Sable Forks | New York |
| October 7, 1983 | 5.1 | Newcomb | New York |
| April 5, 2024 | 4.8 | Whitehouse Station | New Jersey |
| October 16, 2012 | 4.7 | Hollis Center | Maine |
| January 16, 1994 | 4.6 | Sinking Spring | Pennsylvania |
| January 19, 1982 | 4.5 | Sanbornton | New Hampshire |
| September 25, 1998 | 4.5 | Adamsville | Pennsylvania |
| June 9, 1975 | 4.2 | Altona | New York |
| May 29, 1983 | 4.2 | Peru | Maine |
| April 23, 1984 | 4.2 | Conestoga | Pennsylvania |
| January 16, 1994 | 4.2 | Sinking Spring | Pennsylvania |
| November 3, 1975 | 4 | Long Lake | New York |
| June 17, 1991 | 4 | Worcester | New York |
The largest earthquake in U.S. history, however, was the 1964 Good Friday quake in Alaska, measuring 9.2 magnitude and killing 131 people.

-

 Business2 weeks ago
America’s Top Companies by Revenue (1994 vs. 2023)
-

 Environment1 week ago
Ranked: Top Countries by Total Forest Loss Since 2001
-

 Markets2 weeks ago
Visualizing America’s Shortage of Affordable Homes
-

 Maps2 weeks ago
Mapped: Average Wages Across Europe
-

 Mining2 weeks ago
Charted: The Value Gap Between the Gold Price and Gold Miners
-

 Demographics2 weeks ago
Visualizing the Size of the Global Senior Population
-

 Misc2 weeks ago
Tesla Is Once Again the World’s Best-Selling EV Company
-

 Technology2 weeks ago
Ranked: The Most Popular Smartphone Brands in the U.S.