Misc
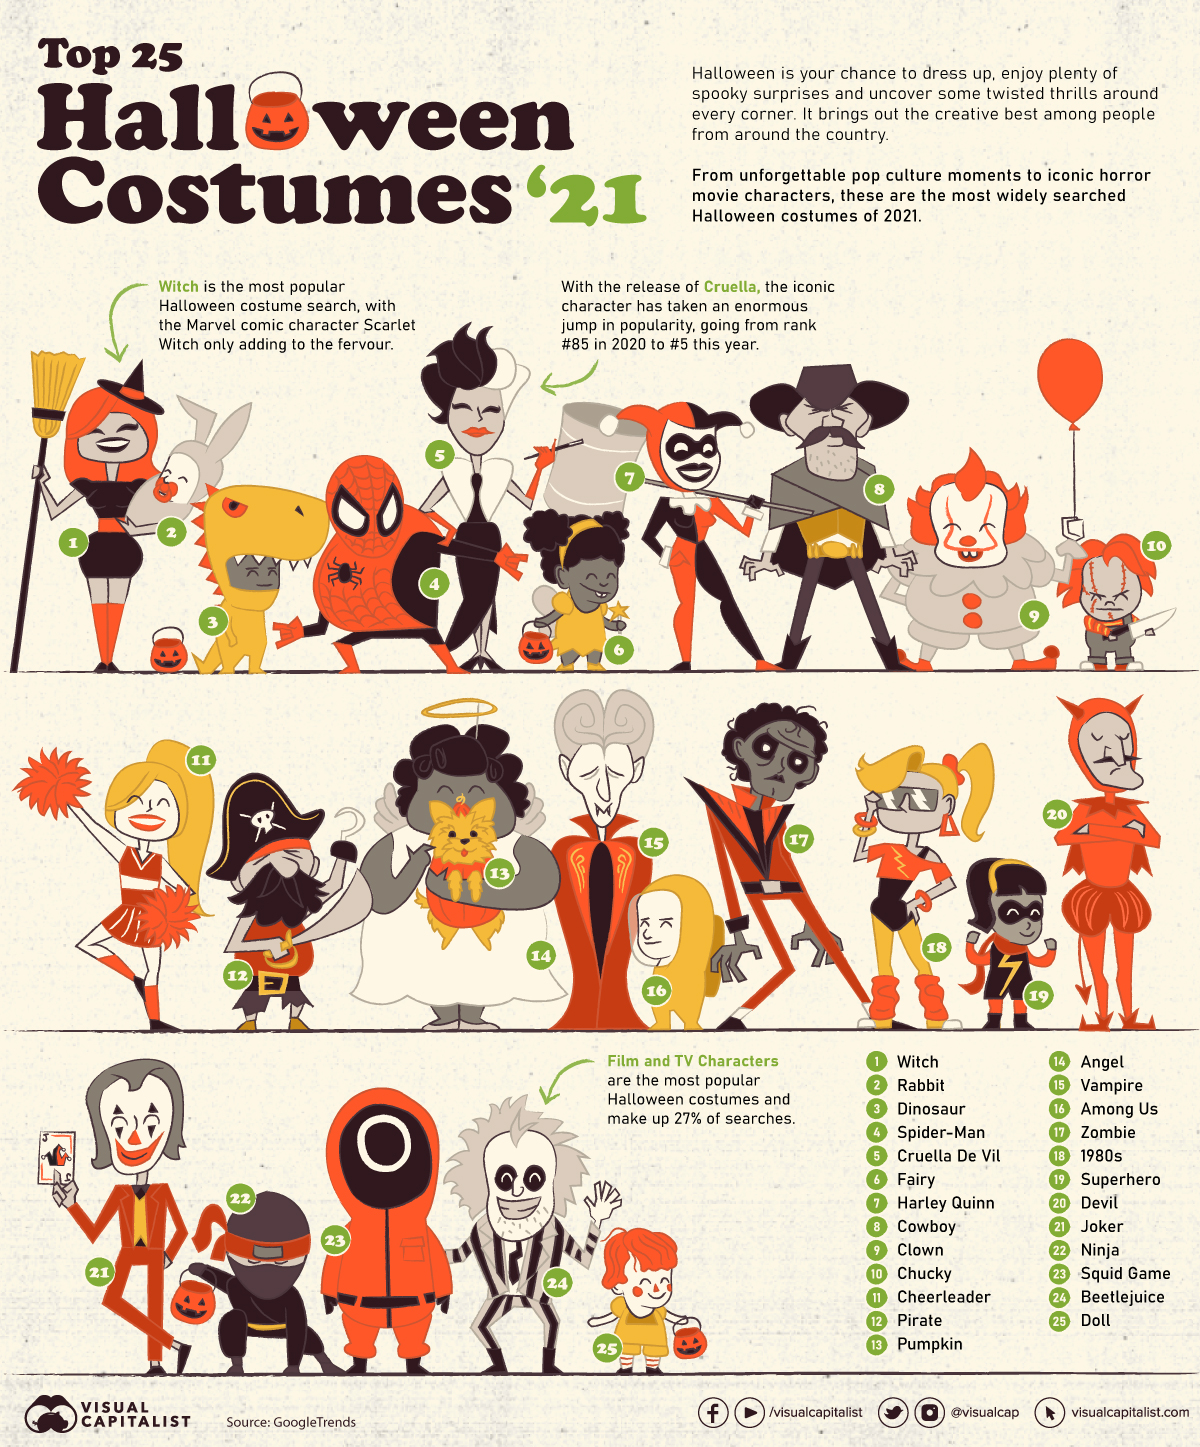
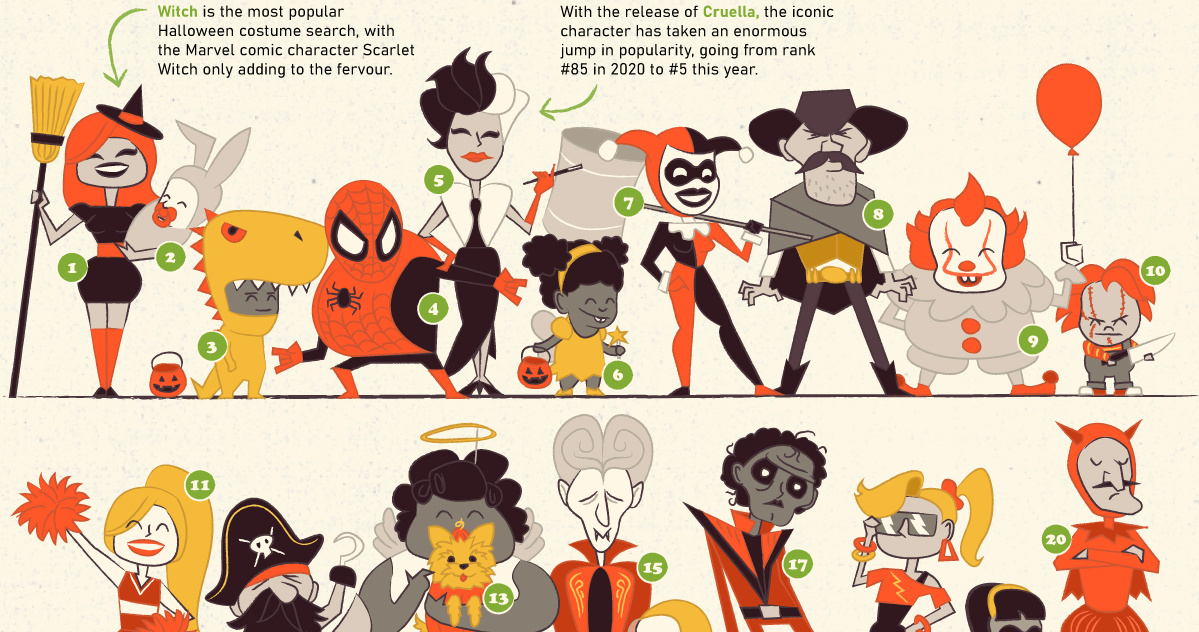
The Most Popular Halloween Costumes of 2021
The Most Popular Halloween Costumes of 2021
Halloween—it’s the time of year when kids and adults alike dress up, eat candy, and show off their spookiest selves. It’s also when the scariest home decorations are the talk of the town, and people are frightened left, right, and center.
With the help of data from Google Trends and their unique Frightgeist series, we visualized the most searched Halloween costumes in the U.S. in 2021.
From spooky to sweet, these are the costumes everyone wants to dress up as this Halloween.
A Brief History of Halloween
Halloween is celebrated each year on October 31, with this year’s Halloween occurring on a Sunday. The tradition originated with the ancient Celtic festival of Samhain, where people would light bonfires and wear costumes to ward off ghosts.
The concept of Halloween didn’t gain popularity until it reached the United States. Borrowing from European traditions, Americans began to dress up in costumes and go house to house asking for food or money, a practice that eventually became today’s “trick-or-treat” tradition.
Other superstitions also started to form around the holiday. Young women believed they could divine the appearance of their future husbands by doing tricks with apple parings or mirrors.
Over time, Halloween moved away from focusing on witchcraft and ghosts to the festival we know and love today—a day focused on games, foods of the season, and festive costumes.
What Are the Most Popular Halloween Costumes?
With COVID-19 cases down compared to last year and Americans expected to spend over $10 billion on Halloween this year, much of the United States will be partaking in celebrating the spooky holiday.
From classy costumes and last-minute DIYs to pop-culture outfits and even era-inspired costumes, here are the top 25 most popular Halloween costumes in the U.S. in 2021.
| Rank | Costume Name | Category |
|---|---|---|
| 1 | Witch | Horror Films |
| 2 | Rabbit | Animals |
| 3 | Dinosaur | Animals |
| 4 | Spider-Man | Comic Book Characters |
| 5 | Cruella de Vil | Film Characters |
| 6 | Fairy | Fantasy Characters |
| 7 | Harley Quinn | Comic Book Characters |
| 8 | Cowboy | Professions |
| 9 | Clown | Professions |
| 10 | Chucky | Horror Films |
| 11 | Cheerleader | Professions |
| 12 | Pirate | Professions |
| 13 | Pumpkin | Foods |
| 14 | Angel | Characters |
| 15 | Vampire | Fantasy Characters |
| 16 | Among Us | TV Charaters |
| 17 | Zombie | Horror Films |
| 18 | 1980's | Era |
| 19 | Superhero | Comic Book Characters |
| 20 | Devil | Characters |
| 21 | Joker | Film Characters |
| 22 | Ninja | Professions |
| 23 | Squid Game | TV Charaters |
| 24 | Beetejuice | Horror Films |
| 25 | Doll | Toys |
Notable Trending Costumes
The Netflix show Squid Game has had a meteoric rise in popularity in recent weeks, becoming one of the most-watched shows on the streaming platform—just in time for Halloween.
Squid Game costumes are the 23rd most popular in Google’s search, and they continue to trend high, being the most searched costume idea in Detroit.
In 2020, the mobile game Among Us was the talk of the gaming world, and this year it is the 16th most popular costume, with its popularity spiking in Jacksonville, Florida.
Other notable costumes in the top 50 include Pokémon at #50, Fortnite at #44, Velma Dinkley (of Scooby-Doo fame) at #42, Poison Ivy (the comic book villain) at #33, Beetlejuice at #24 and the entire 1980s decade at #18.
Most Popular Halloween Costumes by State
When it comes to festivals, every state has its unique perspective and traditions on celebrating them. This extends to popular Halloween costumes too.
Though there might be some overlap, digging deeper into the most popular costumes in every state allows us a unique look into how diverse people’s tastes are across the country.
Here is a breakdown of the most popular costumes in the U.S. in 2020 by state:
| State | Most Popular Costume | National Rank in 2020 |
|---|---|---|
| Alabama | Harley Quinn | 03 |
| Alaska | Beetlejuice | 36 |
| Arizona | Rabbit | 04 |
| Arkansas | Doll | 12 |
| California | Witch | 01 |
| Colorado | Dinosaur | 02 |
| Connecticut | Powerpuff Girls | 32 |
| Delaware | Doll | 12 |
| District of Columbia | Beyonce | 333 |
| Florida | Rabbit | 04 |
| Georgia | Witch | 01 |
| Hawaii | Monsters Inc | 43 |
| Idaho | Witch | 01 |
| Illinois | Dinosaur | 02 |
| Indiana | Witch | 01 |
| Iowa | Chucky | 20 |
| Kansas | Mickey Mouse | 57 |
| Kentucky | Zombie | 13 |
| Louisiana | Witch | 01 |
| Maine | Dinosaur | 02 |
| Maryland | Ninja | 09 |
| Massachusetts | Dinosaur | 02 |
| Michigan | Rabbit | 04 |
| Minnesota | Witch | 01 |
| Mississippi | Angel | 06 |
| Missouri | Dinosaur | 02 |
| Montana | Purge | 15 |
| Nebraska | Joker | 30 |
| Nevada | Witch | 01 |
| New Hampshire | Ninja | 09 |
| New Jersey | Witch | 01 |
| New Mexico | Clueless | 74 |
| New York | Dinosaur | 02 |
| North Carolina | Dinosaur | 02 |
| North Dakota | Star Wars | 28 |
| Ohio | Witch | 01 |
| Oklahoma | Dragon | 35 |
| Oregon | Fortnite | 07 |
| Pennsylvania | Witch | 01 |
| Rhode Island | Hermione Granger | 146 |
| South Carolina | Wonder Woman | 31 |
| South Dakota | Spider | 38 |
| Tennessee | Harley Quinn | 03 |
| Texas | Harley Quinn | 03 |
| Utah | Witch | 01 |
| Vermont | Deer | 125 |
| Virginia | Rabbit | 04 |
| Washington | Angel | 06 |
| West Virginia | Zombie | 13 |
| Wisconsin | Witch | 01 |
| Wyoming | Physician | 67 |
A look at popular costumes at the state level reveals some interesting quirks. Montana, for example, is uniquely interested in The Purge, and Rhode Island trick-or-treaters are big fans of Hermione Granger of Harry Potter fame.
Traditions are Here To Stay
At its core, Halloween still remains that same old fright-inducing festival it has always been.
Even though pop culture might influence your Halloween choices, traditional costumes will always have a unique place in everyone’s heart.


Misc
How Hard Is It to Get Into an Ivy League School?
We detail the admission rates and average annual cost for Ivy League schools, as well as the median SAT scores required to be accepted.


How Hard Is It to Get Into an Ivy League School?
This was originally posted on our Voronoi app. Download the app for free on iOS or Android and discover incredible data-driven charts from a variety of trusted sources.
Ivy League institutions are renowned worldwide for their academic excellence and long-standing traditions. But how hard is it to get into one of the top universities in the U.S.?
In this graphic, we detail the admission rates and average annual cost for Ivy League schools, as well as the median SAT scores required to be accepted. The data comes from the National Center for Education Statistics and was compiled by 24/7 Wall St.
Note that “average annual cost” represents the net price a student pays after subtracting the average value of grants and/or scholarships received.
Harvard is the Most Selective
The SAT is a standardized test commonly used for college admissions in the United States. It’s taken by high school juniors and seniors to assess their readiness for college-level academic work.
When comparing SAT scores, Harvard and Dartmouth are among the most challenging universities to gain admission to. The median SAT scores for their students are 760 for reading and writing and 790 for math. Still, Harvard has half the admission rate (3.2%) compared to Dartmouth (6.4%).
| School | Admission rate (%) | SAT Score: Reading & Writing | SAT Score: Math | Avg Annual Cost* |
|---|---|---|---|---|
| Harvard University | 3.2 | 760 | 790 | $13,259 |
| Columbia University | 3.9 | 750 | 780 | $12,836 |
| Yale University | 4.6 | 760 | 780 | $16,341 |
| Brown University | 5.1 | 760 | 780 | $26,308 |
| Princeton University | 5.7 | 760 | 780 | $11,080 |
| Dartmouth College | 6.4 | 760 | 790 | $33,023 |
| University of Pennsylvania | 6.5 | 750 | 790 | $14,851 |
| Cornell University | 7.5 | 750 | 780 | $29,011 |
*Costs after receiving federal financial aid.
Additionally, Dartmouth has the highest average annual cost at $33,000. Princeton has the lowest at $11,100.
While student debt has surged in the United States in recent years, hitting $1.73 trillion in 2023, the worth of obtaining a degree from any of the schools listed surpasses mere academics. This is evidenced by the substantial incomes earned by former students.
Harvard grads, for example, have the highest average starting salary in the country, at $91,700.

-

 Real Estate2 weeks ago
Visualizing America’s Shortage of Affordable Homes
-

 Technology1 week ago
Ranked: Semiconductor Companies by Industry Revenue Share
-

 Money1 week ago
Which States Have the Highest Minimum Wage in America?
-

 Real Estate1 week ago
Ranked: The Most Valuable Housing Markets in America
-

 Business1 week ago
Charted: Big Four Market Share by S&P 500 Audits
-

 AI2 weeks ago
The Stock Performance of U.S. Chipmakers So Far in 2024
-

 Misc2 weeks ago
Almost Every EV Stock is Down After Q1 2024
-

 Money2 weeks ago
Where Does One U.S. Tax Dollar Go?