Automotive
The Most Fuel Efficient Cars From 1975 to Today


The Most Fuel Efficient Cars From 1975 to Today
When shopping for a new car, what is the most important factor you look for? According to Statista, it’s not design, quality, or even safety—it’s fuel efficiency.
Because of this, automakers are always looking for clever ways to improve gas mileage in their cars. Beating the competition by even the slimmest of margins can give valuable bragging rights within a segment.
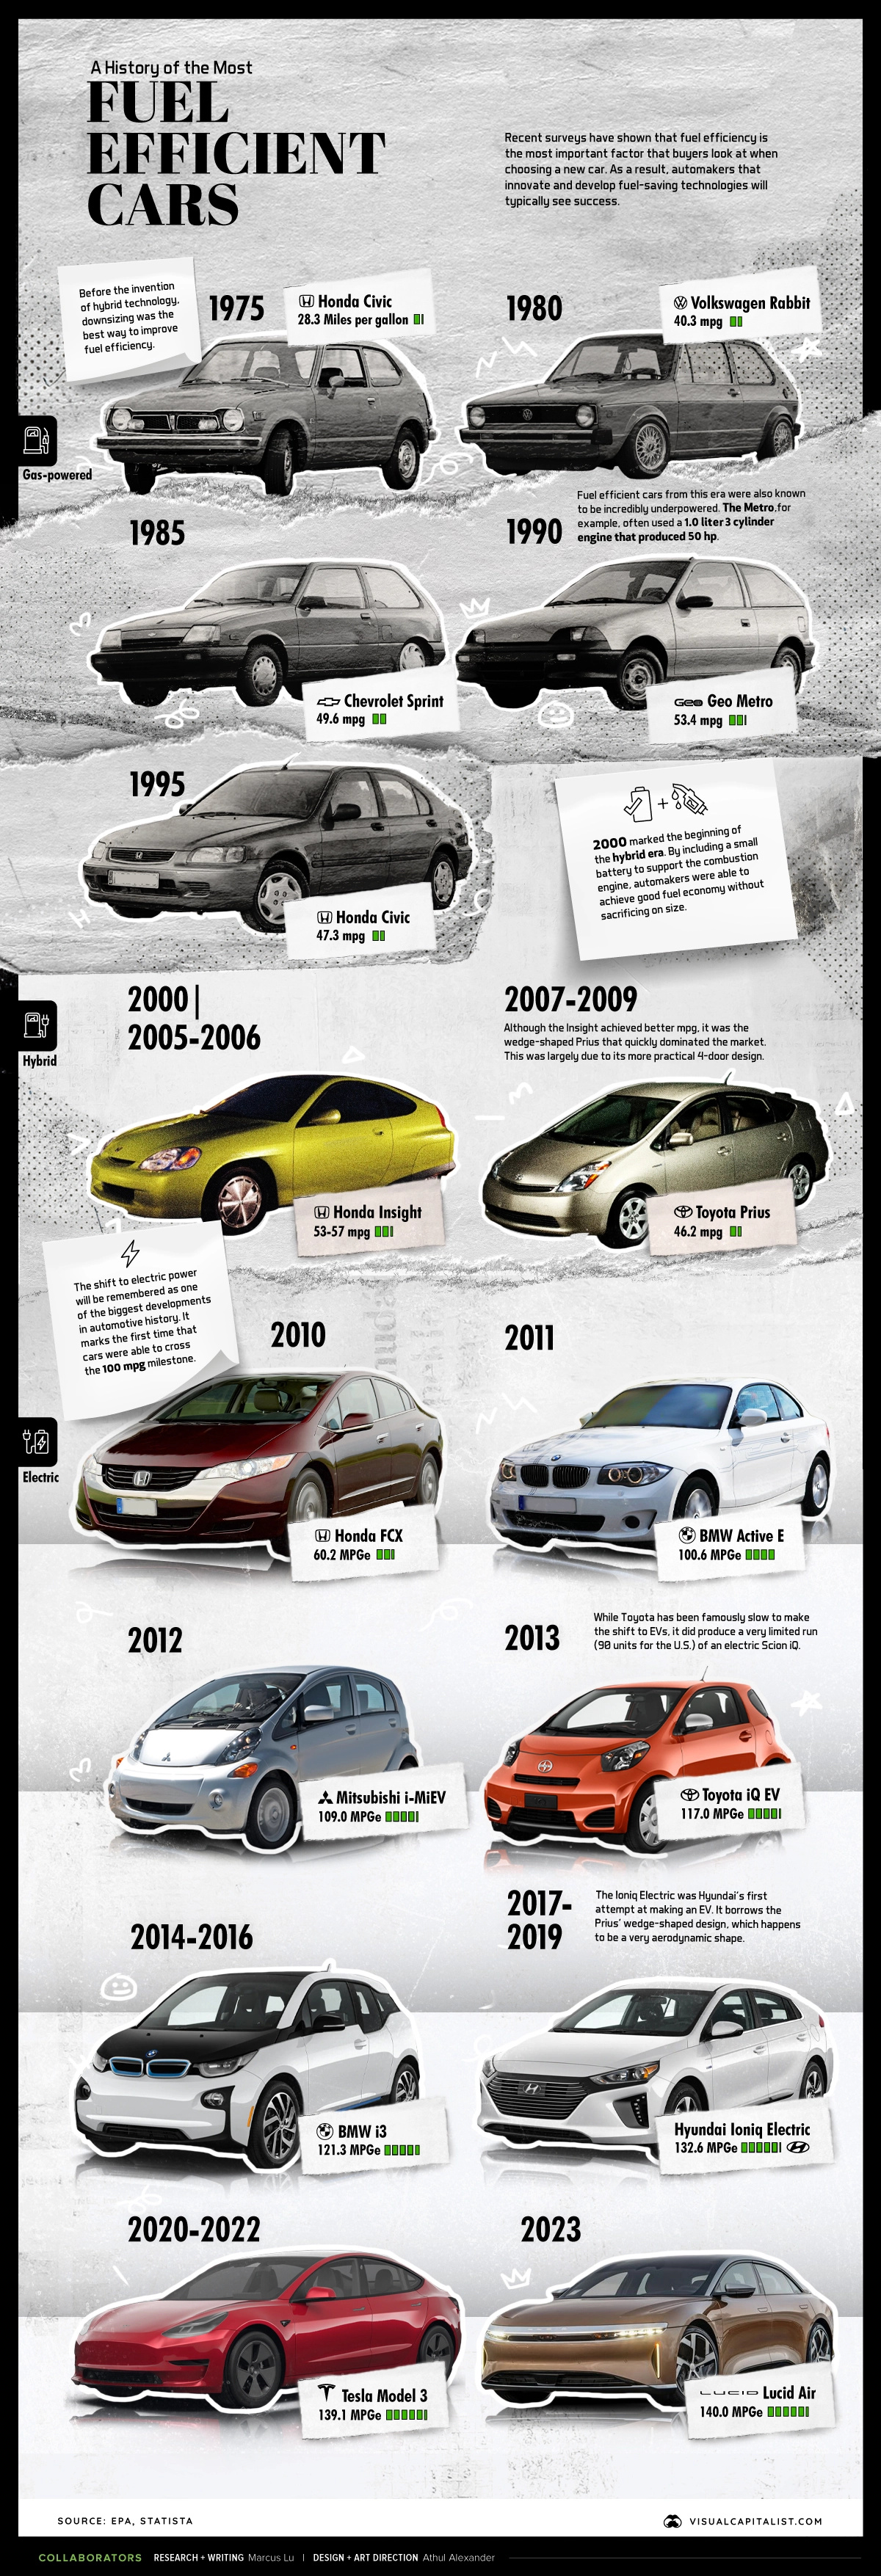
In this infographic, we’ve used data from the EPA’s 2022 Automotive Trends Report to list off the most fuel efficient cars from 1975 to today.
Editor’s note: This is from a U.S. government agency, so the data shown skews towards cars sold in North America.
Data Overview
All of the information in the above infographic is listed in the table below. Data was only available in 5-year increments up until 2005, after which it switches to annual.
| Model Year | Make | Model | Real World Fuel Economy (mpg) | Engine Type |
|---|---|---|---|---|
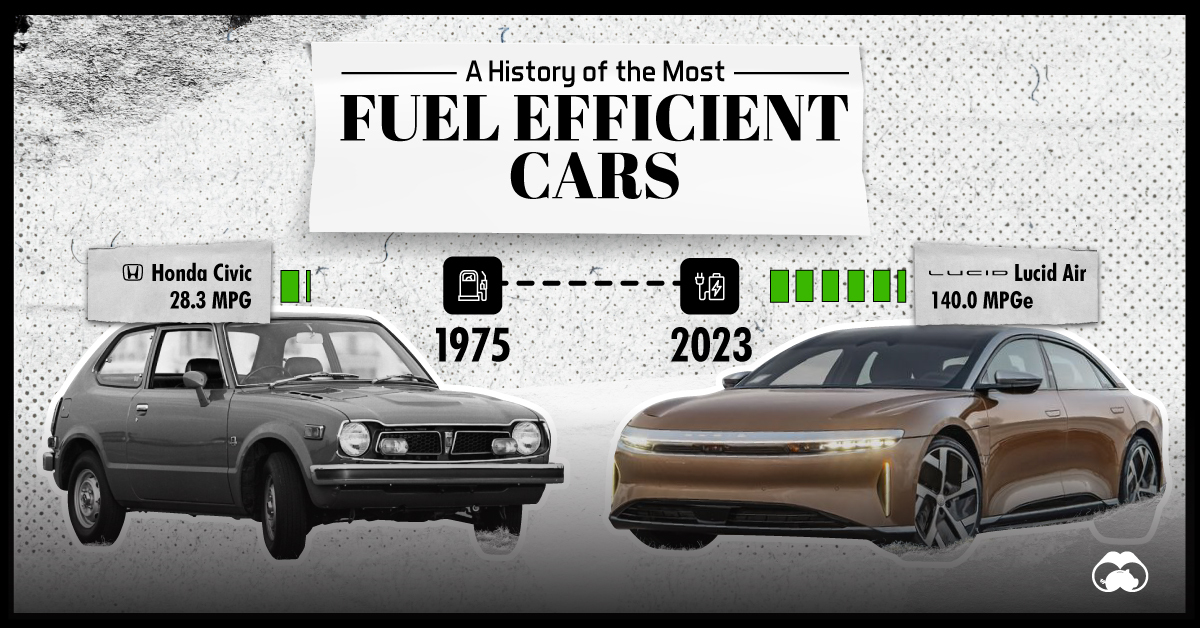
| 1975 | Honda | Civic | 28.3 | Gas |
| 1980 | VW | Rabbit | 40.3 | Diesel |
| 1985 | Chevrolet | Sprint | 49.6 | Gas |
| 1990 | Geo | Metro | 53.4 | Gas |
| 1995 | Honda | Civic | 47.3 | Gas |
| 2000 | Honda | Insight | 57.4 | Hybrid |
| 2005 | Honda | Insight | 53.3 | Hybrid |
| 2006 | Honda | Insight | 53 | Hybrid |
| 2007 | Toyota | Prius | 46.2 | Hybrid |
| 2008 | Toyota | Prius | 46.2 | Hybrid |
| 2009 | Toyota | Prius | 46.2 | Hybrid |
| 2010 | Honda | FCX | 60.2 | FCEV |
| 2011 | BMW | Active E | 100.6 | EV |
| 2012 | Mitsubishi | i-MiEV | 109 | EV |
| 2013 | Toyota | iQ EV | 117 | EV |
| 2014 | BMW | i3 | 121.3 | EV |
| 2015 | BMW | i3 | 121.3 | EV |
| 2016 | BMW | i3 | 121.3 | EV |
| 2017 | Hyundai | Ioniq Electric | 132.6 | EV |
| 2018 | Hyundai | Ioniq Electric | 132.6 | EV |
| 2019 | Hyundai | Ioniq Electric | 132.6 | EV |
| 2020 | Tesla | 3 | 138.6 | EV |
| 2021 | Tesla | 3 | 139.1 | EV |
From this dataset, we can identify three distinct approaches to maximizing fuel efficiency.
Downsizing
Prior to 2000, the best way for automakers to achieve good fuel efficiency was by downsizing. Making cars smaller (lighter) meant they could also be fitted with very small engines.
For example, the 1985 Chevrolet Sprint was rated at 49.6 MPG, but had a sluggish 0-60 time of 15 seconds.
Hybrids
The 2000s saw the introduction of mass-market hybrid vehicles like the Honda Insight and Toyota Prius. By including a small battery to support the combustion engine, automakers could achieve good MPGs without sacrificing so heavily on size.
While the Insight achieved better fuel economy than the Prius, it was the latter that became synonymous with the term “hybrid”. This was largely due to the Prius’ more practical 4-door design.
The following table compares annual U.S. sales figures for both models. Insight sales have fluctuated drastically because Honda has produced the model in several short spans (1999-2006, 2009-2014, 2018-2022).
| Year | Insight Sales | Prius Sales |
|---|---|---|
| 2005 | 666 | 107,155 |
| 2006 | 722 | 106,971 |
| 2007 | 3 | 181,221 |
| 2008 | - | 158,884 |
| 2009 | 20,572 | 150,831 |
| 2010 | 20,962 | 140,928 |
| 2011 | 15,549 | 136,464 |
| 2012 | 6,619 | 236,655 |
| 2013 | 4,802 | 234,228 |
| 2014 | 3,965 | 207,372 |
| 2015 | 1,458 | 184,794 |
| 2016 | 67 | 136,629 |
| 2017 | 3 | 108,661 |
| 2018 | 12,513 | 87,590 |
| 2019 | 23,686 | 69,718 |
| 2020 | 15,932 | 43,525 |
| 2021 | 18,685 | 59,010 |
| 2022 | 7,628 | 33,352 |
Source: goodcarbadcar.net
The Prius may have dominated the hybrid market for a long time, but it too has run into troubles. Sales have been declining since 2014, even setting historic lows in recent years.
There are several reasons behind this trend, with one being a wider availability of hybrid models from other brands. We also can’t ignore the release of the Tesla Model 3, which began shipping to customers in 2017.
Electric Vehicles
We’re currently in the middle of a historic transition to electric vehicles. However, because EVs do not use fuel, the EPA had to develop a new system called MPGe (miles per gallon of gasoline-equivalent).
This new metric gives us the ability to compare the efficiency of EVs with traditional gas-powered cars. An underlying assumption of MPGe is that 33.7 kilowatt-hours (kWh) of electricity is comparable to the energy content of a gallon of fuel.
The most fuel efficient car you can buy today is the 2023 Lucid Air, which achieves 140 MPGe. Close behind it is the 2023 Tesla Model 3 RWD, which is rated at 132 MPGe.
Check out this page to see the EPA’s top 10 most efficient vehicles for 2023.


Lithium
Ranked: The Top 10 EV Battery Manufacturers in 2023
Asia dominates this ranking of the world’s largest EV battery manufacturers in 2023.


The Top 10 EV Battery Manufacturers in 2023
This was originally posted on our Voronoi app. Download the app for free on iOS or Android and discover incredible data-driven charts from a variety of trusted sources.
Despite efforts from the U.S. and EU to secure local domestic supply, all major EV battery manufacturers remain based in Asia.
In this graphic we rank the top 10 EV battery manufacturers by total battery deployment (measured in megawatt-hours) in 2023. The data is from EV Volumes.
Chinese Dominance
Contemporary Amperex Technology Co. Limited (CATL) has swiftly risen in less than a decade to claim the title of the largest global battery group.
The Chinese company now has a 34% share of the market and supplies batteries to a range of made-in-China vehicles, including the Tesla Model Y, SAIC’s MG4/Mulan, and various Li Auto models.
| Company | Country | 2023 Production (megawatt-hour) | Share of Total Production |
|---|---|---|---|
| CATL | 🇨🇳 China | 242,700 | 34% |
| BYD | 🇨🇳 China | 115,917 | 16% |
| LG Energy Solution | 🇰🇷 Korea | 108,487 | 15% |
| Panasonic | 🇯🇵 Japan | 56,560 | 8% |
| SK On | 🇰🇷 Korea | 40,711 | 6% |
| Samsung SDI | 🇰🇷 Korea | 35,703 | 5% |
| CALB | 🇨🇳 China | 23,493 | 3% |
| Farasis Energy | 🇨🇳 China | 16,527 | 2% |
| Envision AESC | 🇨🇳 China | 8,342 | 1% |
| Sunwoda | 🇨🇳 China | 6,979 | 1% |
| Other | - | 56,040 | 8% |
In 2023, BYD surpassed LG Energy Solution to claim second place. This was driven by demand from its own models and growth in third-party deals, including providing batteries for the made-in-Germany Tesla Model Y, Toyota bZ3, Changan UNI-V, Venucia V-Online, as well as several Haval and FAW models.
The top three battery makers (CATL, BYD, LG) collectively account for two-thirds (66%) of total battery deployment.
Once a leader in the EV battery business, Panasonic now holds the fourth position with an 8% market share, down from 9% last year. With its main client, Tesla, now sourcing batteries from multiple suppliers, the Japanese battery maker seems to be losing its competitive edge in the industry.
Overall, the global EV battery market size is projected to grow from $49 billion in 2022 to $98 billion by 2029, according to Fortune Business Insights.

-

 Markets1 week ago
U.S. Debt Interest Payments Reach $1 Trillion
-

 Business2 weeks ago
Charted: Big Four Market Share by S&P 500 Audits
-

 Real Estate2 weeks ago
Ranked: The Most Valuable Housing Markets in America
-

 Money2 weeks ago
Which States Have the Highest Minimum Wage in America?
-

 AI2 weeks ago
Ranked: Semiconductor Companies by Industry Revenue Share
-

 Markets2 weeks ago
Ranked: The World’s Top Flight Routes, by Revenue
-

 Demographics2 weeks ago
Population Projections: The World’s 6 Largest Countries in 2075
-

 Markets2 weeks ago
The Top 10 States by Real GDP Growth in 2023