Markets
The Making of a Mammoth Merger: Charles Schwab and TD Ameritrade
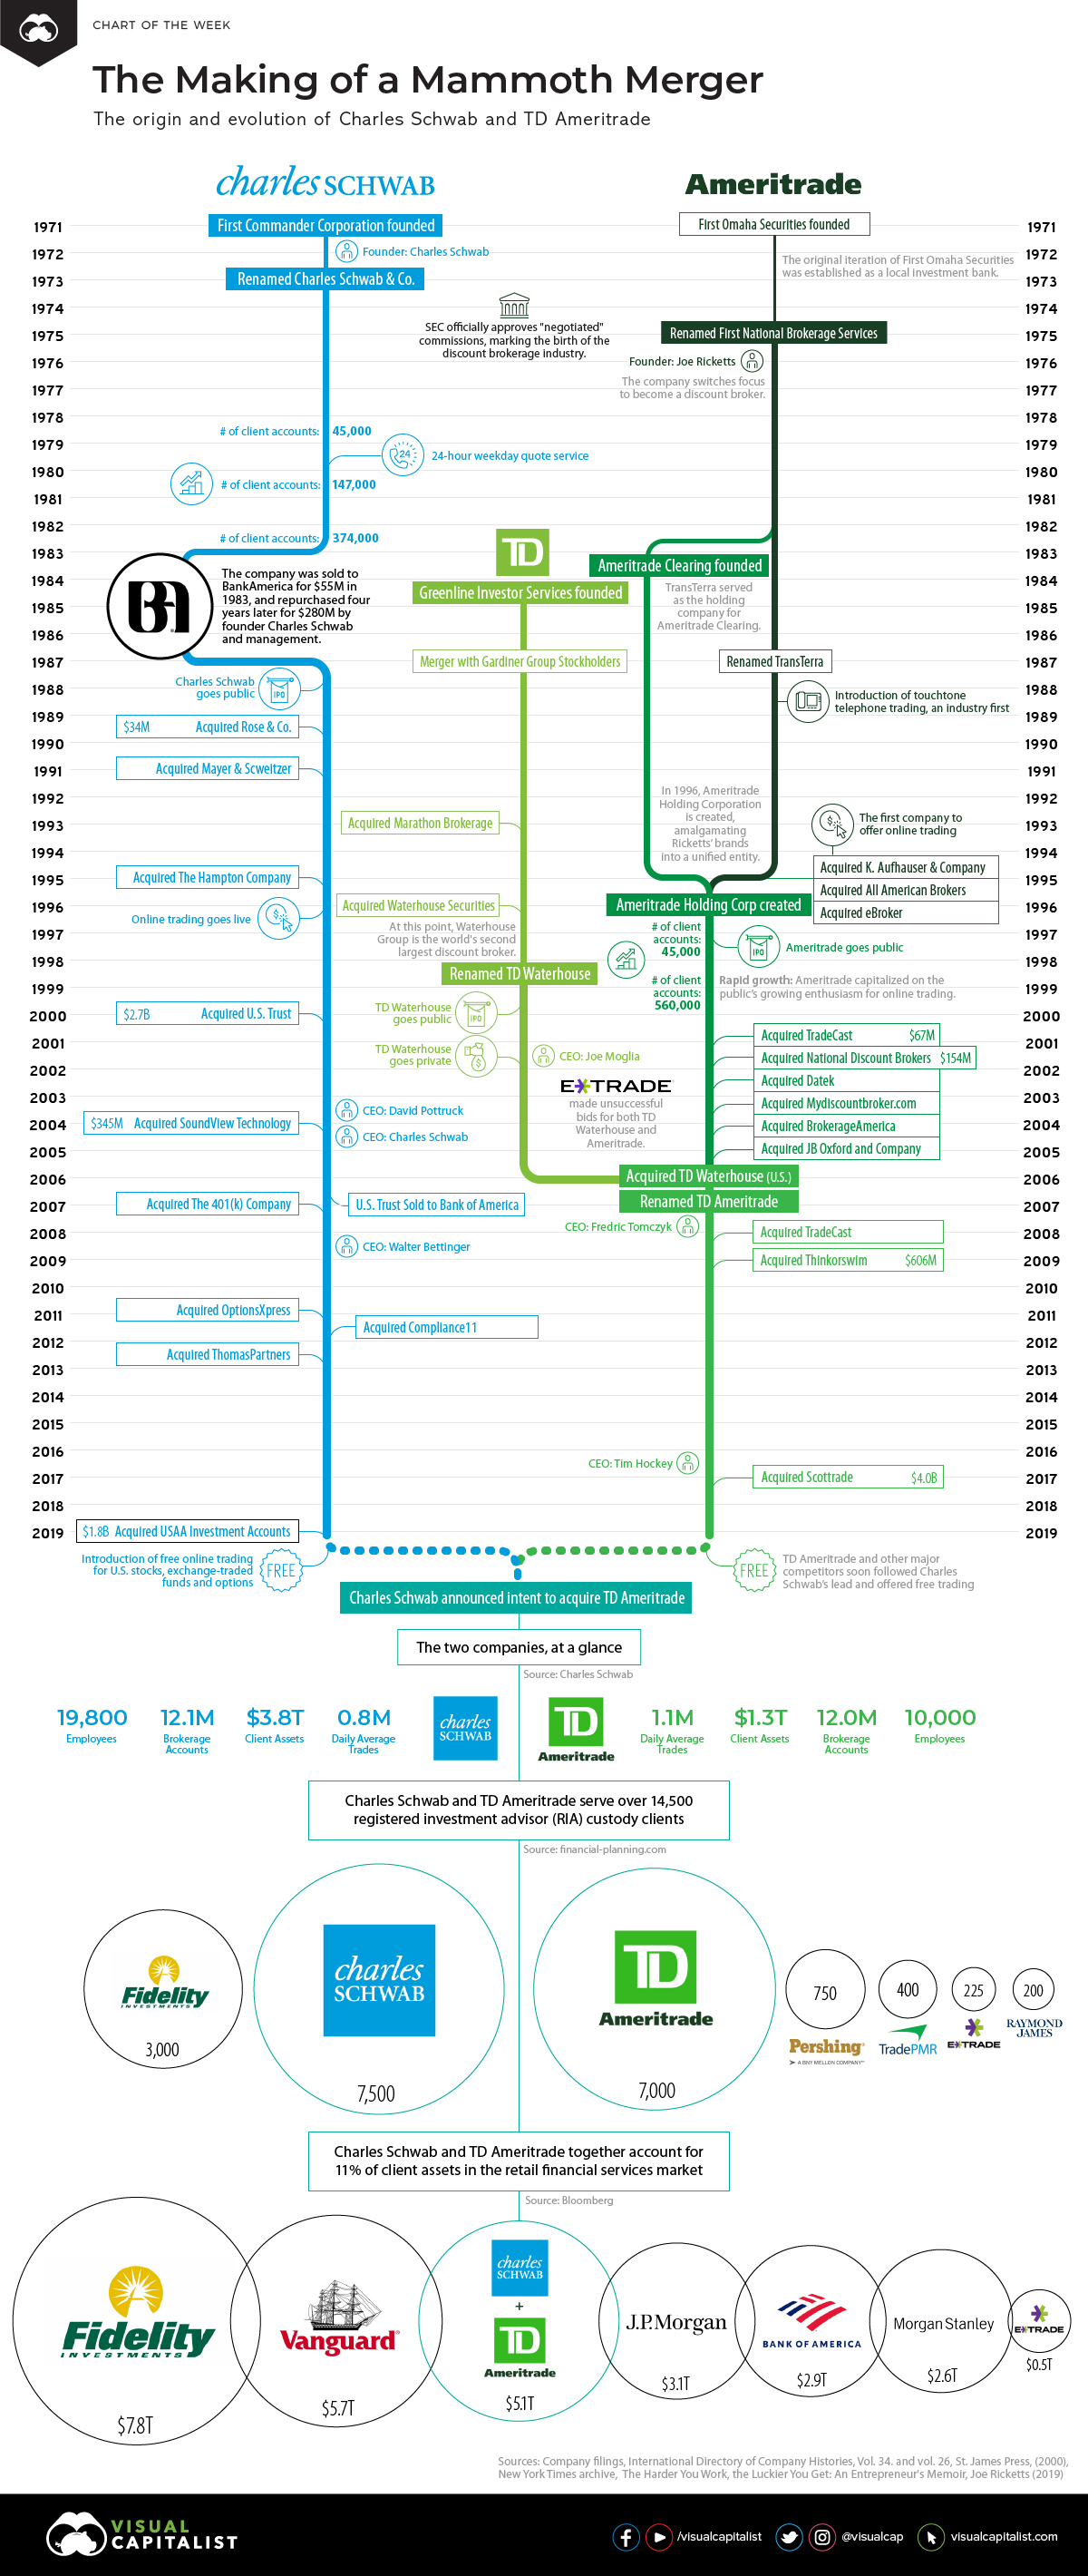
Charles Schwab and TD Ameritrade: A Mammoth Merger
In this era of fierce competition in the discount brokerage space, scale might be the best recipe for success.
Charles Schwab has once again sent shockwaves through the financial services industry, announcing its intent to acquire TD Ameritrade. The all-stock deal — valued at approximately $26 billion — will see the two biggest publicly-traded discount brokers combine into a giant entity with over $5 trillion in client assets.
Today we dive into the history of these two companies, and what effect recent events may have on the financial services industry.
The Evolution of Charles Schwab
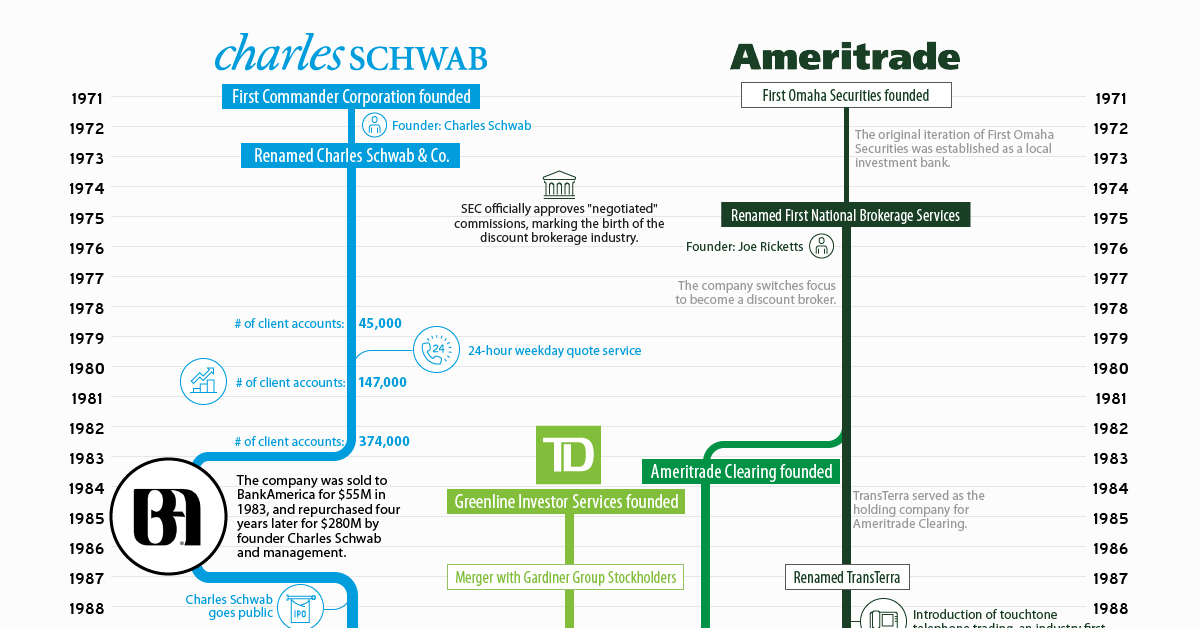
1975 – U.S. Congress deregulated the stock brokerage industry by stripping the NYSE of the power to determine the commission rates charged by its members. Discount brokers, which focused primarily on buying and selling securities, seized the opportunity to court more seasoned investors who might not require the advice or research offered by established brokers. It was during this transitional period that Charles Schwab opened a small brokerage in San Francisco and bought a seat on the New York Stock Exchange.
1980s – The company experienced rapid growth thanks to a healthy marketing budget and innovations, such as the industry’s first 24-hour quotation service.
This fast success proved to be a double-edged sword. Charles Schwab became the largest discount broker in the U.S. by 1980, but profits were erratic, and the company was forced to rescind an initial public offering. Eventually, the company sold to BankAmerica Corporation for $55 million in stock. A mere four years later, Charles Schwab would purchase his namesake company back for $280 million.
1987 – By the time the company went public, Charles Schwab had five times as many customers as its nearest competitor, and profit margin twice as high as the industry average.
1990s – In the late ’90s, Charles Schwab moved into the top five among all U.S. brokerages, after a decade of steady growth.
2000s – The company made a number of acquisitions, including U.S. Trust, which was one of the nation’s leading wealth management firms, and most recently, the USAA’s brokerage and wealth management business.
The Race to $0
For Charles Schwab, the elimination of fees is the culmination of its founder’s vision of making investing “accessible to all”.

The company’s fees were slowly declining for decades. In late 2019, it finally took the plunge and introduced free online trading for U.S. stocks, exchange-traded funds, and options. The response was immediate and enthusiastic, with clients opening 142,000 new trading accounts in the first month alone.
Although Charles Schwab sent rivals scrambling to match its no-commission trade offer, fintech upstarts like Robinhood have offered free trading for years now. The “race to zero” reflects a broader generational shift, as millennials are simply more likely than earlier generations to expect services to be free.
The Evolution of TD Ameritrade
1975 – The origin of TD Ameritrade can be traced back to First Omaha Securities, a discount broker founded by Joe Ricketts. The company changed its name to TransTerra in 1987.
1988 – TransTerra’s subsidiary, Accutrade, was the first company to introduce touch-tone telephone trading, a major innovation at the time and one of the first early forays into automation.
Early 1990s – Ricketts’s willingness to integrate emerging technologies into the trading business helped his companies achieve impressive growth. In 1997 the company acquired K. Aufhauser & Co., the first company to run a trading website.
The Internet wasn’t a puzzle. We were crystal clear from the beginning that customers would migrate to this.
– Joe Ricketts (2000)
Late 1990s – The Ameritrade brand was solidified after the company changed its name from TransTerra to Ameritrade Holding Corporation in 1996. The newly named company completed an IPO the following year, and established its new brand Ameritrade, Inc., which amalgamated K. Aufhauser, eBroker, and other businesses into a unified entity.
2000s – Ameritrade entered the new millennium as the fifth largest online investment broker in the United States, fueled in part by marketing deals with AOL and MSN.
The modern incarnation of TD Ameritrade took shape in 2006, when TD Bank sold its TD Waterhouse USA brokerage unit to the Ameritrade Holding Corporation in a stock-and-cash deal valued at about $3.3 billion. At the time of the deal the new company ranked first in the U.S. by the number of daily trades.
2016 – TD Ameritrade acquired the discount brokerage Scottrade for about $4 billion. The deal brought 3 million client accounts and $170 billion in assets under management into the company, and quadrupled the size of its branch network.
What Comes Next?
Naturally, the announcement that these massive discount brokers plan to merge has generated a lot of speculation as to what this means for the two companies, and the broader brokerage industry as a whole.
Here are some of the consensus key predictions we’ve seen on the deal, from both media and industry publications:
- After the deal is approved, the integration process will take 12 to 18 months. The combined company’s headquarters will relocate to a new office park in Westlake, Texas.
- Charles Schwab’s average revenue per trade has dropped nearly 30% since Q1 2017, so the company will likely use scale to its advantage and monetize other products.
- The merged company will continue to adopt features from fintech upstarts, such as the option to trade in fractional shares.
- E*Trade, which was widely considered to be an acquisition target of Schwab or TD Ameritrade, may now face pressure to hunt for a deal elsewhere.
Even though these longtime rivals are now linking up, stiff competition in the financial services market is bound to keep everyone on their toes.
I think Joe Ricketts and I agree that our fierce competitiveness nearly 30 years ago is proof that market competition can be a source of miraculous innovation.
– Charles Schwab

Economy
Economic Growth Forecasts for G7 and BRICS Countries in 2024
The IMF has released its economic growth forecasts for 2024. How do the G7 and BRICS countries compare?


G7 & BRICS Real GDP Growth Forecasts for 2024
The International Monetary Fund’s (IMF) has released its real gross domestic product (GDP) growth forecasts for 2024, and while global growth is projected to stay steady at 3.2%, various major nations are seeing declining forecasts.
This chart visualizes the 2024 real GDP growth forecasts using data from the IMF’s 2024 World Economic Outlook for G7 and BRICS member nations along with Saudi Arabia, which is still considering an invitation to join the bloc.
Get the Key Insights of the IMF’s World Economic Outlook
Want a visual breakdown of the insights from the IMF’s 2024 World Economic Outlook report?
This visual is part of a special dispatch of the key takeaways exclusively for VC+ members.
Get the full dispatch of charts by signing up to VC+.
Mixed Economic Growth Prospects for Major Nations in 2024
Economic growth projections by the IMF for major nations are mixed, with the majority of G7 and BRICS countries forecasted to have slower growth in 2024 compared to 2023.
Only three BRICS-invited or member countries, Saudi Arabia, the UAE, and South Africa, have higher projected real GDP growth rates in 2024 than last year.
| Group | Country | Real GDP Growth (2023) | Real GDP Growth (2024P) |
|---|---|---|---|
| G7 | 🇺🇸 U.S. | 2.5% | 2.7% |
| G7 | 🇨🇦 Canada | 1.1% | 1.2% |
| G7 | 🇯🇵 Japan | 1.9% | 0.9% |
| G7 | 🇫🇷 France | 0.9% | 0.7% |
| G7 | 🇮🇹 Italy | 0.9% | 0.7% |
| G7 | 🇬🇧 UK | 0.1% | 0.5% |
| G7 | 🇩🇪 Germany | -0.3% | 0.2% |
| BRICS | 🇮🇳 India | 7.8% | 6.8% |
| BRICS | 🇨🇳 China | 5.2% | 4.6% |
| BRICS | 🇦🇪 UAE | 3.4% | 3.5% |
| BRICS | 🇮🇷 Iran | 4.7% | 3.3% |
| BRICS | 🇷🇺 Russia | 3.6% | 3.2% |
| BRICS | 🇪🇬 Egypt | 3.8% | 3.0% |
| BRICS-invited | 🇸🇦 Saudi Arabia | -0.8% | 2.6% |
| BRICS | 🇧🇷 Brazil | 2.9% | 2.2% |
| BRICS | 🇿🇦 South Africa | 0.6% | 0.9% |
| BRICS | 🇪🇹 Ethiopia | 7.2% | 6.2% |
| 🌍 World | 3.2% | 3.2% |
China and India are forecasted to maintain relatively high growth rates in 2024 at 4.6% and 6.8% respectively, but compared to the previous year, China is growing 0.6 percentage points slower while India is an entire percentage point slower.
On the other hand, four G7 nations are set to grow faster than last year, which includes Germany making its comeback from its negative real GDP growth of -0.3% in 2023.
Faster Growth for BRICS than G7 Nations
Despite mostly lower growth forecasts in 2024 compared to 2023, BRICS nations still have a significantly higher average growth forecast at 3.6% compared to the G7 average of 1%.
While the G7 countries’ combined GDP is around $15 trillion greater than the BRICS nations, with continued higher growth rates and the potential to add more members, BRICS looks likely to overtake the G7 in economic size within two decades.
BRICS Expansion Stutters Before October 2024 Summit
BRICS’ recent expansion has stuttered slightly, as Argentina’s newly-elected president Javier Milei declined its invitation and Saudi Arabia clarified that the country is still considering its invitation and has not joined BRICS yet.
Even with these initial growing pains, South Africa’s Foreign Minister Naledi Pandor told reporters in February that 34 different countries have submitted applications to join the growing BRICS bloc.
Any changes to the group are likely to be announced leading up to or at the 2024 BRICS summit which takes place October 22-24 in Kazan, Russia.
Get the Full Analysis of the IMF’s Outlook on VC+
This visual is part of an exclusive special dispatch for VC+ members which breaks down the key takeaways from the IMF’s 2024 World Economic Outlook.
For the full set of charts and analysis, sign up for VC+.

-

 Markets1 week ago
U.S. Debt Interest Payments Reach $1 Trillion
-

 Business2 weeks ago
Charted: Big Four Market Share by S&P 500 Audits
-

 Real Estate2 weeks ago
Ranked: The Most Valuable Housing Markets in America
-

 Money2 weeks ago
Which States Have the Highest Minimum Wage in America?
-

 AI2 weeks ago
Ranked: Semiconductor Companies by Industry Revenue Share
-

 Markets2 weeks ago
Ranked: The World’s Top Flight Routes, by Revenue
-

 Demographics2 weeks ago
Population Projections: The World’s 6 Largest Countries in 2075
-

 Markets2 weeks ago
The Top 10 States by Real GDP Growth in 2023