Misc
The History of the World, in One Video
Throughout the history of the world, many civilizations have risen and fallen.
You may be familiar with the achievements of prominent societies like the Romans, Mongols, or Babylonians, but how do all of their stories intertwine over time and geography?
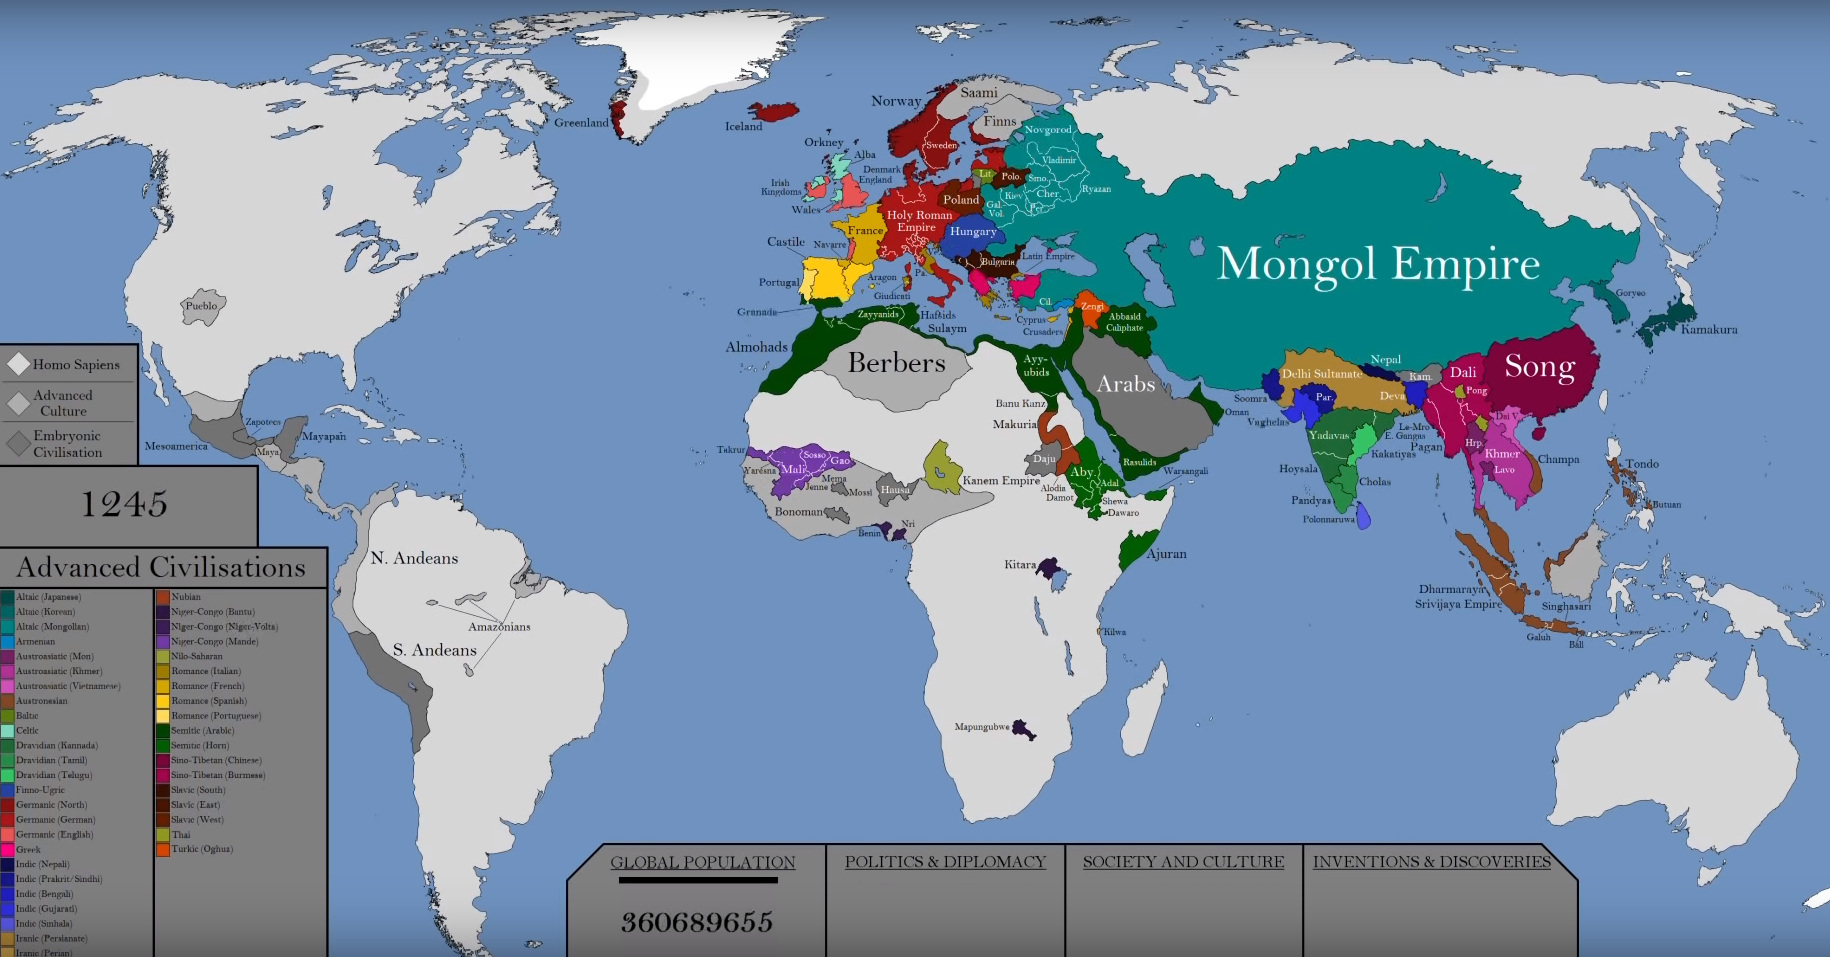
Visualizing the History of the World
Today’s video comes to us from Ollie Bye, and it attempts to integrate the histories of all major civilizations known by historians into a single, epic video.
Similar to the Histomap, it’s pretty much impossible for a video like this to be perfect due to biases and a general lack of data. However, it’s still a compelling attempt at showing global history in a short and sweet fashion.
Let’s look at some specific moments on the video that particularly stand out.
750 AD: The Umayyad Caliphate
One of the largest empires in history, the Umayyad Caliphate peaked sometime around 750 AD.
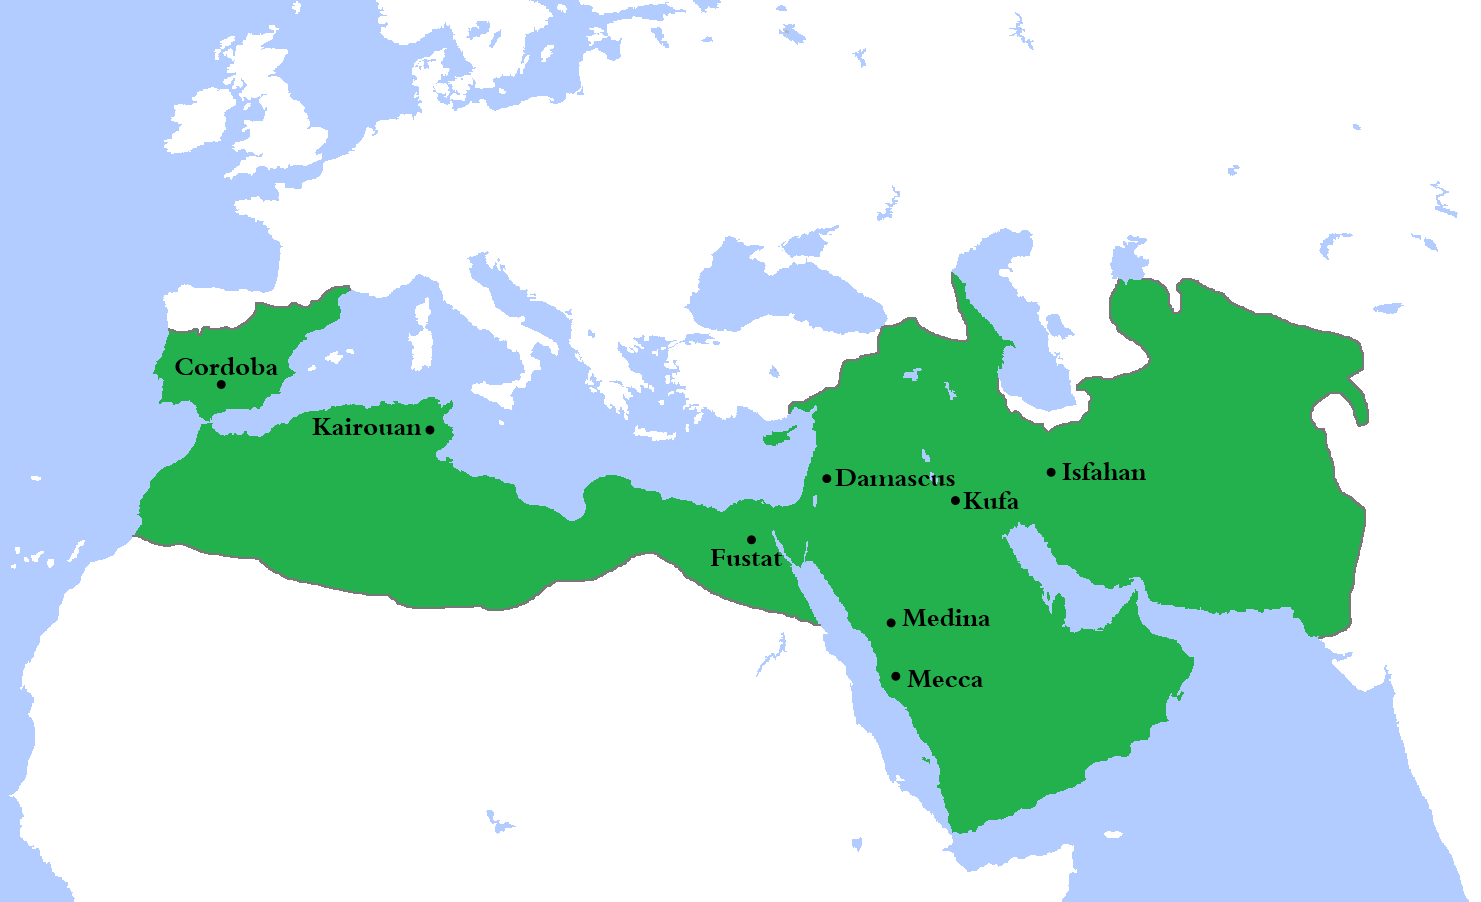
Conquering most of North Africa, the Middle East, and even parts of Europe (including modern-day Spain, Portugal, and France), the Umayyads commanded a formidable territory with an area of 11,100,000 km² (4,300,000 sq. mi) and encompassing 33 million people.
1279: Mongol Dominance
No history of the world is complete without a mention of the Mongols.
Nearby societies have always been on edge when nomadic tribes in the Eurasian Steppe entered into organized confederations. Similar to the Huns or various Turk federations, the Mongols were known for their proficiency with horses, bows, and tactics like the feigned retreat.
Under the leadership of Temüjin — also known as Genghis Khan — the Mongols conquered one of the largest empires by land.
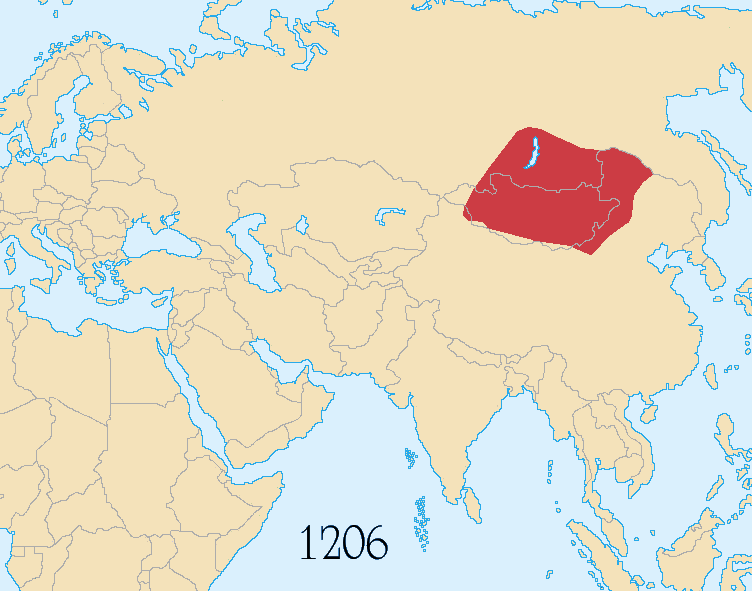
The empire reached its greatest extent just two years after the death of Genghis Khan.
Later on, it fragmented into smaller empires that were also quite notable in the context of world history. For example, Kublai Khan — the grandson of Genghis Khan — even went on to begin the influential Yuan Dynasty in China.
1346: The Black Death
The video also shows other vital stats, such as an estimate of global population through the ages.
In the mid-14th century, you can see this number take a rare U-turn, as millions of people die from the infamous and deadly Bubonic Plague.
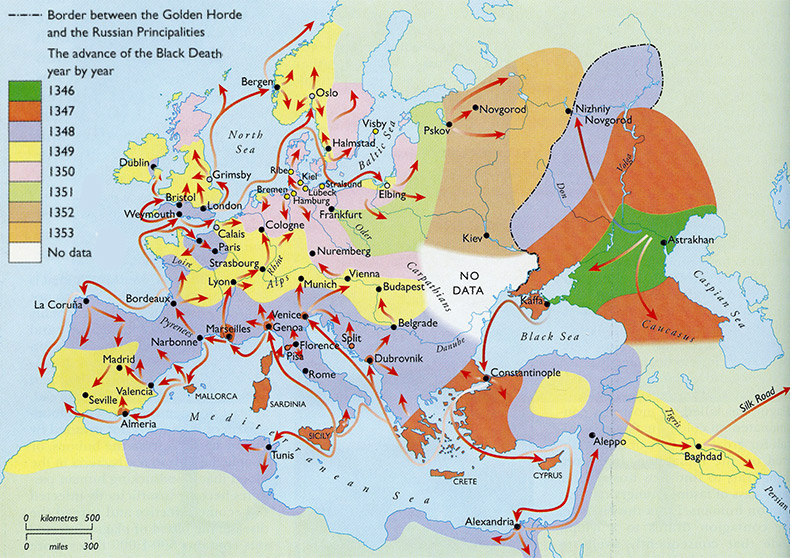
The Black Death — one of the most devastating pandemics in the history of the world — hit Europe in 1346, and it eventually killed 30-60% of the continent’s population. There is no exact figure on the final death toll, but historians estimate it to be somewhere between 75 and 200 million people throughout Eurasia.
1418: The Age of Discovery
The video also provides a 10,000-foot view of the Age of Discovery, a period of time in which European powers explored the world’s oceans.
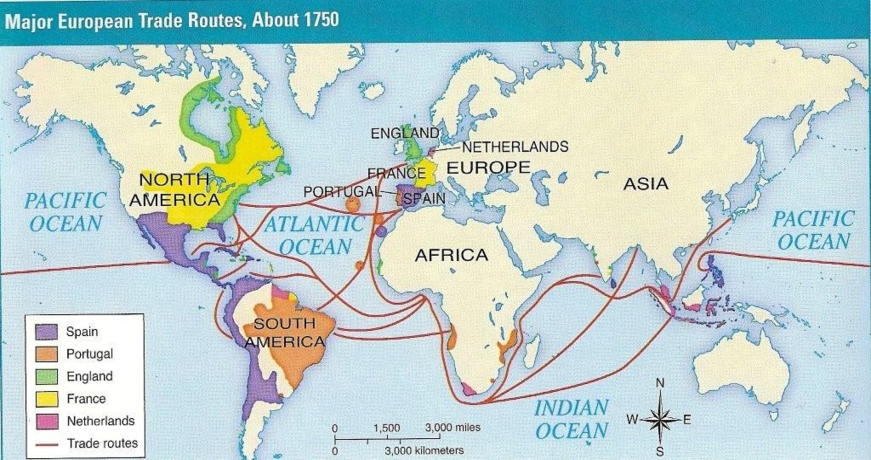
This colonial period marks the beginning of globalization, creating wide-ranging impacts that set the stage for more modern history.
In the video, it’s possible to see European colonies develop in all parts of the world, as well as how they eventually morphed into the countries that dot the globe today.
Playing the History Game
While it is certainly ambitious, not everyone will agree that this is a successful attempt at portraying world history – even in the limited scope of time allotted.
One key detail that seems to be missing, for example, is showing the development of the indigenous societies that existed in North America for thousands of years. That said, it’s also not clear what data and records are available to show these maps over many centuries of time.
Despite the possible flaws, the video does pack a lot of information into a short period of time, creating a compelling opportunity for learning and discussion. Like the Histomap, it may not be a definitive history of the world – but instead, it’s a useful attempt that stimulates our appetite for more information about the world and the societies that inhabit it.


VC+
VC+: Get Our Key Takeaways From the IMF’s World Economic Outlook
A sneak preview of the exclusive VC+ Special Dispatch—your shortcut to understanding IMF’s World Economic Outlook report.

Have you read IMF’s latest World Economic Outlook yet? At a daunting 202 pages, we don’t blame you if it’s still on your to-do list.
But don’t worry, you don’t need to read the whole April release, because we’ve already done the hard work for you.
To save you time and effort, the Visual Capitalist team has compiled a visual analysis of everything you need to know from the report—and our upcoming VC+ Special Dispatch will be available exclusively to VC+ members on Thursday, April 25th.
If you’re not already subscribed to VC+, make sure you sign up now to receive the full analysis of the IMF report, and more (we release similar deep dives every week).
For now, here’s what VC+ members can expect to receive.
Your Shortcut to Understanding IMF’s World Economic Outlook
With long and short-term growth prospects declining for many countries around the world, this Special Dispatch offers a visual analysis of the key figures and takeaways from the IMF’s report including:
- The global decline in economic growth forecasts
- Real GDP growth and inflation forecasts for major nations in 2024
- When interest rate cuts will happen and interest rate forecasts
- How debt-to-GDP ratios have changed since 2000
- And much more!

Get the Full Breakdown in the Next VC+ Special Dispatch
VC+ members will receive the full Special Dispatch on Thursday, April 25th.
Make sure you join VC+ now to receive exclusive charts and the full analysis of key takeaways from IMF’s World Economic Outlook.
Don’t miss out. Become a VC+ member today.
What You Get When You Become a VC+ Member
VC+ is Visual Capitalist’s premium subscription. As a member, you’ll get the following:
- Special Dispatches: Deep dive visual briefings on crucial reports and global trends
- Markets This Month: A snappy summary of the state of the markets and what to look out for
- The Trendline: Weekly curation of the best visualizations from across the globe
- Global Forecast Series: Our flagship annual report that covers everything you need to know related to the economy, markets, geopolitics, and the latest tech trends
- VC+ Archive: Hundreds of previously released VC+ briefings and reports that you’ve been missing out on, all in one dedicated hub
You can get all of the above, and more, by joining VC+ today.

-

 Green1 week ago
Ranked: The Countries With the Most Air Pollution in 2023
-

 Automotive2 weeks ago
Almost Every EV Stock is Down After Q1 2024
-

 AI2 weeks ago
The Stock Performance of U.S. Chipmakers So Far in 2024
-

 Markets2 weeks ago
Charted: Big Four Market Share by S&P 500 Audits
-

 Real Estate2 weeks ago
Ranked: The Most Valuable Housing Markets in America
-

 Money2 weeks ago
Which States Have the Highest Minimum Wage in America?
-

 AI2 weeks ago
Ranked: Semiconductor Companies by Industry Revenue Share
-

 Travel2 weeks ago
Ranked: The World’s Top Flight Routes, by Revenue