Money
The History of Money Explained in One Infographic
The History of Money Explained in One Infographic
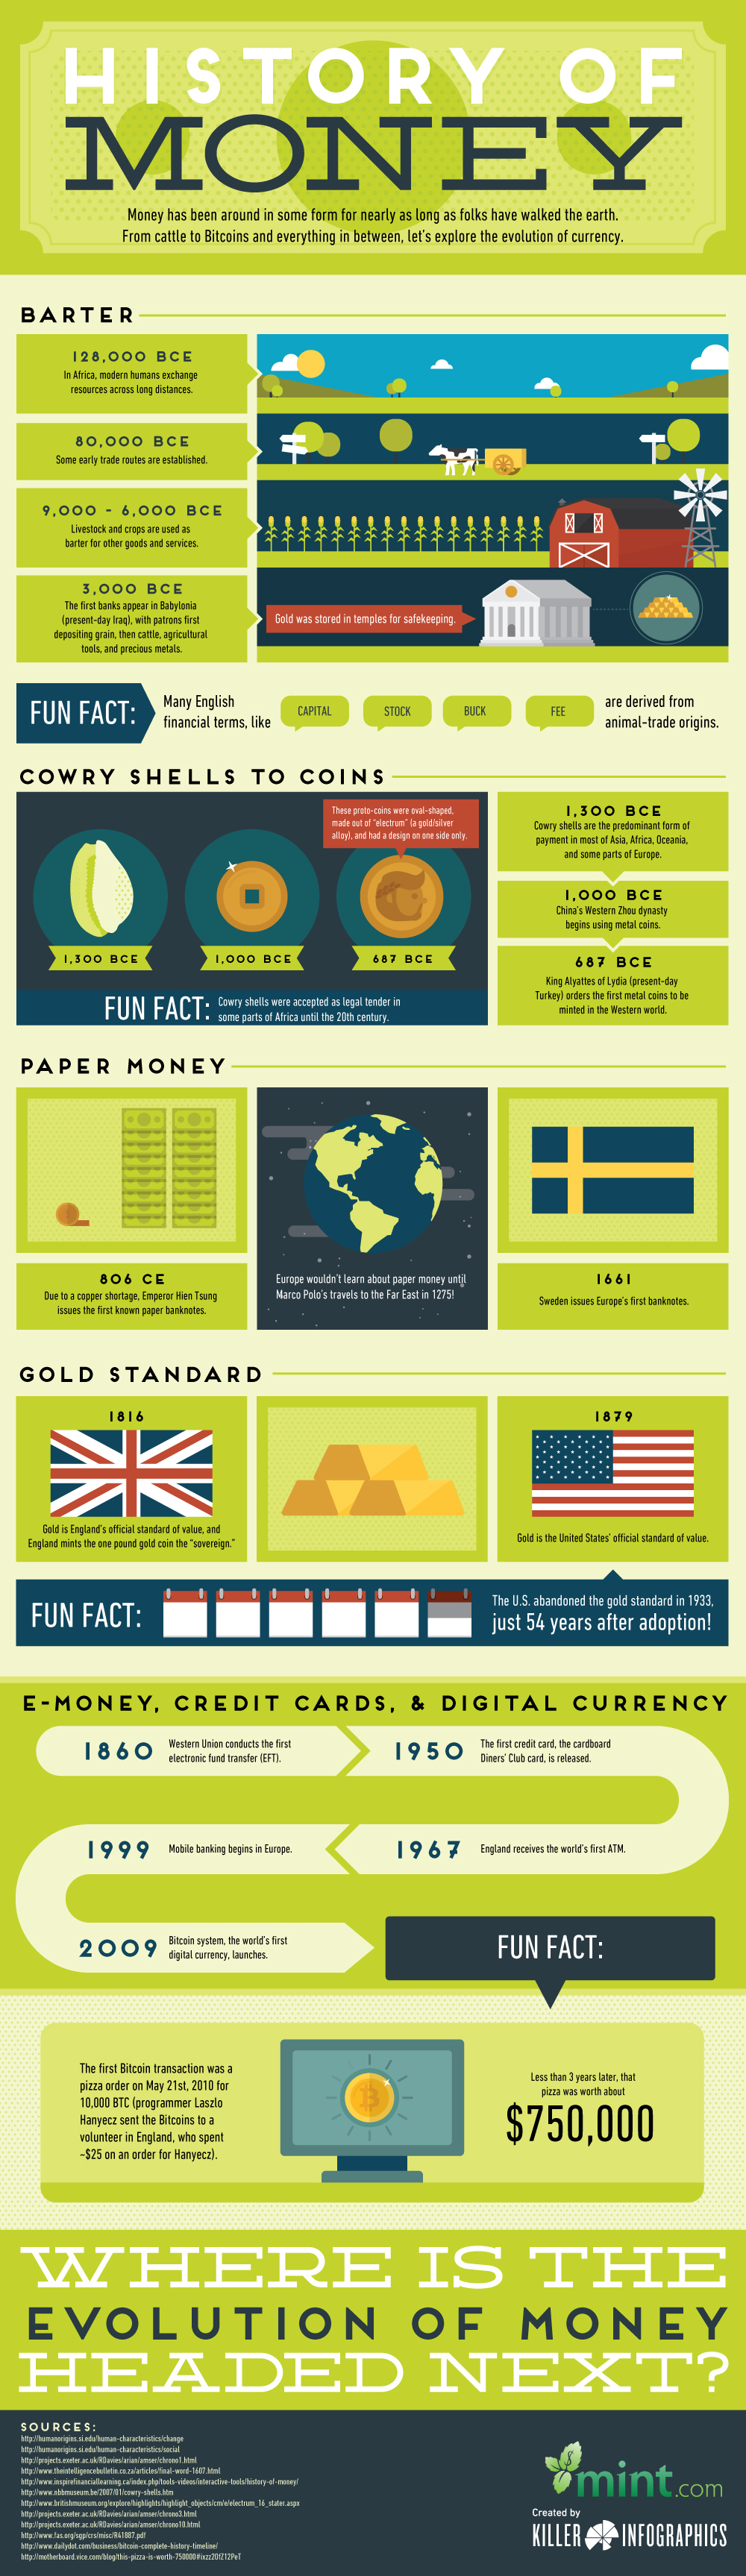
Today’s infographic from Mint.com highlights the history of money, including the many monetary experiments that have taken place since ancient times.
Some innovations have stood the test of time – precious metals, for example, have been used for thousands of years. Paper money and banknotes are also widespread in use, after first being turned to in China in 806 after a copper shortage prevented the minting of new coins.
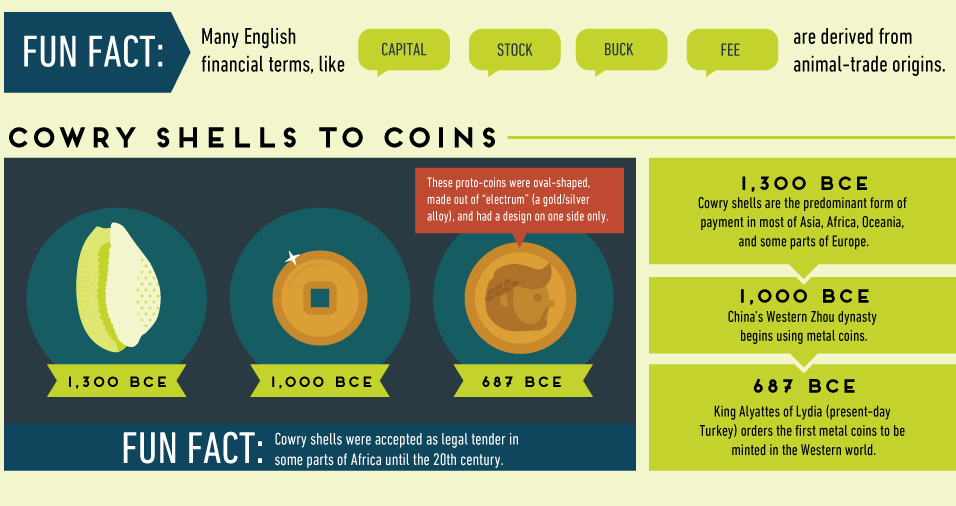
Other experiments didn’t have much staying power. The adoption of strange currencies such as squirrel pelts, cowry shells, or parmesan cheese are only remembered for their peculiarity.
Further, other attempts to stabilize the monetary system were abandoned early as well. The original U.S. gold standard lasted just 54 years, after FDR ditched it during the Great Depression. The Bretton Woods version (gold-exchange standard) lasted even shorter, abandoned after being in place for 26 years when Nixon ended all convertibility between the U.S. dollar and gold in 1971.
The Newest Chapter in Our Monetary History
Although the infographic ends with the introduction of cryptocurrency in 2009, it should be noted that the newest chapter in the history of money is taking place right before our eyes.
The “War on Cash” has been accelerating in recent years, as governments and central banks have called for the elimination of high denomination banknotes. While these anti-cash motions have also been made in many Western countries, the most vivid example of the demonetization is currently happening in India.
In November 2016, Indian Prime Minister Narendra Modi demonetized 500 and 1000 rupee notes, eliminating 86% of the country’s notes overnight. While Indians could theoretically exchange 500 and 1,000 rupee notes for higher denominations, it was only up to a limit of 4,000 rupees per person. Sums above that had to be routed through a bank account in a country where only 50% of Indians have such access.
There have been at least 112 reported deaths associated with this demonetization – including suicides and the passing of elderly people waiting in bank queues for days to exchange money. India’s largest organization of manufacturers, the All India Manufacturers Organization, also estimates in a report that micro-small scale industries suffered 35% jobs losses and a 50% dip in revenue in the first 34 days since demonetization.
While demonetization in India is off to a rough start, some believe it can still be ultimately successful in the long-term. Regardless, the “War on Cash” still has incredible global momentum – and the end result – however it turns out – will likely form another important chapter in the history of money.


Money
Charted: Who Has Savings in This Economy?
Older, better-educated adults are winning the savings game, reveals a January survey by the National Opinion Research Center at the University of Chicago.


Who Has Savings in This Economy?
This was originally posted on our Voronoi app. Download the app for free on iOS or Android and discover incredible data-driven charts from a variety of trusted sources.
Two full years of inflation have taken their toll on American households. In 2023, the country’s collective credit card debt crossed $1 trillion for the first time. So who is managing to save money in the current economic environment?
We visualize the percentage of respondents to the statement “I have money leftover at the end of the month” categorized by age and education qualifications. Data is sourced from a National Endowment for Financial Education (NEFE) report, published last month.
The survey for NEFE was conducted from January 12-14, 2024, by the National Opinion Research Center at the University of Chicago. It involved 1,222 adults aged 18+ and aimed to be representative of the U.S. population.
Older Americans Save More Than Their Younger Counterparts
General trends from this dataset indicate that as respondents get older, a higher percentage of them are able to save.
| Age | Always/Often | Sometimes | Rarely/Never |
|---|---|---|---|
| 18–29 | 29% | 33% | 38% |
| 30–44 | 36% | 27% | 37% |
| 45–59 | 39% | 23% | 38% |
| Above 60 | 49% | 28% | 23% |
| All Adults | 39% | 33% | 27% |
Note: Percentages are rounded and may not sum to 100.
Perhaps not surprisingly, those aged 60+ are the age group with the highest percentage saying they have leftover money at the end of the month. This age group spent the most time making peak earnings in their careers, are more likely to have investments, and are more likely to have paid off major expenses like a mortgage or raising a family.
The Impact of Higher Education on Earnings and Savings
Based on this survey, higher education dramatically improves one’s ability to save. Shown in the table below, those with a bachelor’s degree or higher are three times more likely to have leftover money than those without a high school diploma.
| Education | Always/Often | Sometimes | Rarely/Never |
|---|---|---|---|
| No HS Diploma | 18% | 26% | 56% |
| HS Diploma | 28% | 33% | 39% |
| Associate Degree | 33% | 31% | 36% |
| Bachelor/Higher Degree | 59% | 21% | 20% |
| All Adults | 39% | 33% | 27% |
Note: Percentages are rounded and may not sum to 100.
As the Bureau of Labor Statistics notes, earnings improve with every level of education completed.
For example, those with a high school diploma made 25% more than those without in 2022. And as the qualifications increase, the effects keep stacking.
Meanwhile, a Federal Reserve study also found that those with more education tended to make financial decisions that contributed to building wealth, of which the first step is to save.

-

 Markets1 week ago
U.S. Debt Interest Payments Reach $1 Trillion
-

 Markets2 weeks ago
Ranked: The Most Valuable Housing Markets in America
-

 Money2 weeks ago
Which States Have the Highest Minimum Wage in America?
-

 AI2 weeks ago
Ranked: Semiconductor Companies by Industry Revenue Share
-

 Markets2 weeks ago
Ranked: The World’s Top Flight Routes, by Revenue
-

 Countries2 weeks ago
Population Projections: The World’s 6 Largest Countries in 2075
-

 Markets2 weeks ago
The Top 10 States by Real GDP Growth in 2023
-

 Money2 weeks ago
The Smallest Gender Wage Gaps in OECD Countries