Misc
The Growth of Home Fitness Apps


The Growth of Home Fitness Apps
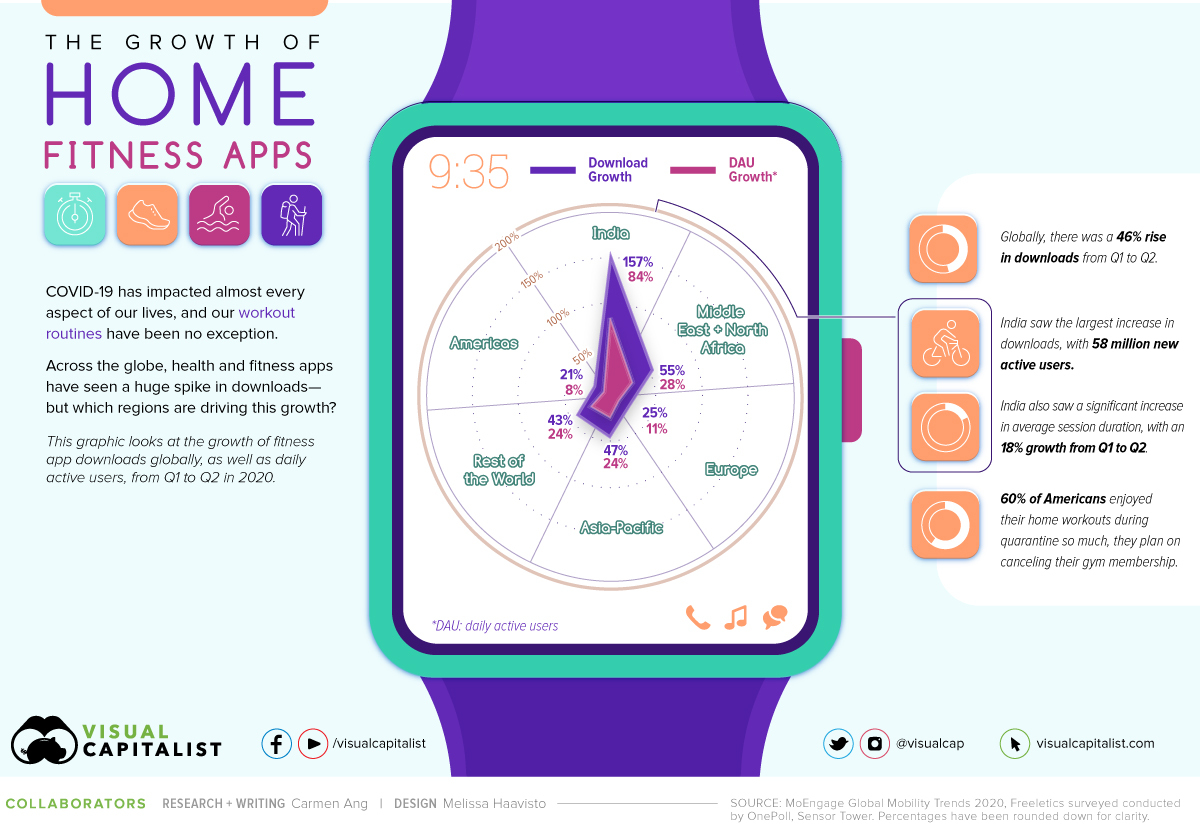
Home fitness apps have been shaping our lives—and our glutes—long before COVID-19, but their popularity has truly surged in the last few months.
Which regions are driving this growth? And is home fitness here to stay, or will it fade away when the pandemic is over?
This graphic uses data from MoEngage and Apptopia to highlight the growth in home fitness apps across five different regions, representing 1.5 billion mobile app users. Note that the report uses data from Google’s Play Store and Apple’s App Store, so China was not included.
Growth, by Number of Downloads
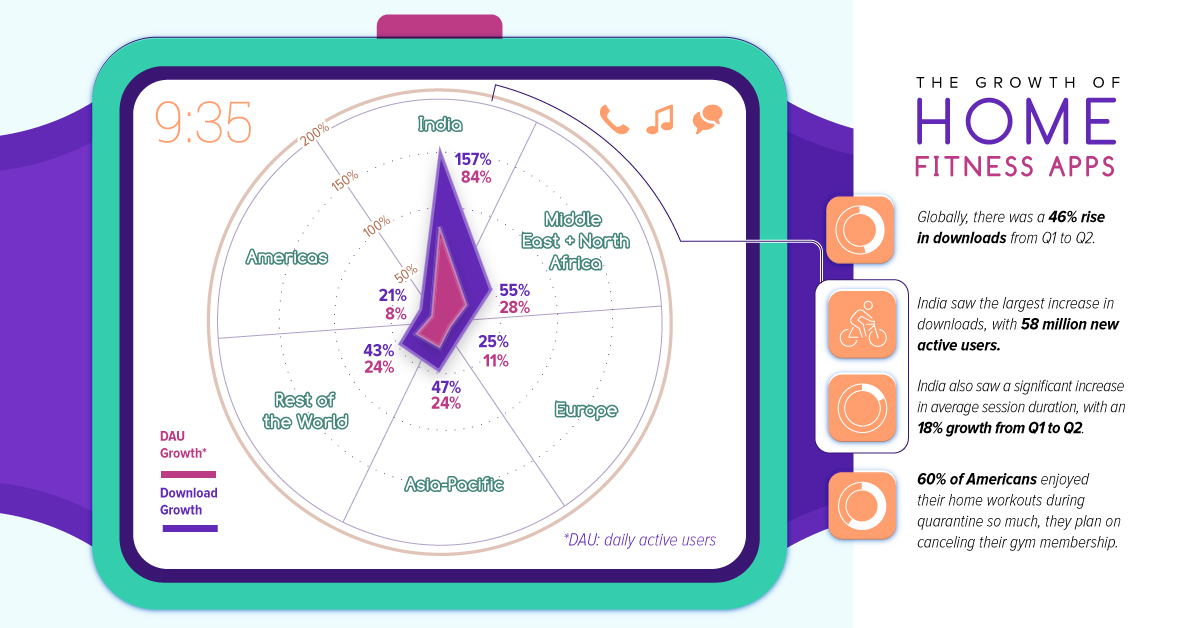
Between Q1 and Q2 2020, health and fitness app downloads grew by 46% worldwide. Here’s a look at the regional breakdown:
| Region | Download Growth |
|---|---|
| India | 157% |
| MENA | 55% |
| Europe | 25% |
| Asia-Pacific | 47% |
| Rest of the World | 43% |
| Americas | 21% |
India saw the highest increase in downloads, rising by 156%. That translates to 58 million new active users—almost the entire population of Italy.
This makes sense considering that India had the largest lockdown in the world—from March 25 to May 2020, 1.3 billion people were instructed to stay inside. That’s a lot of people who, quite suddenly, found themselves homebound.
The Middle East and North Africa (MENA) region saw the second highest growth in downloads, at a 55% increase, followed by Asia-Pacific with a 47% increase.
Growth, by Daily Active Users
Along with a surge in downloads, fitness apps also saw a rise in daily active users (DAUs). This is significant because it shows people weren’t just downloading these apps and forgetting about them—they were actually using them.
Globally, DAUs for fitness apps increased by 24% from Q1 to Q2. Here’s a look at the growth in each region:
| Region | DAU Growth |
|---|---|
| India | 84% |
| MENA | 28% |
| Europe | 11% |
| Asia-Pacific | 24% |
| Rest of the World | 24% |
| Americas | 8% |
As with downloads, India saw the largest increase in DAUs with an 84% increase, or 12 million new users. MENA saw the second-highest growth (which also aligns with downloads) at 28%.
In contrast, the Americas saw the smallest increase at just 8%—but this also may be a function of having more users to start with. Despite the lower growth rate than other regions, those who did adopt fitness apps in the Americas seemed to enjoy them, particularly in the United States.
According to a mid-year survey by OnePoll, 74% of Americans used at least one fitness app during quarantine, and 60% enjoyed their home workouts so much, they now plan on canceling their gym membership for good.
Top Grossing Health & Fitness Apps in Q2 2020
Which companies have been capitalizing on this trend? Here’s a look at the top-grossing health and fitness apps in Q2 2020, using data from Sensor Tower:
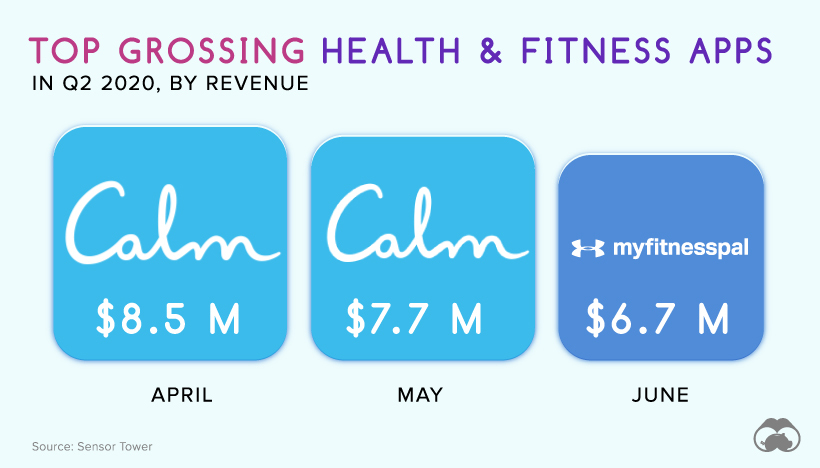
April was focused on mindfulness and meditation more than active workouts. Calm, an app for sleep, meditation, and relaxation, was the highest-grossing app at $8.5 million. Another popular mindfulness app came in second place—Headspace grossed $5.5 million. MyFitnessPal, used for tracking your diet and exercise, ranked third.
In May, meditation remained a primary focus. Calm grossed $7.7 million and kept its top spot as the highest-grossing health and fitness app, while MyFitnessPal ranked second with more than $6.5 million in gross revenue. Strava, an app with built-in GPS that tracks your workouts, came in at third place.
By June, people had shifted their focus to diet tracking and active workouts. MyFitnessPal took first place, grossing $6.7 million. Calm and Headspace came second and third, respectively.
Is Home Fitness Here to Stay?
During lockdown, gyms and fitness studios were left with no other choice than to increase their digital presence. Many started offering virtual classes, allowing members to access services from the comfort of their own homes.
Lockdown also inspired people to improve their home gyms and invest in home fitness equipment. Exercise equipment company Peloton has surged in popularity this year—it’s set to double its sales in 2020, with an estimated $1.8 billion in revenue by the end of the year.
With gyms online and fancy new equipment at home, will people maintain their lockdown workout routines even after the pandemic ends?


VC+
VC+: Get Our Key Takeaways From the IMF’s World Economic Outlook
A sneak preview of the exclusive VC+ Special Dispatch—your shortcut to understanding IMF’s World Economic Outlook report.

Have you read IMF’s latest World Economic Outlook yet? At a daunting 202 pages, we don’t blame you if it’s still on your to-do list.
But don’t worry, you don’t need to read the whole April release, because we’ve already done the hard work for you.
To save you time and effort, the Visual Capitalist team has compiled a visual analysis of everything you need to know from the report—and our upcoming VC+ Special Dispatch will be available exclusively to VC+ members on Thursday, April 25th.
If you’re not already subscribed to VC+, make sure you sign up now to receive the full analysis of the IMF report, and more (we release similar deep dives every week).
For now, here’s what VC+ members can expect to receive.
Your Shortcut to Understanding IMF’s World Economic Outlook
With long and short-term growth prospects declining for many countries around the world, this Special Dispatch offers a visual analysis of the key figures and takeaways from the IMF’s report including:
- The global decline in economic growth forecasts
- Real GDP growth and inflation forecasts for major nations in 2024
- When interest rate cuts will happen and interest rate forecasts
- How debt-to-GDP ratios have changed since 2000
- And much more!

Get the Full Breakdown in the Next VC+ Special Dispatch
VC+ members will receive the full Special Dispatch on Thursday, April 25th.
Make sure you join VC+ now to receive exclusive charts and the full analysis of key takeaways from IMF’s World Economic Outlook.
Don’t miss out. Become a VC+ member today.
What You Get When You Become a VC+ Member
VC+ is Visual Capitalist’s premium subscription. As a member, you’ll get the following:
- Special Dispatches: Deep dive visual briefings on crucial reports and global trends
- Markets This Month: A snappy summary of the state of the markets and what to look out for
- The Trendline: Weekly curation of the best visualizations from across the globe
- Global Forecast Series: Our flagship annual report that covers everything you need to know related to the economy, markets, geopolitics, and the latest tech trends
- VC+ Archive: Hundreds of previously released VC+ briefings and reports that you’ve been missing out on, all in one dedicated hub
You can get all of the above, and more, by joining VC+ today.

-

 Green1 week ago
Ranked: The Countries With the Most Air Pollution in 2023
-

 Automotive2 weeks ago
Almost Every EV Stock is Down After Q1 2024
-

 AI2 weeks ago
The Stock Performance of U.S. Chipmakers So Far in 2024
-

 Markets2 weeks ago
Charted: Big Four Market Share by S&P 500 Audits
-

 Real Estate2 weeks ago
Ranked: The Most Valuable Housing Markets in America
-

 Money2 weeks ago
Which States Have the Highest Minimum Wage in America?
-

 AI2 weeks ago
Ranked: Semiconductor Companies by Industry Revenue Share
-

 Travel2 weeks ago
Ranked: The World’s Top Flight Routes, by Revenue