Sponsored
The Evolution of Higher Education: 5 Global Trends To Watch
Presented by:
Higher education has gone through tremendous change during the COVID-19 pandemic.
In the face of uncertainty, it’s become evident that institutions with prior investment in digital technologies are emerging more agile and resilient. For example, online communities have helped 30% of students feel more connected with other students during this time.
Below we look at key data from the Global Higher Education Research Snapshot from Salesforce.org—in partnership with market research firm Ipsos—which reflects the new attitudes and priorities of 2,200 students and higher education staff worldwide.
To understand the shifting landscape across higher education, the survey explores five key trends: connection, trust, wellbeing, flexibility, and career.
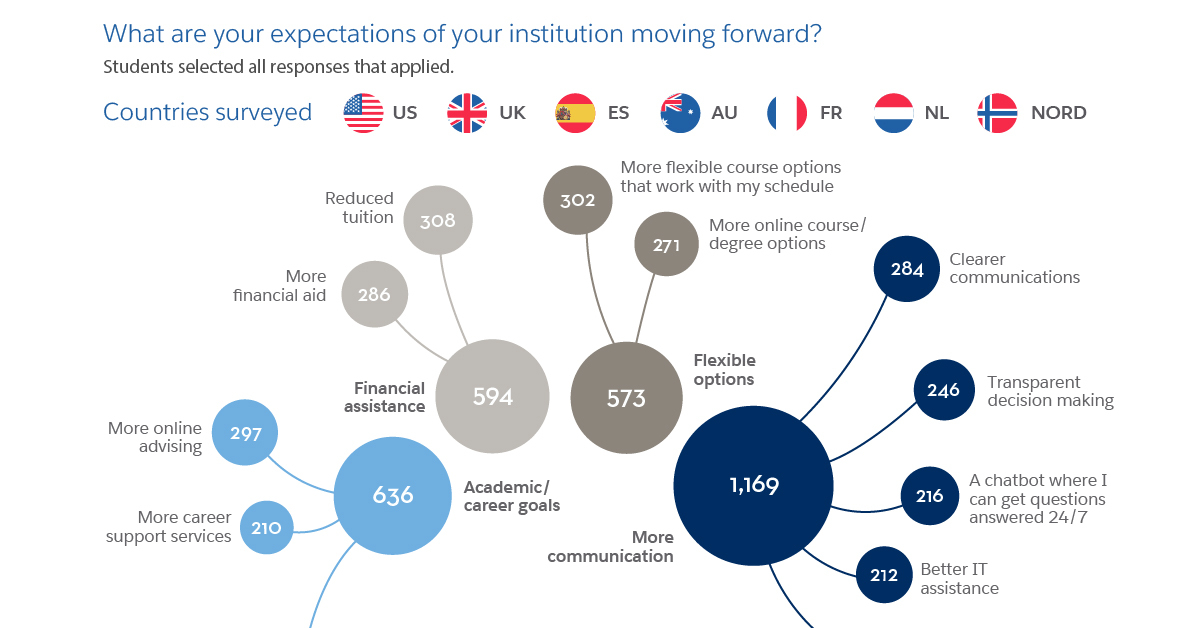
1. Communications Help Students Feel Connected
In a typically isolating time, 75% of students wanted to receive weekly (or even more frequent) pandemic-related updates.
Why? These consistent communications from institutions actually help students feel more close and connected than in previous years.
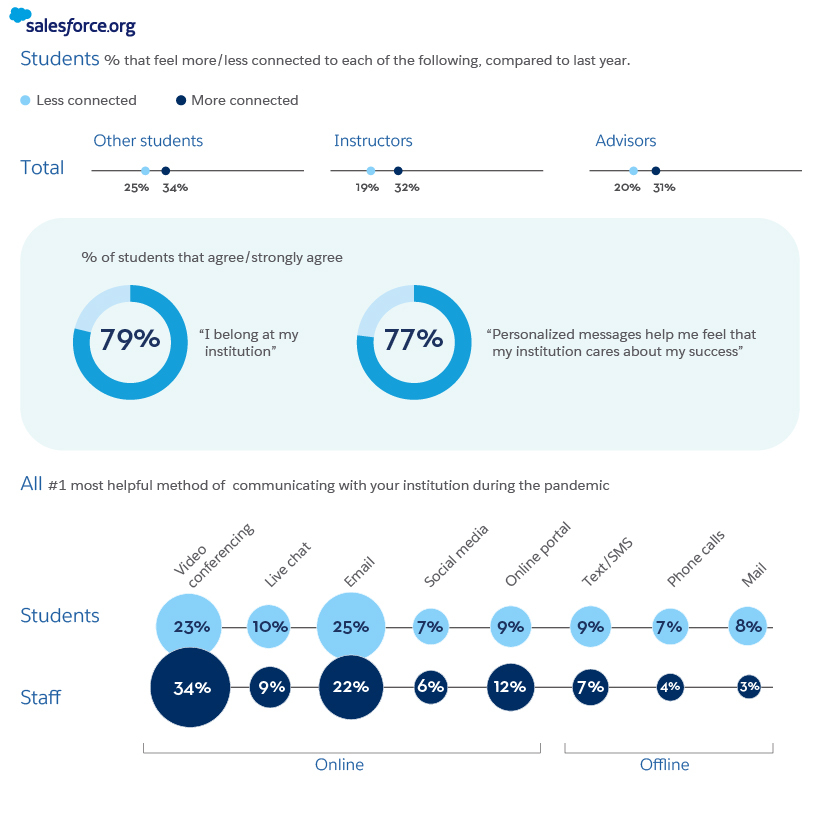
This valuable sense of belonging is increasingly happening through online communities and other digital channels, but institutions have significant room left to grow in this area.
2. Has The Pandemic Fractured Trust?
The pandemic has worsened existing trust gaps that exist between university leadership, students, and staff. Part of this may be due to a lack of resources provided during imposed COVID-19 restrictions.
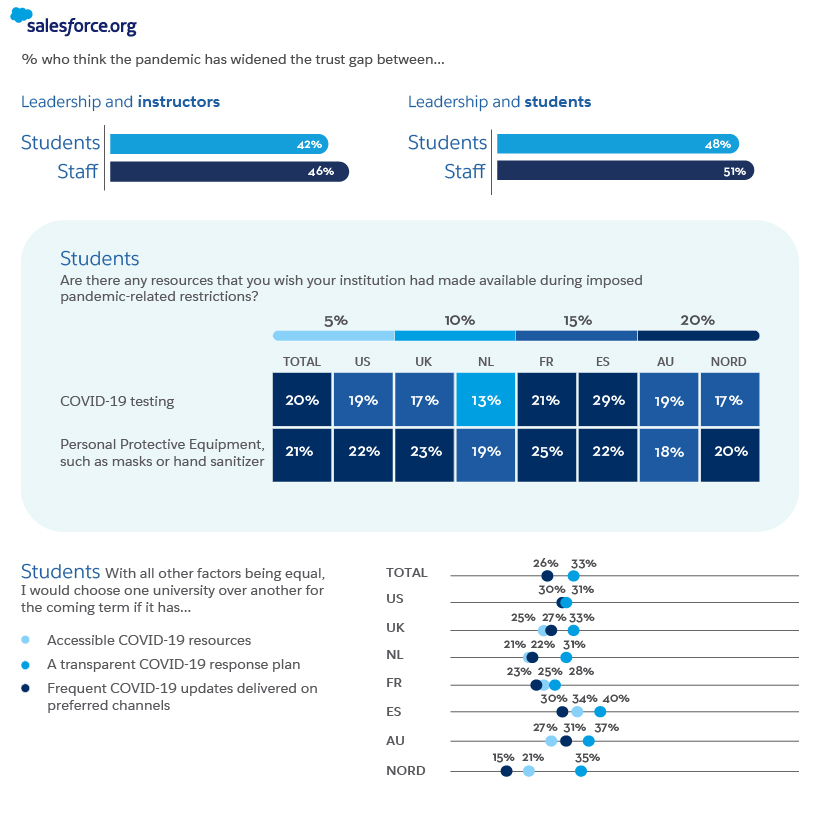
From personal protective equipment such as masks/hand sanitizer to transparent COVID-19 response plans, students also expect a myriad of resources from their universities to help put them at ease.
3. Juggling Wellbeing Concerns
Months of lockdowns and persistent social distancing have understandably shaken up students’ university experiences.
This is further compounded by various well-being challenges, from financial anxieties to juggling familial responsibilities.
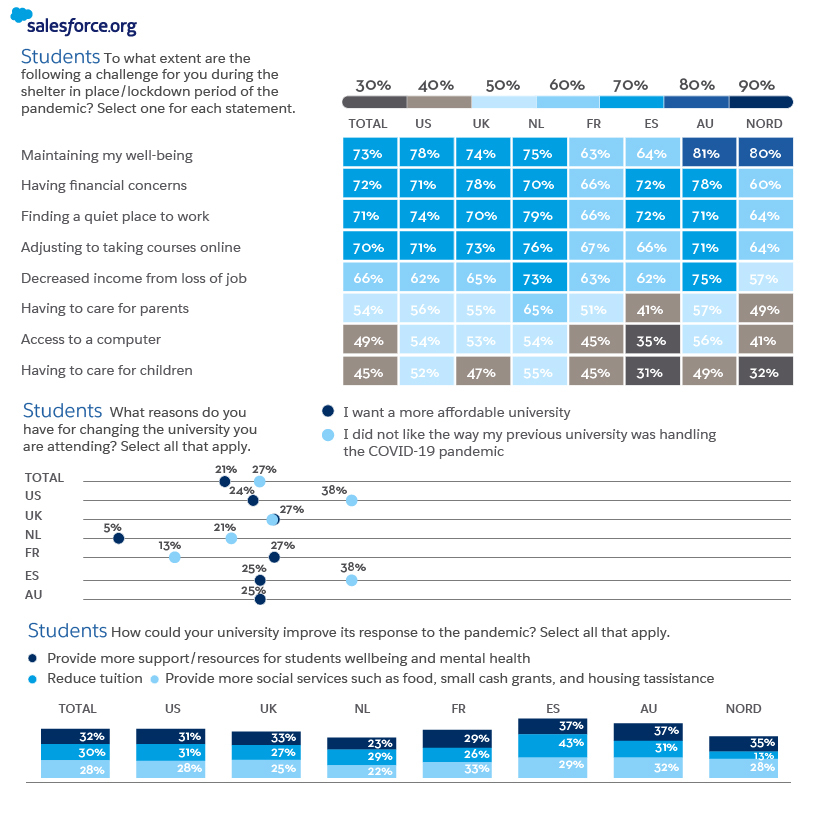
On the bright side, such demand creates an opportunity for institutions to provide more tailored well-being support through digital-first channels.
4. Students Are Drawn to Online Learning
As the pandemic seemingly creates new challenges by the day, many students are seeking more flexible options for when and how they learn.
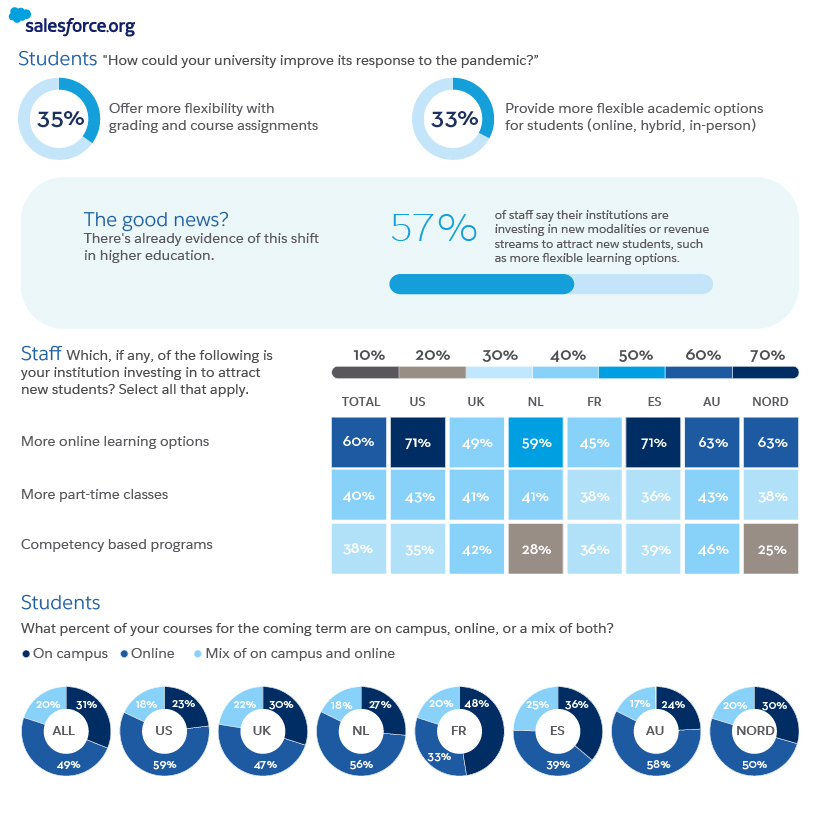
The good news? There’s already evidence of this shift. Over half (57%) of staff say their institutions are investing in new modalities or revenue streams to attract new students, including more flexible learning options.
5. Uncertainties Remain Around Future Plans
Economic changes are causing over half (51%) of students to reconsider their education plans. In addition, of the staff that expect to see an increase in adult learners’ enrollment, a majority believe it will come from pandemic-influenced needs to reskill or upskill in this climate.
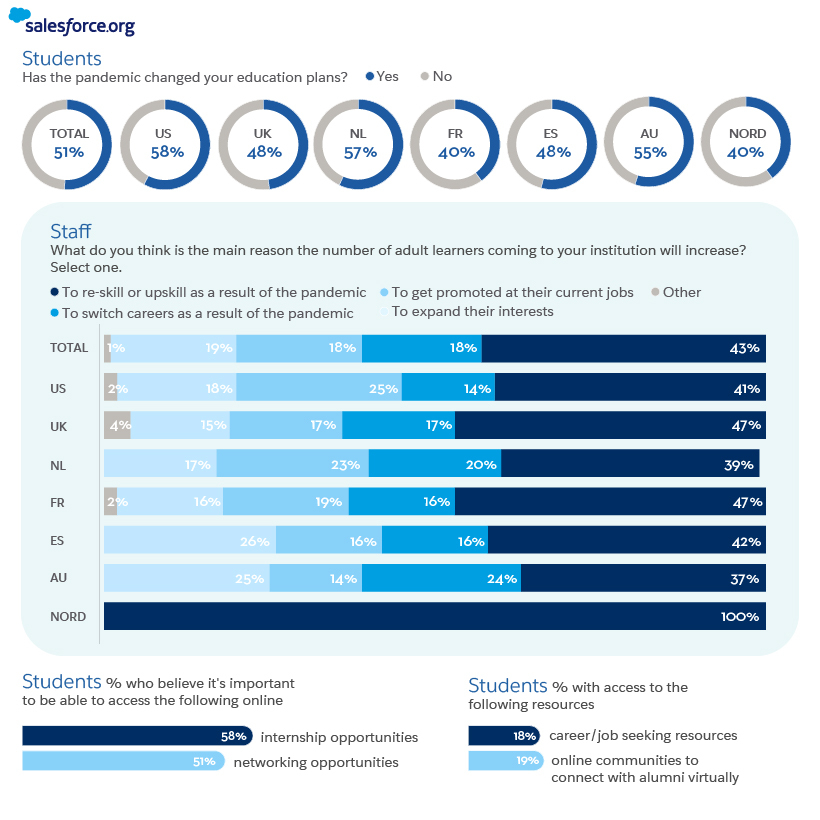
This uncertainty also affects students’ future plans—60% are concerned about finding employment after graduation. They want to be set up for career success in all areas, yet only a handful of them have the appropriate resources available.
How The Trends Intersect
These above trends aren’t disparate to the student and staff experience. Rather, they are intricately linked with one another, as the following question illustrates.
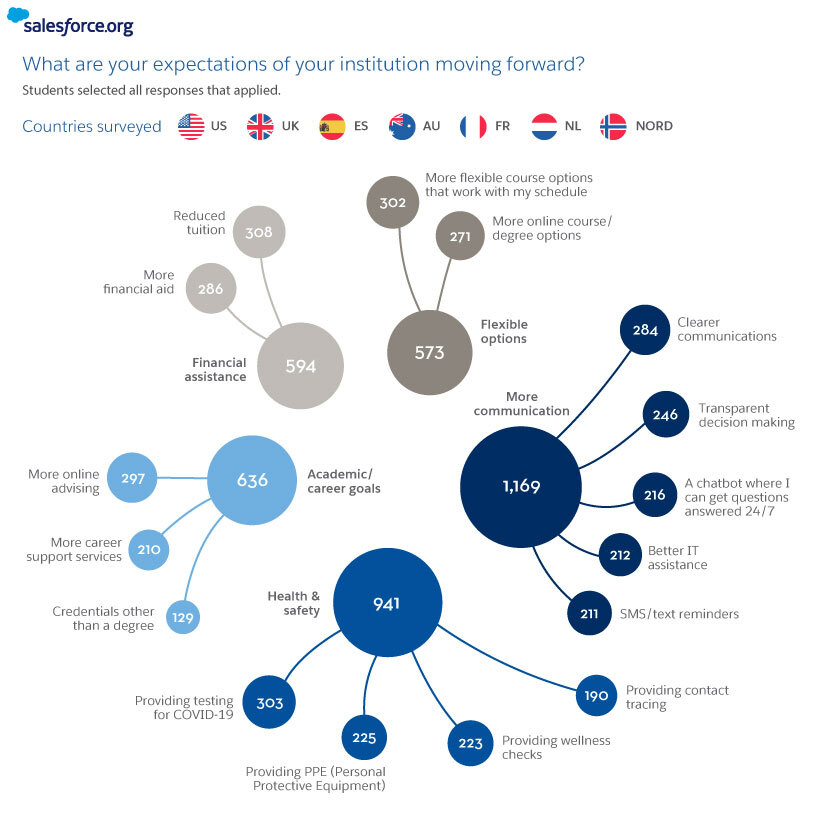
The pandemic has reshaped expectations of higher education—but it’s also created an opportunity for institutions to accelerate their digital transformation.
By providing more wellbeing resources, career support, and flexibility, universities can drive trust and support their students’ needs in the new normal.
Want more details?
Visit Salesforce.org’s Global Higher Education Research Snapshot to learn more.
Sponsored
Ranked: Emissions per Capita of the Top 30 U.S. Investor-Owned Utilities
Roughly 25% of all GHG emissions come from electricity production. See how the top 30 IOUs rank by emissions per capita.

Emissions per Capita of the Top 30 U.S. Investor-Owned Utilities
Approximately 25% of all U.S. greenhouse gas emissions (GHG) come from electricity generation.
Subsequently, this means investor-owned utilities (IOUs) will have a crucial role to play around carbon reduction initiatives. This is particularly true for the top 30 IOUs, where almost 75% of utility customers get their electricity from.
This infographic from the National Public Utilities Council ranks the largest IOUs by emissions per capita. By accounting for the varying customer bases they serve, we get a more accurate look at their green energy practices. Here’s how they line up.
Per Capita Rankings
The emissions per capita rankings for the top 30 investor-owned utilities have large disparities from one another.
Totals range from a high of 25.8 tons of CO2 per customer annually to a low of 0.5 tons.
Utility | Emissions Per Capita (CO2 tons per year) | Total Emissions (M) |
---|---|---|
TransAlta | 25.8 | 16.3 |
Vistra | 22.4 | 97.0 |
OGE Energy | 21.5 | 18.2 |
AES Corporation | 19.8 | 49.9 |
Southern Company | 18.0 | 77.8 |
Evergy | 14.6 | 23.6 |
Alliant Energy | 14.4 | 14.1 |
DTE Energy | 14.2 | 29.0 |
Berkshire Hathaway Energy | 14.0 | 57.2 |
Entergy | 13.8 | 40.5 |
WEC Energy | 13.5 | 22.2 |
Ameren | 12.8 | 31.6 |
Duke Energy | 12.0 | 96.6 |
Xcel Energy | 11.9 | 43.3 |
Dominion Energy | 11.0 | 37.8 |
Emera | 11.0 | 16.6 |
PNM Resources | 10.5 | 5.6 |
PPL Corporation | 10.4 | 28.7 |
American Electric Power | 9.2 | 50.9 |
Consumers Energy | 8.7 | 16.1 |
NRG Energy | 8.2 | 29.8 |
Florida Power and Light | 8.0 | 41.0 |
Portland General Electric | 7.6 | 6.9 |
Fortis Inc. | 6.1 | 12.6 |
Avangrid | 5.1 | 11.6 |
PSEG | 3.9 | 9.0 |
Exelon | 3.8 | 34.0 |
Consolidated Edison | 1.6 | 6.3 |
Pacific Gas and Electric | 0.5 | 2.6 |
Next Era Energy Resources | 0 | 1.1 |
PNM Resources data is from 2019, all other data is as of 2020
Let’s start by looking at the higher scoring IOUs.
TransAlta
TransAlta emits 25.8 tons of CO2 emissions per customer, the largest of any utility on a per capita basis. Altogether, the company’s 630,000 customers emit 16.3 million metric tons. On a recent earnings call, its management discussed clear intent to phase out coal and grow their renewables mix by doubling their renewables fleet. And so far it appears they’ve been making good on their promise, having shut down the Canadian Highvale coal mine recently.
Vistra
Vistra had the highest total emissions at 97 million tons of CO2 per year and is almost exclusively a coal and gas generator. However, the company announced plans for 60% reductions in CO2 emissions by 2030 and is striving to be carbon neutral by 2050. As the highest total emitter, this transition would make a noticeable impact on total utility emissions if successful.
Currently, based on their 4.3 million customers, Vistra sees per capita emissions of 22.4 tons a year. The utility is a key electricity provider for Texas, ad here’s how their electricity mix compares to that of the state as a whole:
Energy Source | Vistra | State of Texas |
---|---|---|
Gas | 63% | 52% |
Coal | 29% | 15% |
Nuclear | 6% | 9% |
Renewables | 1% | 24% |
Oil | 1% | 0% |
Despite their ambitious green energy pledges, for now only 1% of Vistra’s electricity comes from renewables compared to 24% for Texas, where wind energy is prospering.
Based on those scores, the average customer from some of the highest emitting utility groups emit about the same as a customer from each of the bottom seven, who clearly have greener energy practices. Let’s take a closer look at emissions for some of the bottom scoring entities.
Utilities With The Greenest Energy Practices
Groups with the lowest carbon emission scores are in many ways leaders on the path towards a greener future.
Exelon
Exelon emits only 3.8 tons of CO2 emissions per capita annually and is one of the top clean power generators across the Americas. In the last decade they’ve reduced their GHG emissions by 18 million metric tons, and have recently teamed up with the state of Illinois through the Clean Energy Jobs Act. Through this, Exelon will receive $700 million in subsidies as it phases out coal and gas plants to meet 2030 and 2045 targets.
Consolidated Edison
Consolidated Edison serves nearly 4 million customers with a large chunk coming from New York state. Altogether, they emit 1.6 tons of CO2 emissions per capita from their electricity generation.
The utility group is making notable strides towards a sustainable future by expanding its renewable projects and testing higher capacity limits. In addition, they are often praised for their financial management and carry the title of dividend aristocrat, having increased their dividend for 47 years and counting. In fact, this is the longest out of any utility company in the S&P 500.
A Sustainable Tomorrow
Altogether, utilities will have a pivotal role to play in decarbonization efforts. This is particularly true for the top 30 U.S. IOUs, who serve millions of Americans.
Ultimately, this means a unique moment for utilities is emerging. As the transition toward cleaner energy continues and various groups push to achieve their goals, all eyes will be on utilities to deliver.
The National Public Utilities Council is the go-to resource to learn how utilities can lead in the path towards decarbonization.
Sponsored
The Road to Decarbonization: How Asphalt is Affecting the Planet
The U.S. alone generates ∼12 million tons of asphalt shingles tear-off waste and installation scrap every year and more than 90% of it is dumped into landfills.

The Road to Decarbonization: How Asphalt is Affecting the Planet
Asphalt, also known as bitumen, has various applications in the modern economy, with annual demand reaching 110 million tons globally.
Until the 20th century, natural asphalt made from decomposed plants accounted for the majority of asphalt production. Today, most asphalt is refined from crude oil.
This graphic, sponsored by Northstar Clean Technologies, shows how new technologies to reuse and recycle asphalt can help protect the environment.
The Impact of Climate Change
Pollution from vehicles is expected to decline as electric vehicles replace internal combustion engines.
But pollution from asphalt could actually increase in the next decades because of rising temperatures in some parts of the Earth. When subjected to extreme temperatures, asphalt releases harmful greenhouse gases (GHG) into the atmosphere.
Emissions from Road Construction (Source) | CO2 equivalent (%) |
---|---|
Asphalt | 28% |
Concrete | 18% |
Excavators and Haulers | 16% |
Trucks | 13% |
Crushing Plant | 10% |
Galvanized Steel | 6% |
Reinforced Steel | 6% |
Plastic Piping | 2% |
Geotextile | 1% |
Asphalt paved surfaces and roofs make up approximately 45% and 20% of surfaces in U.S. cities, respectively. Furthermore, 75% of single-family detached homes in Canada and the U.S. have asphalt shingles on their roofs.
Reducing the Environmental Impact of Asphalt
Similar to roads, asphalt shingles have oil as the primary component, which is especially harmful to the environment.
Shingles do not decompose or biodegrade. The U.S. alone generates ∼12 million tons of asphalt shingles tear-off waste and installation scrap every year and more than 90% of it is dumped into landfills, the equivalent of 20 million barrels of oil.
But most of it can be reused, rather than taking up valuable landfill space.
Using technology, the primary components in shingles can be repurposed into liquid asphalt, aggregate, and fiber, for use in road construction, embankments, and new shingles.
Providing the construction industry with clean, sustainable processing solutions is also a big business opportunity. Canada alone is a $1.3 billion market for recovering and reprocessing shingles.
Northstar Clean Technologies is the only public company that repurposes 99% of asphalt shingles components that otherwise go to landfills.
-
Misc6 days ago
The Top 10 Largest Nuclear Explosions, Visualized
-
Technology3 weeks ago
How Do Big Tech Giants Make Their Billions?
-
Markets4 weeks ago
Satellite Maps: Shanghai’s Supply Chain Standstill
-
Energy2 weeks ago
Mapped: Solar and Wind Power by Country
-
Datastream3 weeks ago
Visualizing Companies with the Most Patents Granted in 2021
-
Technology1 week ago
Synthetic Biology: The $3.6 Trillion Science Changing Life as We Know It
-
Markets3 weeks ago
Why Investors Tuned Out Netflix
-
Automotive3 weeks ago
Timeline: The Rise, Fall, and Return of the Hummer