Economy
The Economics of Coffee in One Chart
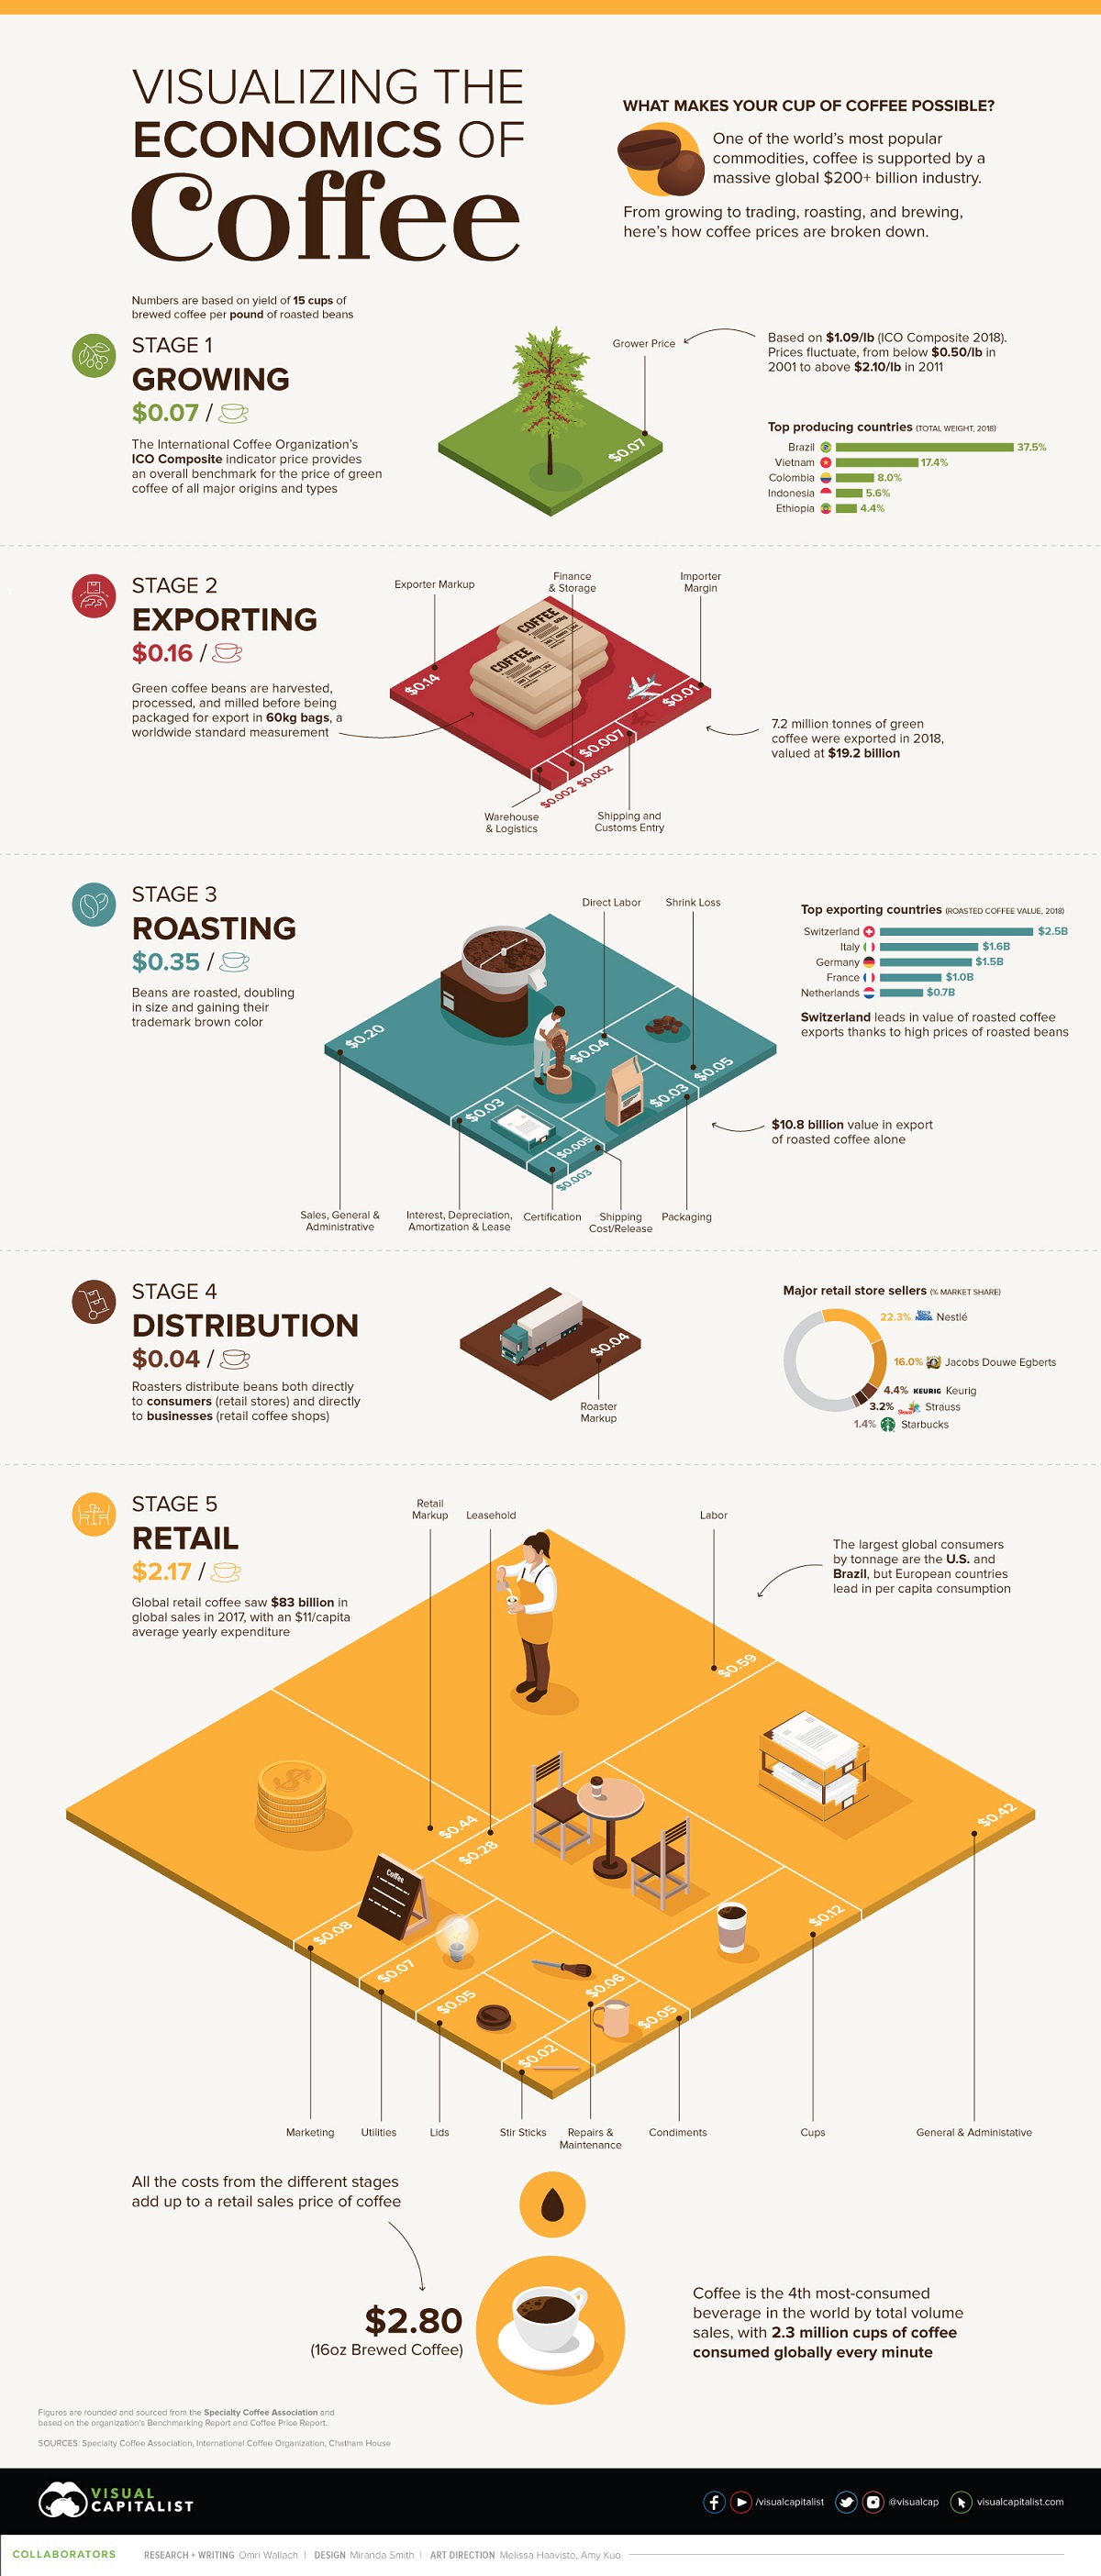


Breaking Down the Economics of Coffee
What goes into your morning cup of coffee, and what makes it possible?
The obvious answer might be coffee beans, but when you start to account for additional costs, the scope of a massive $200+ billion coffee supply chain becomes clear.
From the labor of growing, exporting, and roasting the coffee plants to the materials like packaging, cups, and even stir sticks, there are many underlying costs that factor into every cup of coffee consumed.
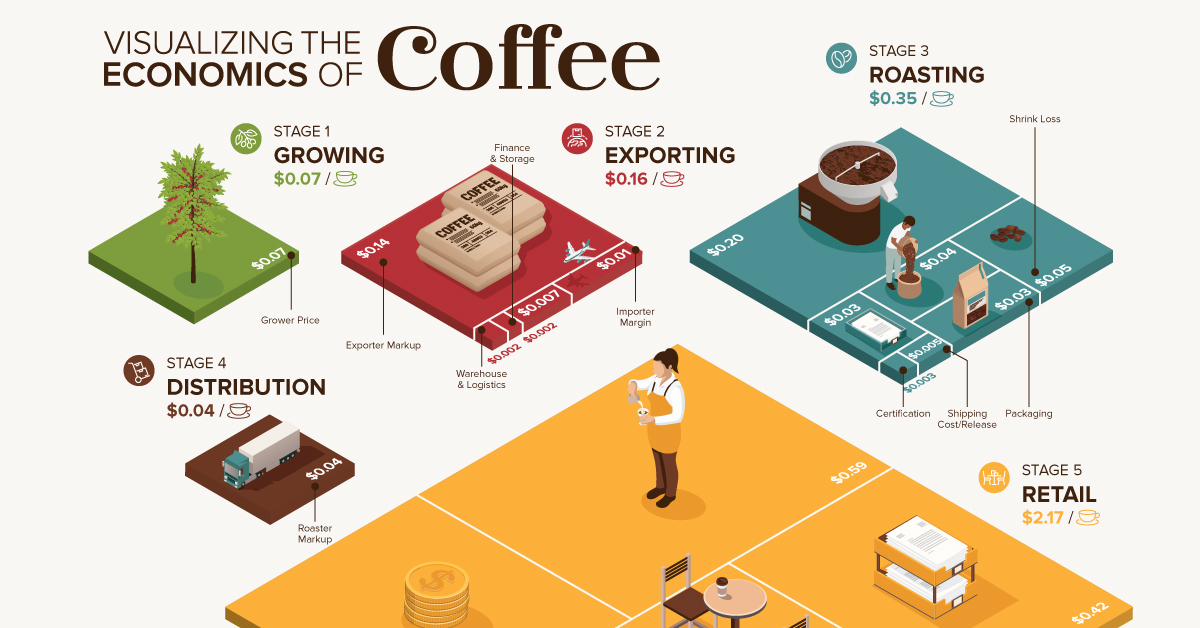
The above graphic breaks down the costs incurred by retail coffee production for one pound of coffee, equivalent to about 15 cups of 16 ounce brewed coffee.
The Difficulty of Pricing Coffee
Measuring and averaging out a global industry is a complicated ordeal.
Not only do global coffee prices constantly fluctuate, but each country also has differences in availability, relative costs, and the final price of a finished product.
That’s why a cup of 16 oz brewed coffee in the U.S. doesn’t cost the same in the U.K., or Japan, or anywhere else in the world. Even within countries, the differences of a company’s access to wholesale beans will dictate the final price.
To counteract these discrepancies, today’s infographic above uses figures sourced from the Specialty Coffee Association which are illustrative but based on the organization’s Benchmarking Report and Coffee Price Report.
What they end up with is an estimated set price of $2.80 for a brewed cup of coffee at a specialty coffee store. Each store and indeed each country will see a different price, but that gives us the foundation to start backtracking and breaking down the total costs.
From Growing Beans to Exporting Bags
To make coffee, you must have the right conditions to grow it.
The two major types of coffee, Arabica and Robusta, are produced primarily in subequatorial countries. The plants originated in Ethiopia, were first grown in Yemen in the 1600s, then spread around the world by way of European colonialism.
Today, Brazil is far and away the largest producer and exporter of coffee, with Vietnam the only other country accounting for a double-digit percentage of global production.
| Country | Coffee Production (60kg bags) | Share of Global Coffee Production |
|---|---|---|
| Brazil | 64,875,000 | 37.5% |
| Vietnam | 30,024,000 | 17.4% |
| Colombia | 13,858,000 | 8.0% |
| Indonesia | 9,618,000 | 5.6% |
| Ethiopia | 7,541,000 | 4.4% |
| Honduras | 7,328,000 | 4.2% |
| India | 6,002,000 | 3.5% |
| Uganda | 4,704,000 | 2.7% |
| Peru | 4,263,000 | 2.5% |
| Other | 24,629,000 | 14.2% |
How much money do growers make on green coffee beans? With prices constantly fluctuating each year, they can range from below $0.50/lb in 2001 to above $2.10/lb in 2011.
But if you’re looking for the money in coffee, you won’t find it at the source. Fairtrade estimates that 125 million people worldwide depend on coffee for their livelihoods, but many of them are unable to earn a reliable living from it.
Instead, one of the biggest profit margins is made by the companies exporting the coffee. In 2018 the ICO Composite price (which tracks both Arabica and Robusta coffee prices) averaged $1.09/lb, while the SCA lists exporters as charging a price of $3.24/lb for green coffee.
Roasting Economics
Roasters might be charged $3.24/lb for green coffee beans from exporters, but that’s far from the final price they pay.
First, beans have to be imported, adding shipping and importer fees that add $0.31/lb. Once the actual roasting begins, the cost of labor and certification and the inevitable losses along the way add an additional $1.86/lb before general business expenses.
By the end of it, roasters see a total illustrated cost of $8.73/lb.
| Roaster Economics | ($/lb) |
|---|---|
| Sales Price | $9.40 |
| Total Cost | $8.73 |
| Pre-tax Profit | $0.67 |
| Taxes | $0.23 |
| Net Profit | $0.44 |
| Net Profit (%) | 7.1% |
When it comes time for their profit margin, roasters quote a selling price of around $9.40/lb. After taxes, roasters see a net profit of roughly $0.44/lb or 7.1%.
Retail Margins
For consumers purchasing quality, roasted coffee beans directly through distributors, seeing a 1lb bag of roasted whole coffee for $14.99 and higher is standard. Retailers, however, are able to access coffee closer to the stated wholesale prices and add their own costs to the equation.
One pound of roasted coffee beans will translate into about 15 cups of 16 ounce (475 ml) brewed coffee for a store. At a price of $2.80/cup, that translates into a yield of $42.00/lb of coffee.
That doesn’t sound half bad until you start to factor in the costs. Material costs include the coffee itself, the cups and lids (often charged separately), the stir sticks and even the condiments. After all, containers of half-and-half and ground cinnamon don’t pay for themselves.
Factoring them all together equals a retail material cost of $13.00/lb. That still leaves a healthy gross profit of $29.00/lb, but running a retail store is an expensive business. Add to that the costs of operations, including labor, leasing, marketing, and administrative costs, and the total costs quickly ramp up to $35.47/lb.
In fact, when accounting for additional costs for interest and taxes, the SCA figures give retailers a net profit of $2.90/lb or 6.9%, slightly less than that of roasters.
A Massive Global Industry
Coffee production is a big industry for one reason: coffee consumption is truly a universal affair with 2.3 million cups of coffee consumed globally every minute. By total volume sales, coffee is the fourth most-consumed beverage in the world.
That makes the retail side of the market a major factor. Dominated by companies like Nestlé and Jacobs Douwe Egberts, global retail coffee sales in 2017 reached $83 billion, with an average yearly expenditure of $11 per capita globally.
Of course, some countries are bigger coffee drinkers than others. The largest global consumers by tonnage are the U.S. and Brazil (despite also being the largest producer and exporter), but per capita consumption is significantly higher in European countries like Norway and Switzerland.
The next time you sip your coffee, consider the multilayered and vast global supply chain that makes it all possible.


Copper
Brass Rods: The Secure Choice
This graphic shows why brass rods are the secure choice for precision-machined and forged parts.


Brass Rods: The Secure Choice
The unique combination of machinability and recyclability makes brass rods the secure choice for manufacturers seeking future-proof raw material solutions.
This infographic, from the Copper Development Association, shows three ways brass rods give manufacturers greater control and a license to grow in the competitive market for precision-machined and forged products.
Future-Proof Investments in New Machine Tools
A material’s machinability directly impacts machine throughput, which typically has the largest impact on machine shop profitability.
The high-speed machining capabilities of brass rods maximize machine tool performance, allowing manufacturers to run the material faster and longer without sacrificing tool life, chip formation, or surface quality.
The high machining efficiency of brass leads to reduced per-part costs, quicker return on investment (ROI) for new machine tools, and expanded production capacity for new projects.
Supply Security Through Closed Loop Recycling
Brass, like its parent element copper, can be infinitely recycled.
In 2022, brass- and wire-rod mills accounted for the majority of the 830,000 tonnes of copper recycled from scrap in the United States.
Given that scrap ratios for machined parts typically range from 60-70% by weight, producing mills benefit from a secure and steady supply of clean scrap returned directly from customers, which is recycled to create new brass rods.
The high residual value of brass scrap creates a strong recycling incentive. Scrap buy back programs give manufacturers greater control over raw material net costs as scrap value is often factored into supplier purchase agreements.
Next Generation Alloys for a Lead-Free Future
Increasingly stringent global regulations continue to pressure manufacturers to minimize the use of materials containing trace amounts of lead and other harmful impurities.
The latest generation of brass-rod alloys is engineered to meet the most demanding criteria for lead leaching in drinking water and other sensitive applications.
Seven brass-rod alloys passed rigorous testing to become the only ‘Acceptable Materials’ against lower lead leaching criteria recently adopted in the national U.S. drinking water quality standard, NSF 61.
Learn more about the advantages of brass rods solutions.

-

 Base Metals1 year ago
Ranked: The World’s Largest Copper Producers
Many new technologies critical to the energy transition rely on copper. Here are the world’s largest copper producers.
-

 Silver2 years ago
Mapped: Solar Power by Country in 2021
In 2020, solar power saw its largest-ever annual capacity expansion at 127 gigawatts. Here’s a snapshot of solar power capacity by country.
-

 Batteries5 years ago
Visualizing Copper’s Role in the Transition to Clean Energy
A clean energy transition is underway as wind, solar, and batteries take center stage. Here’s how copper plays the critical role in these technologies.
-

 Science5 years ago
Everything You Need to Know on VMS Deposits
Deep below the ocean’s waves, VMS deposits spew out massive amounts of minerals like copper, zinc, and gold, making them a key source of the metals…
-
 Copper5 years ago
How Much Copper is in an Electric Vehicle?
Have you ever wondered how much copper is in an electric vehicle? This infographic shows the metal’s properties as well as the quantity of copper used.
-
 Copper6 years ago
Copper: Driving the Green Energy Revolution
Renewable energy is set to fuel a new era of copper demand – here’s how much copper is used in green applications from EVs to photovoltaics.


-

 Real Estate2 weeks ago
Visualizing America’s Shortage of Affordable Homes
-

 Technology1 week ago
Ranked: Semiconductor Companies by Industry Revenue Share
-

 Money1 week ago
Which States Have the Highest Minimum Wage in America?
-

 Real Estate1 week ago
Ranked: The Most Valuable Housing Markets in America
-

 Business2 weeks ago
Charted: Big Four Market Share by S&P 500 Audits
-

 AI2 weeks ago
The Stock Performance of U.S. Chipmakers So Far in 2024
-

 Misc2 weeks ago
Almost Every EV Stock is Down After Q1 2024
-

 Money2 weeks ago
Where Does One U.S. Tax Dollar Go?