Economy
The Economics of Coffee in One Chart
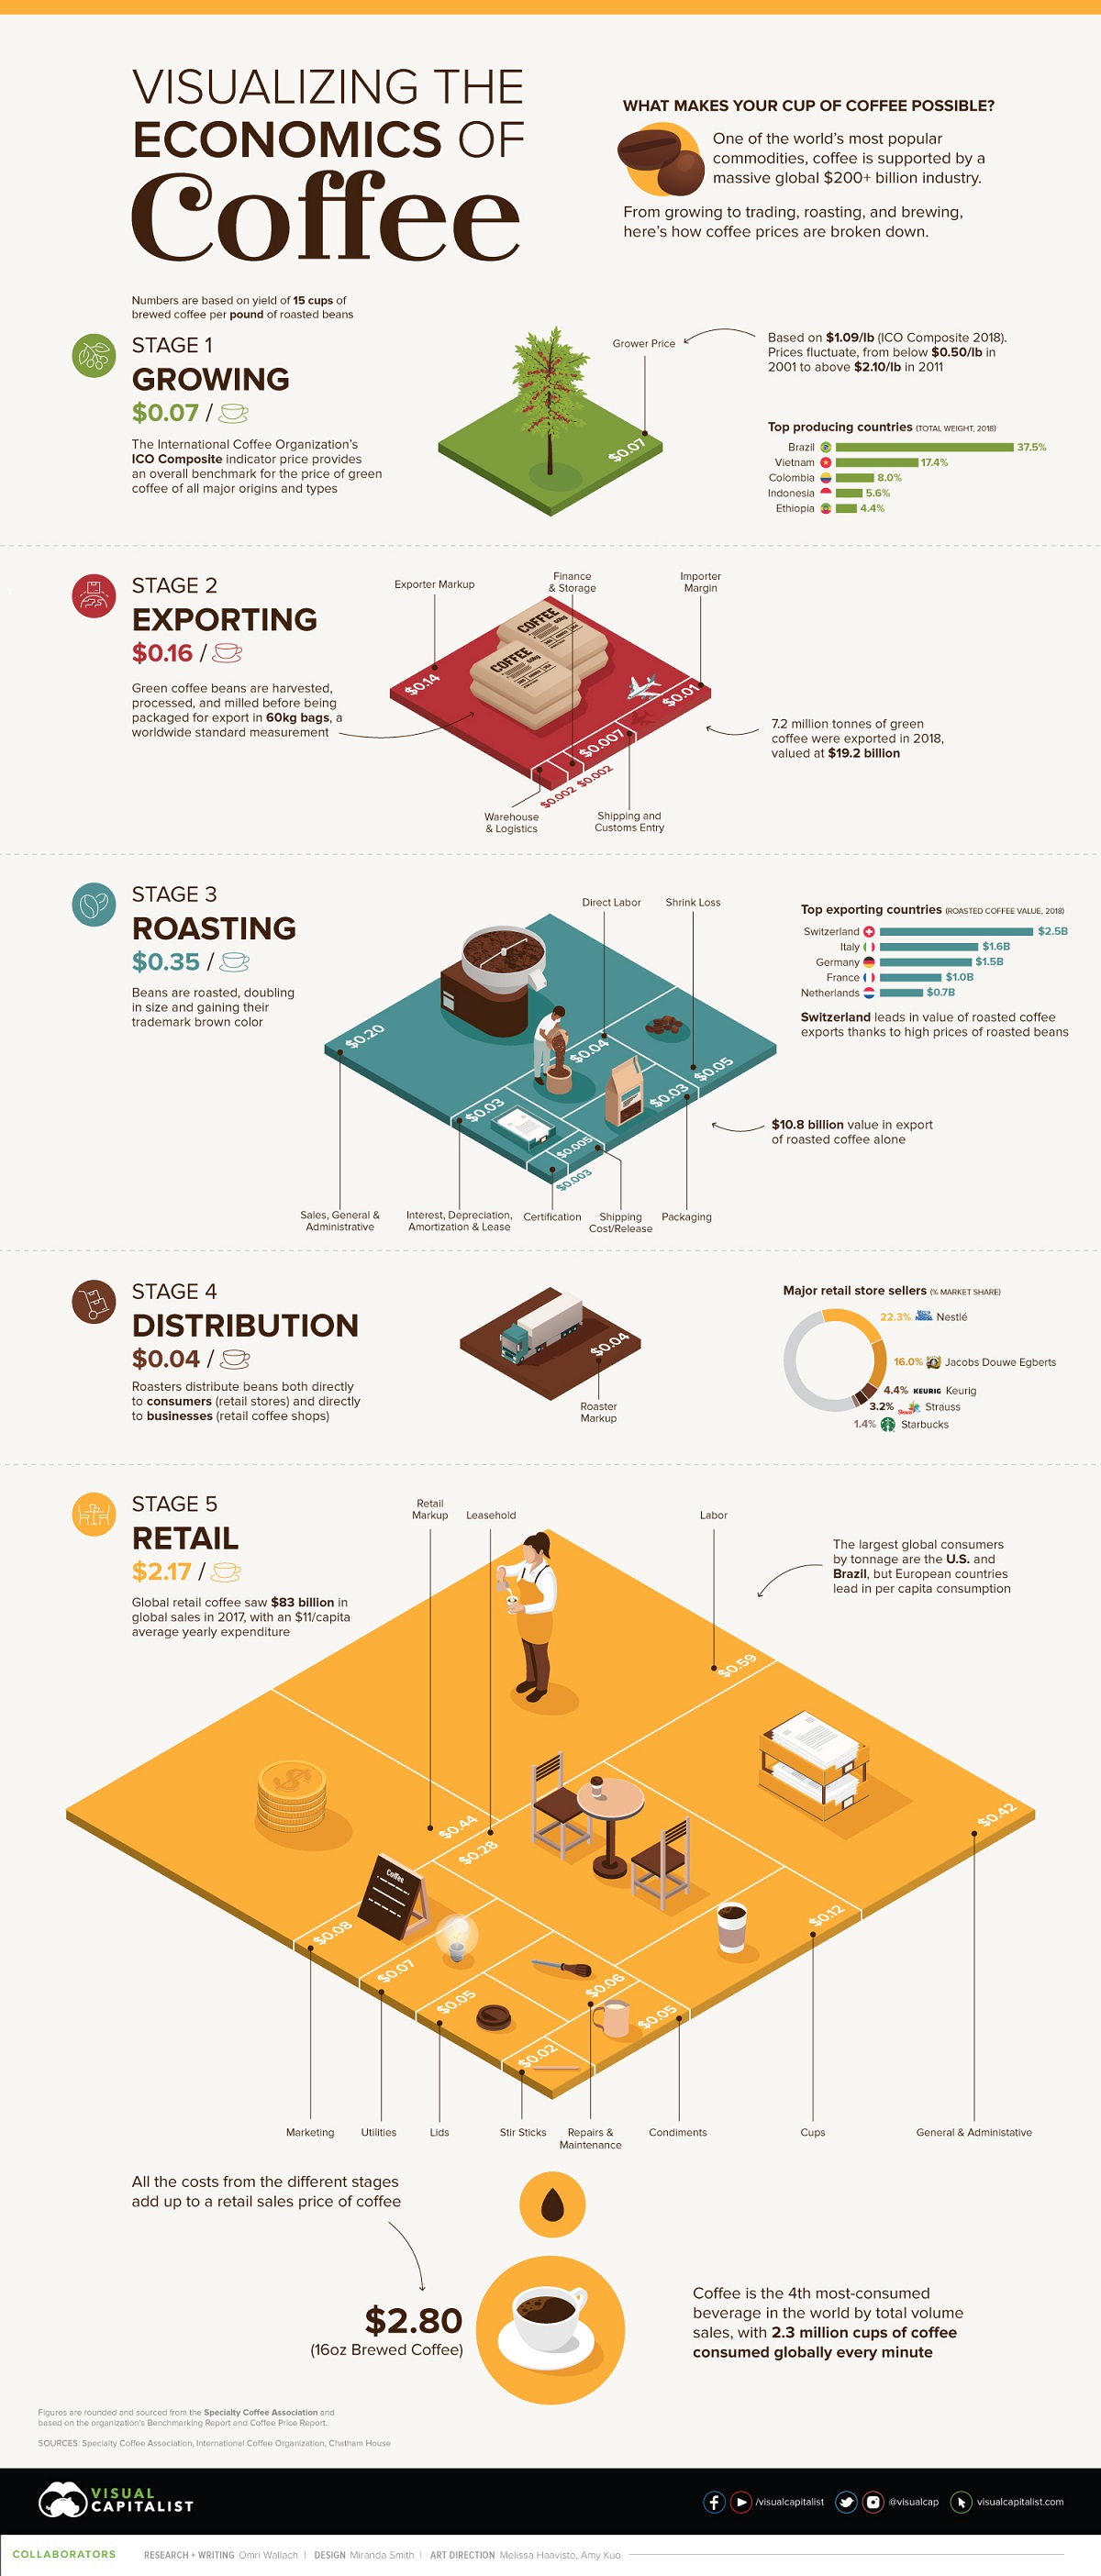


Breaking Down the Economics of Coffee
What goes into your morning cup of coffee, and what makes it possible?
The obvious answer might be coffee beans, but when you start to account for additional costs, the scope of a massive $200+ billion coffee supply chain becomes clear.
From the labor of growing, exporting, and roasting the coffee plants to the materials like packaging, cups, and even stir sticks, there are many underlying costs that factor into every cup of coffee consumed.
The above graphic breaks down the costs incurred by retail coffee production for one pound of coffee, equivalent to about 15 cups of 16 ounce brewed coffee.
The Difficulty of Pricing Coffee
Measuring and averaging out a global industry is a complicated ordeal.
Not only do global coffee prices constantly fluctuate, but each country also has differences in availability, relative costs, and the final price of a finished product.
That’s why a cup of 16 oz brewed coffee in the U.S. doesn’t cost the same in the U.K., or Japan, or anywhere else in the world. Even within countries, the differences of a company’s access to wholesale beans will dictate the final price.
To counteract these discrepancies, today’s infographic above uses figures sourced from the Specialty Coffee Association which are illustrative but based on the organization’s Benchmarking Report and Coffee Price Report.
What they end up with is an estimated set price of $2.80 for a brewed cup of coffee at a specialty coffee store. Each store and indeed each country will see a different price, but that gives us the foundation to start backtracking and breaking down the total costs.
From Growing Beans to Exporting Bags
To make coffee, you must have the right conditions to grow it.
The two major types of coffee, Arabica and Robusta, are produced primarily in subequatorial countries. The plants originated in Ethiopia, were first grown in Yemen in the 1600s, then spread around the world by way of European colonialism.
Today, Brazil is far and away the largest producer and exporter of coffee, with Vietnam the only other country accounting for a double-digit percentage of global production.
| Country | Coffee Production (60kg bags) | Share of Global Coffee Production |
|---|---|---|
| Brazil | 64,875,000 | 37.5% |
| Vietnam | 30,024,000 | 17.4% |
| Colombia | 13,858,000 | 8.0% |
| Indonesia | 9,618,000 | 5.6% |
| Ethiopia | 7,541,000 | 4.4% |
| Honduras | 7,328,000 | 4.2% |
| India | 6,002,000 | 3.5% |
| Uganda | 4,704,000 | 2.7% |
| Peru | 4,263,000 | 2.5% |
| Other | 24,629,000 | 14.2% |
How much money do growers make on green coffee beans? With prices constantly fluctuating each year, they can range from below $0.50/lb in 2001 to above $2.10/lb in 2011.
But if you’re looking for the money in coffee, you won’t find it at the source. Fairtrade estimates that 125 million people worldwide depend on coffee for their livelihoods, but many of them are unable to earn a reliable living from it.
Instead, one of the biggest profit margins is made by the companies exporting the coffee. In 2018 the ICO Composite price (which tracks both Arabica and Robusta coffee prices) averaged $1.09/lb, while the SCA lists exporters as charging a price of $3.24/lb for green coffee.
Roasting Economics
Roasters might be charged $3.24/lb for green coffee beans from exporters, but that’s far from the final price they pay.
First, beans have to be imported, adding shipping and importer fees that add $0.31/lb. Once the actual roasting begins, the cost of labor and certification and the inevitable losses along the way add an additional $1.86/lb before general business expenses.
By the end of it, roasters see a total illustrated cost of $8.73/lb.
| Roaster Economics | ($/lb) |
|---|---|
| Sales Price | $9.40 |
| Total Cost | $8.73 |
| Pre-tax Profit | $0.67 |
| Taxes | $0.23 |
| Net Profit | $0.44 |
| Net Profit (%) | 7.1% |
When it comes time for their profit margin, roasters quote a selling price of around $9.40/lb. After taxes, roasters see a net profit of roughly $0.44/lb or 7.1%.
Retail Margins
For consumers purchasing quality, roasted coffee beans directly through distributors, seeing a 1lb bag of roasted whole coffee for $14.99 and higher is standard. Retailers, however, are able to access coffee closer to the stated wholesale prices and add their own costs to the equation.
One pound of roasted coffee beans will translate into about 15 cups of 16 ounce (475 ml) brewed coffee for a store. At a price of $2.80/cup, that translates into a yield of $42.00/lb of coffee.
That doesn’t sound half bad until you start to factor in the costs. Material costs include the coffee itself, the cups and lids (often charged separately), the stir sticks and even the condiments. After all, containers of half-and-half and ground cinnamon don’t pay for themselves.
Factoring them all together equals a retail material cost of $13.00/lb. That still leaves a healthy gross profit of $29.00/lb, but running a retail store is an expensive business. Add to that the costs of operations, including labor, leasing, marketing, and administrative costs, and the total costs quickly ramp up to $35.47/lb.
In fact, when accounting for additional costs for interest and taxes, the SCA figures give retailers a net profit of $2.90/lb or 6.9%, slightly less than that of roasters.
A Massive Global Industry
Coffee production is a big industry for one reason: coffee consumption is truly a universal affair with 2.3 million cups of coffee consumed globally every minute. By total volume sales, coffee is the fourth most-consumed beverage in the world.
That makes the retail side of the market a major factor. Dominated by companies like Nestlé and Jacobs Douwe Egberts, global retail coffee sales in 2017 reached $83 billion, with an average yearly expenditure of $11 per capita globally.
Of course, some countries are bigger coffee drinkers than others. The largest global consumers by tonnage are the U.S. and Brazil (despite also being the largest producer and exporter), but per capita consumption is significantly higher in European countries like Norway and Switzerland.
The next time you sip your coffee, consider the multilayered and vast global supply chain that makes it all possible.


Economy
Economic Growth Forecasts for G7 and BRICS Countries in 2024
The IMF has released its economic growth forecasts for 2024. How do the G7 and BRICS countries compare?


G7 & BRICS Real GDP Growth Forecasts for 2024
The International Monetary Fund’s (IMF) has released its real gross domestic product (GDP) growth forecasts for 2024, and while global growth is projected to stay steady at 3.2%, various major nations are seeing declining forecasts.
This chart visualizes the 2024 real GDP growth forecasts using data from the IMF’s 2024 World Economic Outlook for G7 and BRICS member nations along with Saudi Arabia, which is still considering an invitation to join the bloc.
Get the Key Insights of the IMF’s World Economic Outlook
Want a visual breakdown of the insights from the IMF’s 2024 World Economic Outlook report?
This visual is part of a special dispatch of the key takeaways exclusively for VC+ members.
Get the full dispatch of charts by signing up to VC+.
Mixed Economic Growth Prospects for Major Nations in 2024
Economic growth projections by the IMF for major nations are mixed, with the majority of G7 and BRICS countries forecasted to have slower growth in 2024 compared to 2023.
Only three BRICS-invited or member countries, Saudi Arabia, the UAE, and South Africa, have higher projected real GDP growth rates in 2024 than last year.
| Group | Country | Real GDP Growth (2023) | Real GDP Growth (2024P) |
|---|---|---|---|
| G7 | 🇺🇸 U.S. | 2.5% | 2.7% |
| G7 | 🇨🇦 Canada | 1.1% | 1.2% |
| G7 | 🇯🇵 Japan | 1.9% | 0.9% |
| G7 | 🇫🇷 France | 0.9% | 0.7% |
| G7 | 🇮🇹 Italy | 0.9% | 0.7% |
| G7 | 🇬🇧 UK | 0.1% | 0.5% |
| G7 | 🇩🇪 Germany | -0.3% | 0.2% |
| BRICS | 🇮🇳 India | 7.8% | 6.8% |
| BRICS | 🇨🇳 China | 5.2% | 4.6% |
| BRICS | 🇦🇪 UAE | 3.4% | 3.5% |
| BRICS | 🇮🇷 Iran | 4.7% | 3.3% |
| BRICS | 🇷🇺 Russia | 3.6% | 3.2% |
| BRICS | 🇪🇬 Egypt | 3.8% | 3.0% |
| BRICS-invited | 🇸🇦 Saudi Arabia | -0.8% | 2.6% |
| BRICS | 🇧🇷 Brazil | 2.9% | 2.2% |
| BRICS | 🇿🇦 South Africa | 0.6% | 0.9% |
| BRICS | 🇪🇹 Ethiopia | 7.2% | 6.2% |
| 🌍 World | 3.2% | 3.2% |
China and India are forecasted to maintain relatively high growth rates in 2024 at 4.6% and 6.8% respectively, but compared to the previous year, China is growing 0.6 percentage points slower while India is an entire percentage point slower.
On the other hand, four G7 nations are set to grow faster than last year, which includes Germany making its comeback from its negative real GDP growth of -0.3% in 2023.
Faster Growth for BRICS than G7 Nations
Despite mostly lower growth forecasts in 2024 compared to 2023, BRICS nations still have a significantly higher average growth forecast at 3.6% compared to the G7 average of 1%.
While the G7 countries’ combined GDP is around $15 trillion greater than the BRICS nations, with continued higher growth rates and the potential to add more members, BRICS looks likely to overtake the G7 in economic size within two decades.
BRICS Expansion Stutters Before October 2024 Summit
BRICS’ recent expansion has stuttered slightly, as Argentina’s newly-elected president Javier Milei declined its invitation and Saudi Arabia clarified that the country is still considering its invitation and has not joined BRICS yet.
Even with these initial growing pains, South Africa’s Foreign Minister Naledi Pandor told reporters in February that 34 different countries have submitted applications to join the growing BRICS bloc.
Any changes to the group are likely to be announced leading up to or at the 2024 BRICS summit which takes place October 22-24 in Kazan, Russia.
Get the Full Analysis of the IMF’s Outlook on VC+
This visual is part of an exclusive special dispatch for VC+ members which breaks down the key takeaways from the IMF’s 2024 World Economic Outlook.
For the full set of charts and analysis, sign up for VC+.

-

 Markets1 week ago
U.S. Debt Interest Payments Reach $1 Trillion
-

 Business2 weeks ago
Charted: Big Four Market Share by S&P 500 Audits
-

 Real Estate2 weeks ago
Ranked: The Most Valuable Housing Markets in America
-

 Money2 weeks ago
Which States Have the Highest Minimum Wage in America?
-

 AI2 weeks ago
Ranked: Semiconductor Companies by Industry Revenue Share
-

 Markets2 weeks ago
Ranked: The World’s Top Flight Routes, by Revenue
-

 Demographics2 weeks ago
Population Projections: The World’s 6 Largest Countries in 2075
-

 Markets2 weeks ago
The Top 10 States by Real GDP Growth in 2023