Markets
The Dollar is Slowly Losing its Status as the Primary Reserve Currency
The Dollar is Slowly Losing its Status as the Primary Reserve Currency
The dollar has been a stalwart of international trade over the majority of the last century. Around the time of the formation of the Eurozone, it reached its recent peak at 71.0% of official foreign exchange reserves. Since then, its composition of global reserves has more recently dropped to a more modest 62.9% in 2014.
However, the dollar is slowly losing its status as the world’s undisputed reserve currency. This is not an unusual event as far as history goes. In fact, about every century or so since the Renaissance, the global reserve currency has shifted. Portugal, Spain, The Netherlands, France, and Britain have had dominant currencies at different times.
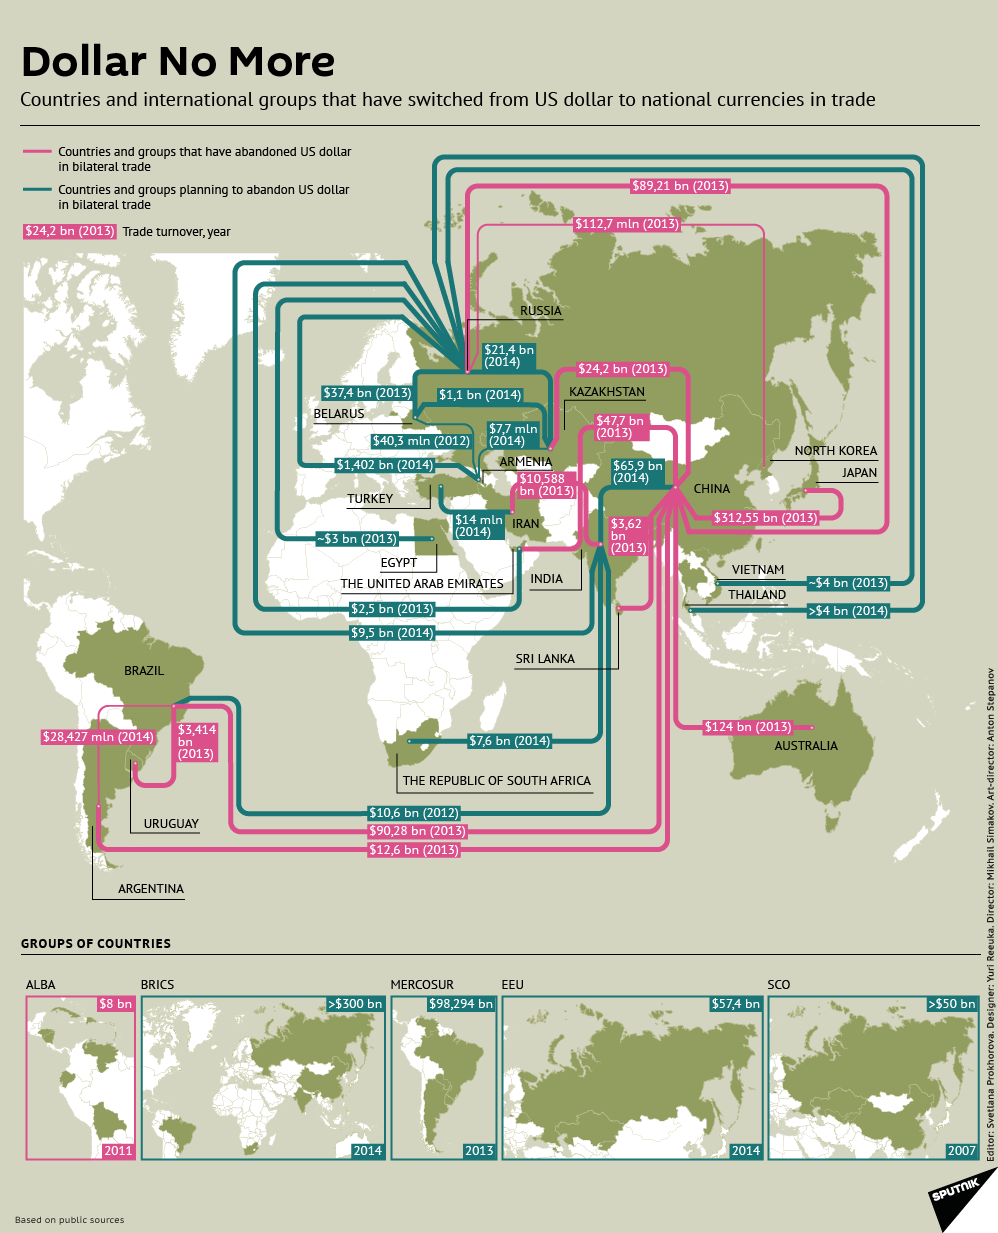
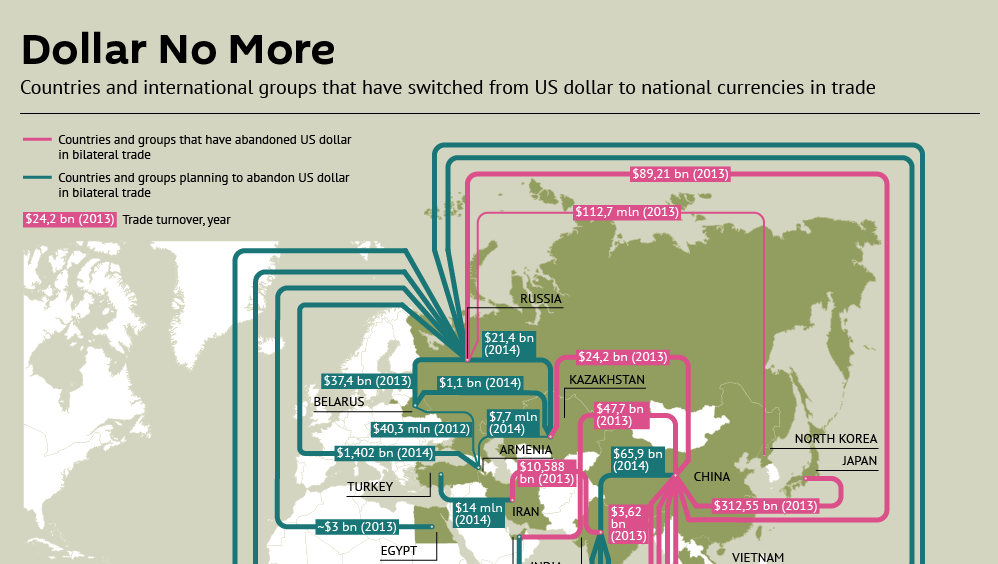
Today’s infographic shows that the wind is shifting in international trade. With less countries and organizations using the dollar to settle international transactions, it slowly chips away at its hegemony of the dollar. China is at the epicenter and the country is making continued progress in cutting deals outside of the U.S. dollar framework. Deals shown in the graphic are currency flows between countries that have abandoned the dollar in bilateral trade, as well as countries that are considering such measures.
The most recent culmination of these trends is the creation of the Asian Infrastructure Investment Bank (AIIB), a China-led rival to the World Bank and IMF that includes 57 founding countries and $100 billion of capital. The United States is not a member and has actively lobbied its allies to avoid joining due to perceived governance issues.
Other recent deals by China include: a 30-year $400 billion energy alliance with Russia, a second energy deal focusing on natural gas worth $284 billion with Russia, and a deal removing tariffs on 85% of Australian commodity exports to China. Further, China and Russia have agreed to pay each other in domestic currencies in order to bypass the U.S. dollar.
It is not only the Chinese that are starting to question the viability of the dollar. A report in 2010 by the United Nations called for the abandonment of the U.S. dollar as the single reserve currency. The Gulf Cooperation Council has also expressed desires for an independent reserve currency.
In the short term, especially with a crashing Chinese stock market and fledgling Eurozone, the dollar will likely reign supreme. It’s still a stretch for the yuan to make its way into foreign reserve coffers so long as capital controls remain in place and the country’s bond market is not open or transparent to offshore investors. However, Beijing is currently mulling ways to internationalize the yuan, and each step it takes will take China closer to challenging dollar hegemony.
With more bilateral trade transactions bypassing the dollar, and the increasing internationalization of the Chinese financial system, the yuan is eventually going to give the dollar a run for its money.
Original graphic by: Sputnik


Markets
U.S. Debt Interest Payments Reach $1 Trillion
U.S. debt interest payments have surged past the $1 trillion dollar mark, amid high interest rates and an ever-expanding debt burden.


U.S. Debt Interest Payments Reach $1 Trillion
This was originally posted on our Voronoi app. Download the app for free on iOS or Android and discover incredible data-driven charts from a variety of trusted sources.
The cost of paying for America’s national debt crossed the $1 trillion dollar mark in 2023, driven by high interest rates and a record $34 trillion mountain of debt.
Over the last decade, U.S. debt interest payments have more than doubled amid vast government spending during the pandemic crisis. As debt payments continue to soar, the Congressional Budget Office (CBO) reported that debt servicing costs surpassed defense spending for the first time ever this year.
This graphic shows the sharp rise in U.S. debt payments, based on data from the Federal Reserve.
A $1 Trillion Interest Bill, and Growing
Below, we show how U.S. debt interest payments have risen at a faster pace than at another time in modern history:
| Date | Interest Payments | U.S. National Debt |
|---|---|---|
| 2023 | $1.0T | $34.0T |
| 2022 | $830B | $31.4T |
| 2021 | $612B | $29.6T |
| 2020 | $518B | $27.7T |
| 2019 | $564B | $23.2T |
| 2018 | $571B | $22.0T |
| 2017 | $493B | $20.5T |
| 2016 | $460B | $20.0T |
| 2015 | $435B | $18.9T |
| 2014 | $442B | $18.1T |
| 2013 | $425B | $17.2T |
| 2012 | $417B | $16.4T |
| 2011 | $433B | $15.2T |
| 2010 | $400B | $14.0T |
| 2009 | $354B | $12.3T |
| 2008 | $380B | $10.7T |
| 2007 | $414B | $9.2T |
| 2006 | $387B | $8.7T |
| 2005 | $355B | $8.2T |
| 2004 | $318B | $7.6T |
| 2003 | $294B | $7.0T |
| 2002 | $298B | $6.4T |
| 2001 | $318B | $5.9T |
| 2000 | $353B | $5.7T |
| 1999 | $353B | $5.8T |
| 1998 | $360B | $5.6T |
| 1997 | $368B | $5.5T |
| 1996 | $362B | $5.3T |
| 1995 | $357B | $5.0T |
| 1994 | $334B | $4.8T |
| 1993 | $311B | $4.5T |
| 1992 | $306B | $4.2T |
| 1991 | $308B | $3.8T |
| 1990 | $298B | $3.4T |
| 1989 | $275B | $3.0T |
| 1988 | $254B | $2.7T |
| 1987 | $240B | $2.4T |
| 1986 | $225B | $2.2T |
| 1985 | $219B | $1.9T |
| 1984 | $205B | $1.7T |
| 1983 | $176B | $1.4T |
| 1982 | $157B | $1.2T |
| 1981 | $142B | $1.0T |
| 1980 | $113B | $930.2B |
| 1979 | $96B | $845.1B |
| 1978 | $84B | $789.2B |
| 1977 | $69B | $718.9B |
| 1976 | $61B | $653.5B |
| 1975 | $55B | $576.6B |
| 1974 | $50B | $492.7B |
| 1973 | $45B | $469.1B |
| 1972 | $39B | $448.5B |
| 1971 | $36B | $424.1B |
| 1970 | $35B | $389.2B |
| 1969 | $30B | $368.2B |
| 1968 | $25B | $358.0B |
| 1967 | $23B | $344.7B |
| 1966 | $21B | $329.3B |
Interest payments represent seasonally adjusted annual rate at the end of Q4.
At current rates, the U.S. national debt is growing by a remarkable $1 trillion about every 100 days, equal to roughly $3.6 trillion per year.
As the national debt has ballooned, debt payments even exceeded Medicaid outlays in 2023—one of the government’s largest expenditures. On average, the U.S. spent more than $2 billion per day on interest costs last year. Going further, the U.S. government is projected to spend a historic $12.4 trillion on interest payments over the next decade, averaging about $37,100 per American.
Exacerbating matters is that the U.S. is running a steep deficit, which stood at $1.1 trillion for the first six months of fiscal 2024. This has accelerated due to the 43% increase in debt servicing costs along with a $31 billion dollar increase in defense spending from a year earlier. Additionally, a $30 billion increase in funding for the Federal Deposit Insurance Corporation in light of the regional banking crisis last year was a major contributor to the deficit increase.
Overall, the CBO forecasts that roughly 75% of the federal deficit’s increase will be due to interest costs by 2034.

-

 Maps1 week ago
The Largest Earthquakes in the New York Area (1970-2024)
-

 Money2 weeks ago
Where Does One U.S. Tax Dollar Go?
-

 Automotive2 weeks ago
Almost Every EV Stock is Down After Q1 2024
-

 AI2 weeks ago
The Stock Performance of U.S. Chipmakers So Far in 2024
-

 Markets2 weeks ago
Charted: Big Four Market Share by S&P 500 Audits
-

 Real Estate2 weeks ago
Ranked: The Most Valuable Housing Markets in America
-

 Money2 weeks ago
Which States Have the Highest Minimum Wage in America?
-

 AI2 weeks ago
Ranked: Semiconductor Companies by Industry Revenue Share