Datastream
The Decline of U.S. Car Production


The Briefing
- U.S. auto manufacturing has been in a downward trend since the 1970s
- Overseas competitors have gradually eroded the market share of America’s Big Three
- Recent events like the global chip shortage present further setbacks
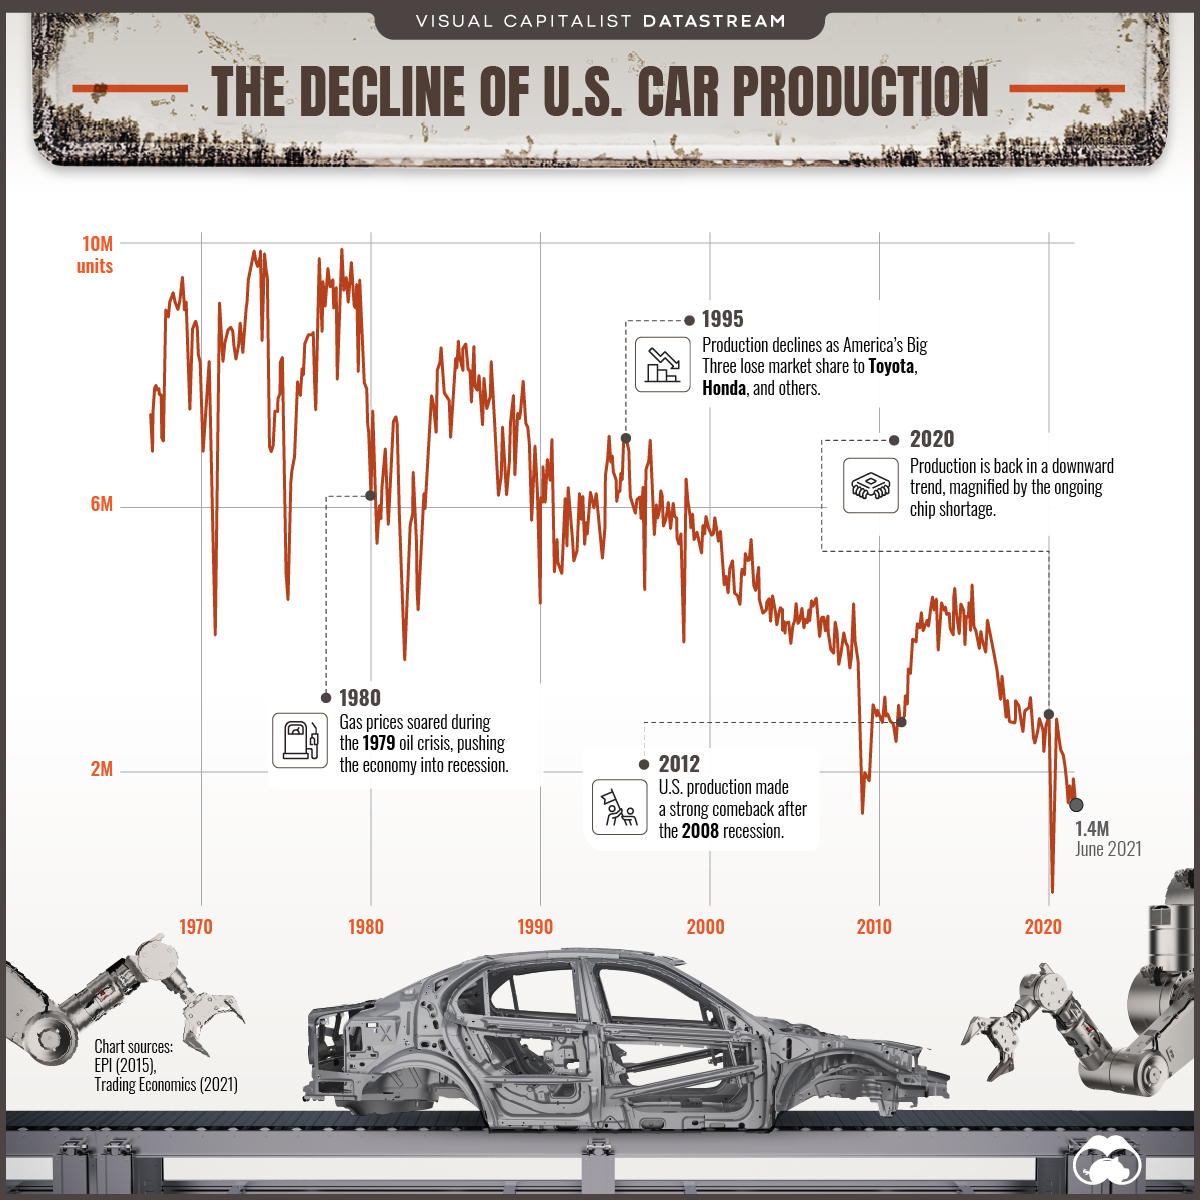
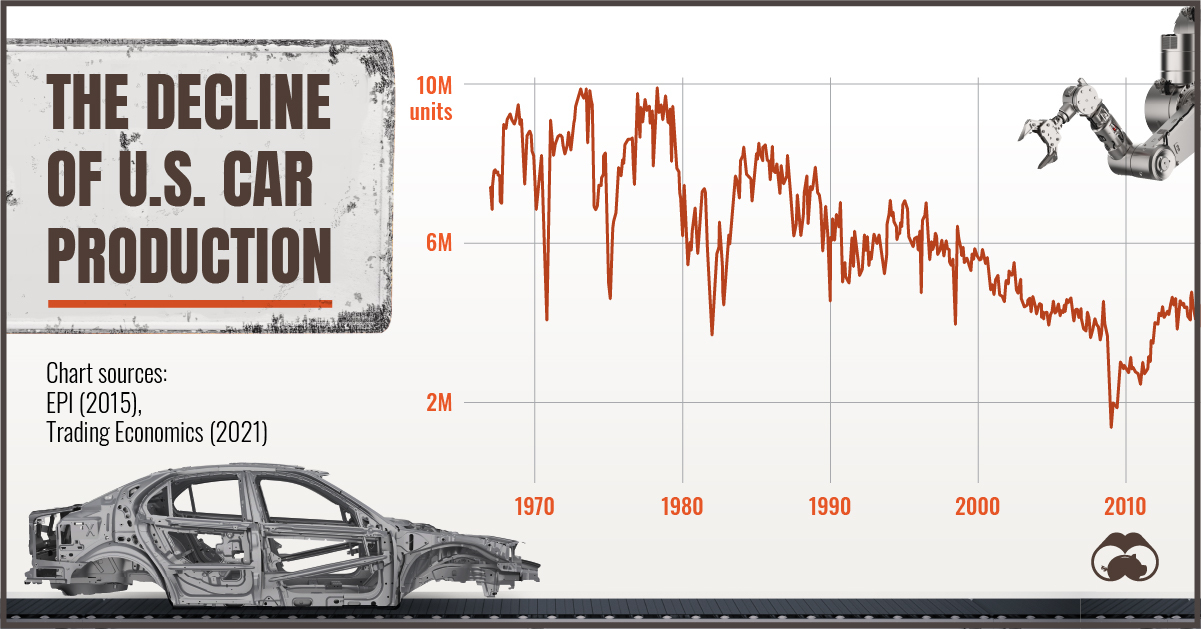
U.S. Car Production Falls to a New Low
Germany may have been the birthplace of the automobile, but it was America that developed the methods for mass production.
Created in 1913, Henry Ford’s assembly line greatly reduced the time it took to build a car. This also made cars more affordable, and America’s automotive industry quickly became the largest in the world. As we can see in the chart above, this dominance wouldn’t last forever.
From a high of nearly 10 million cars per month in the 1970s, the U.S. produced just 1.4 million in June 2021. Here are some reasons for why the country produces a fraction of the cars it used to.
Global Competition
America’s Big Three (Ford, GM, and Chrysler*) have been unable to defend their market share from overseas competitors. The following table shows how Honda and Toyota were able to break into the U.S. market over a span of just five decades.
| Year | Ford | GM | Chrysler | Big Three Total Market Share | Honda | Toyota |
|---|---|---|---|---|---|---|
| 1960 | 29.3% | 45.7% | 10.4% | 85.4% | - | - |
| 1970 | 28.3% | 38.9% | 14.9% | 82.1% | - | 2.0% |
| 1980 | 20.5% | 44.2% | 9.1% | 73.8% | 3.3% | 6.2% |
| 1990 | 23.8% | 35.2% | 12.0% | 71.0% | 6.0% | 7.6% |
| 2000 | 22.6% | 28.0% | 13.0% | 63.6% | 6.5% | 9.1% |
| 2010 | 16.4% | 18.8% | 9.2% | 44.4% | 10.5% | 15.0% |
*Chrysler is now a part of Stellantis N.V., a multinational corporation.
Source: WardsAuto
The 1970s presented an incredible opportunity for Honda and Toyota, which at the time were known for producing smaller, more fuel-efficient cars.
First was the Clean Air Act of 1970, which imposed limits on the amount of emissions a car could produce. Then came the 1973 oil crisis, which caused a massive spike in gasoline prices.
As consumers switched to smaller cars, American brands struggled to compete. For example, the flawed design of the Ford Pinto (Ford’s first subcompact car) was exposed in 1972 after one exploded in a rear-end collision. The ensuing lawsuit, Grimshaw v. Ford Motor Company, undoubtedly left a stain on the automaker’s reputation.
Production Moves to Mexico
2018 was a controversial year for GM as it came under fire by the Trump administration for closing four of its U.S. plants. That same year, GM became Mexico’s biggest automaker.
The decision to outsource is well-founded from a business standpoint. Mexico offers cheaper labor, lower taxes, and close proximity for logistics. Altogether, these benefits add up to roughly $1,200 in savings per car.
It’s important to note that GM isn’t alone in this decision. BMW, Ford, and many others have also invested in Mexico to produce cars destined for the United States.
Shifts in the Market
There are other, less obvious factors to consider too.
Modern cars are much more reliable, meaning Americans don’t need to purchase a new one as often. 2020 marks four consecutive years of increase for the average vehicle age in the U.S., which now sits at 12 years old.
“In the mid-’90s, 100,000 miles was about all you would get out of a vehicle. Now, at a 100,000 miles a vehicle is just getting broken in.”
– Todd Campau, Associate Director, IHS Markit
Rising car prices could also be playing a part. The average price of a new car was $41,000 as of July 2021, up from around $35,700 in May 2018.
Can U.S. Car Production Make a Comeback?
Recent events are a grim reminder of the direction U.S. car production is heading.
As part of its plant closures, GM shuttered its Lordstown facility in 2019. This broke a 2008 agreement in which GM pledged to keep 3,700 employees at the location through 2028. The company had received over $60 million in tax credits as part of this deal, and $28 million was ordered to be paid back.
COVID-19 has presented further issues, such as the ongoing chip shortage which has impacted the production of more than 1 million U.S.-made vehicles.
Not all hope is lost, however.
Tesla now employs over 70,000 Americans across its production facilities in California, Nevada, New York, and soon, Texas. The company is joined by Lucid Motors and Rivian, two entrants into the EV industry that have both opened U.S. plants in 2021.
Source: Trading Economics


Datastream
Can You Calculate Your Daily Carbon Footprint?
Discover how the average person’s carbon footprint impacts the environment and learn how carbon credits can offset your carbon footprint.


The Briefing
- A person’s carbon footprint is substantial, with activities such as food consumption creating as much as 4,500 g of CO₂ emissions daily.
- By purchasing carbon credits from Carbon Streaming Corporation, you can offset your own emissions and fund positive climate action.
Your Everyday Carbon Footprint
While many large businesses and countries have committed to net-zero goals, it is essential to acknowledge that your everyday activities also contribute to global emissions.
In this graphic, sponsored by Carbon Streaming Corporation, we will explore how the choices we make and the products we use have a profound impact on our carbon footprint.
Carbon Emissions by Activity
Here are some of the daily activities and products of the average person and their carbon footprint, according to Clever Carbon.
| Household Activities & Products | CO2 Emissions (g) |
|---|---|
| 💡 Standard Light Bulb (100 watts, four hours) | 172 g |
| 📱 Mobile Phone Use (195 minutes per day)* | 189 g |
| 👕 Washing Machine (0.63 kWh) | 275 g |
| 🔥 Electric Oven (1.56 kWh) | 675 g |
| ♨️ Tumble Dryer (2.5 kWh) | 1,000 g |
| 🧻 Toilet Roll (2 ply) | 1,300 g |
| 🚿 Hot Shower (10 mins) | 2,000 g |
| 🚙 Daily Commute (one hour, by car) | 3,360 g |
| 🍽️ Average Daily Food Consumption (three meals of 600 calories) | 4,500 g |
| *Phone use based on yearly use of 69kg per the source, Reboxed | |
Your choice of transportation plays a crucial role in determining your carbon footprint. For instance, a 15 km daily commute to work on public transport generates an average of 1,464 g of CO₂ emissions. Compared to 3,360 g—twice the volume for a journey the same length by car.
By opting for more sustainable modes of transport, such as cycling, walking, or public transportation, you can significantly reduce your carbon footprint.
Addressing Your Carbon Footprint
One way to compensate for your emissions is by purchasing high-quality carbon credits.
Carbon credits are used to help fund projects that avoid, reduce or remove CO₂ emissions. This includes nature-based solutions such as reforestation and improved forest management, or technology-based solutions such as the production of biochar and carbon capture and storage (CCS).
While carbon credits offer a potential solution for individuals to help reduce global emissions, public awareness remains a significant challenge. A BCG-Patch survey revealed that only 34% of U.S. consumers are familiar with carbon credits, and only 3% have purchased them in the past.
About Carbon Streaming
By financing the creation or expansion of carbon projects, Carbon Streaming Corporation secures the rights to future carbon credits generated by these sustainable projects. You can then purchase these carbon credits to help fund climate solutions around the world and compensate for your own emissions.
Ready to get involved?
>> Learn more about purchasing carbon credits at Carbon Streaming

-

 Mining2 weeks ago
Charted: The Value Gap Between the Gold Price and Gold Miners
-

 Real Estate1 week ago
Ranked: The Most Valuable Housing Markets in America
-

 Business1 week ago
Charted: Big Four Market Share by S&P 500 Audits
-

 AI1 week ago
The Stock Performance of U.S. Chipmakers So Far in 2024
-

 Automotive1 week ago
Almost Every EV Stock is Down After Q1 2024
-

 Money2 weeks ago
Where Does One U.S. Tax Dollar Go?
-

 Green2 weeks ago
Ranked: Top Countries by Total Forest Loss Since 2001
-

 Markets2 weeks ago
Visualizing America’s Shortage of Affordable Homes