
Visualized: Key Events in the COVID-19 Timeline
It’s been a long year since the WHO declared the novel coronavirus a global pandemic. This visual looks at key events in the COVID-19 timeline.
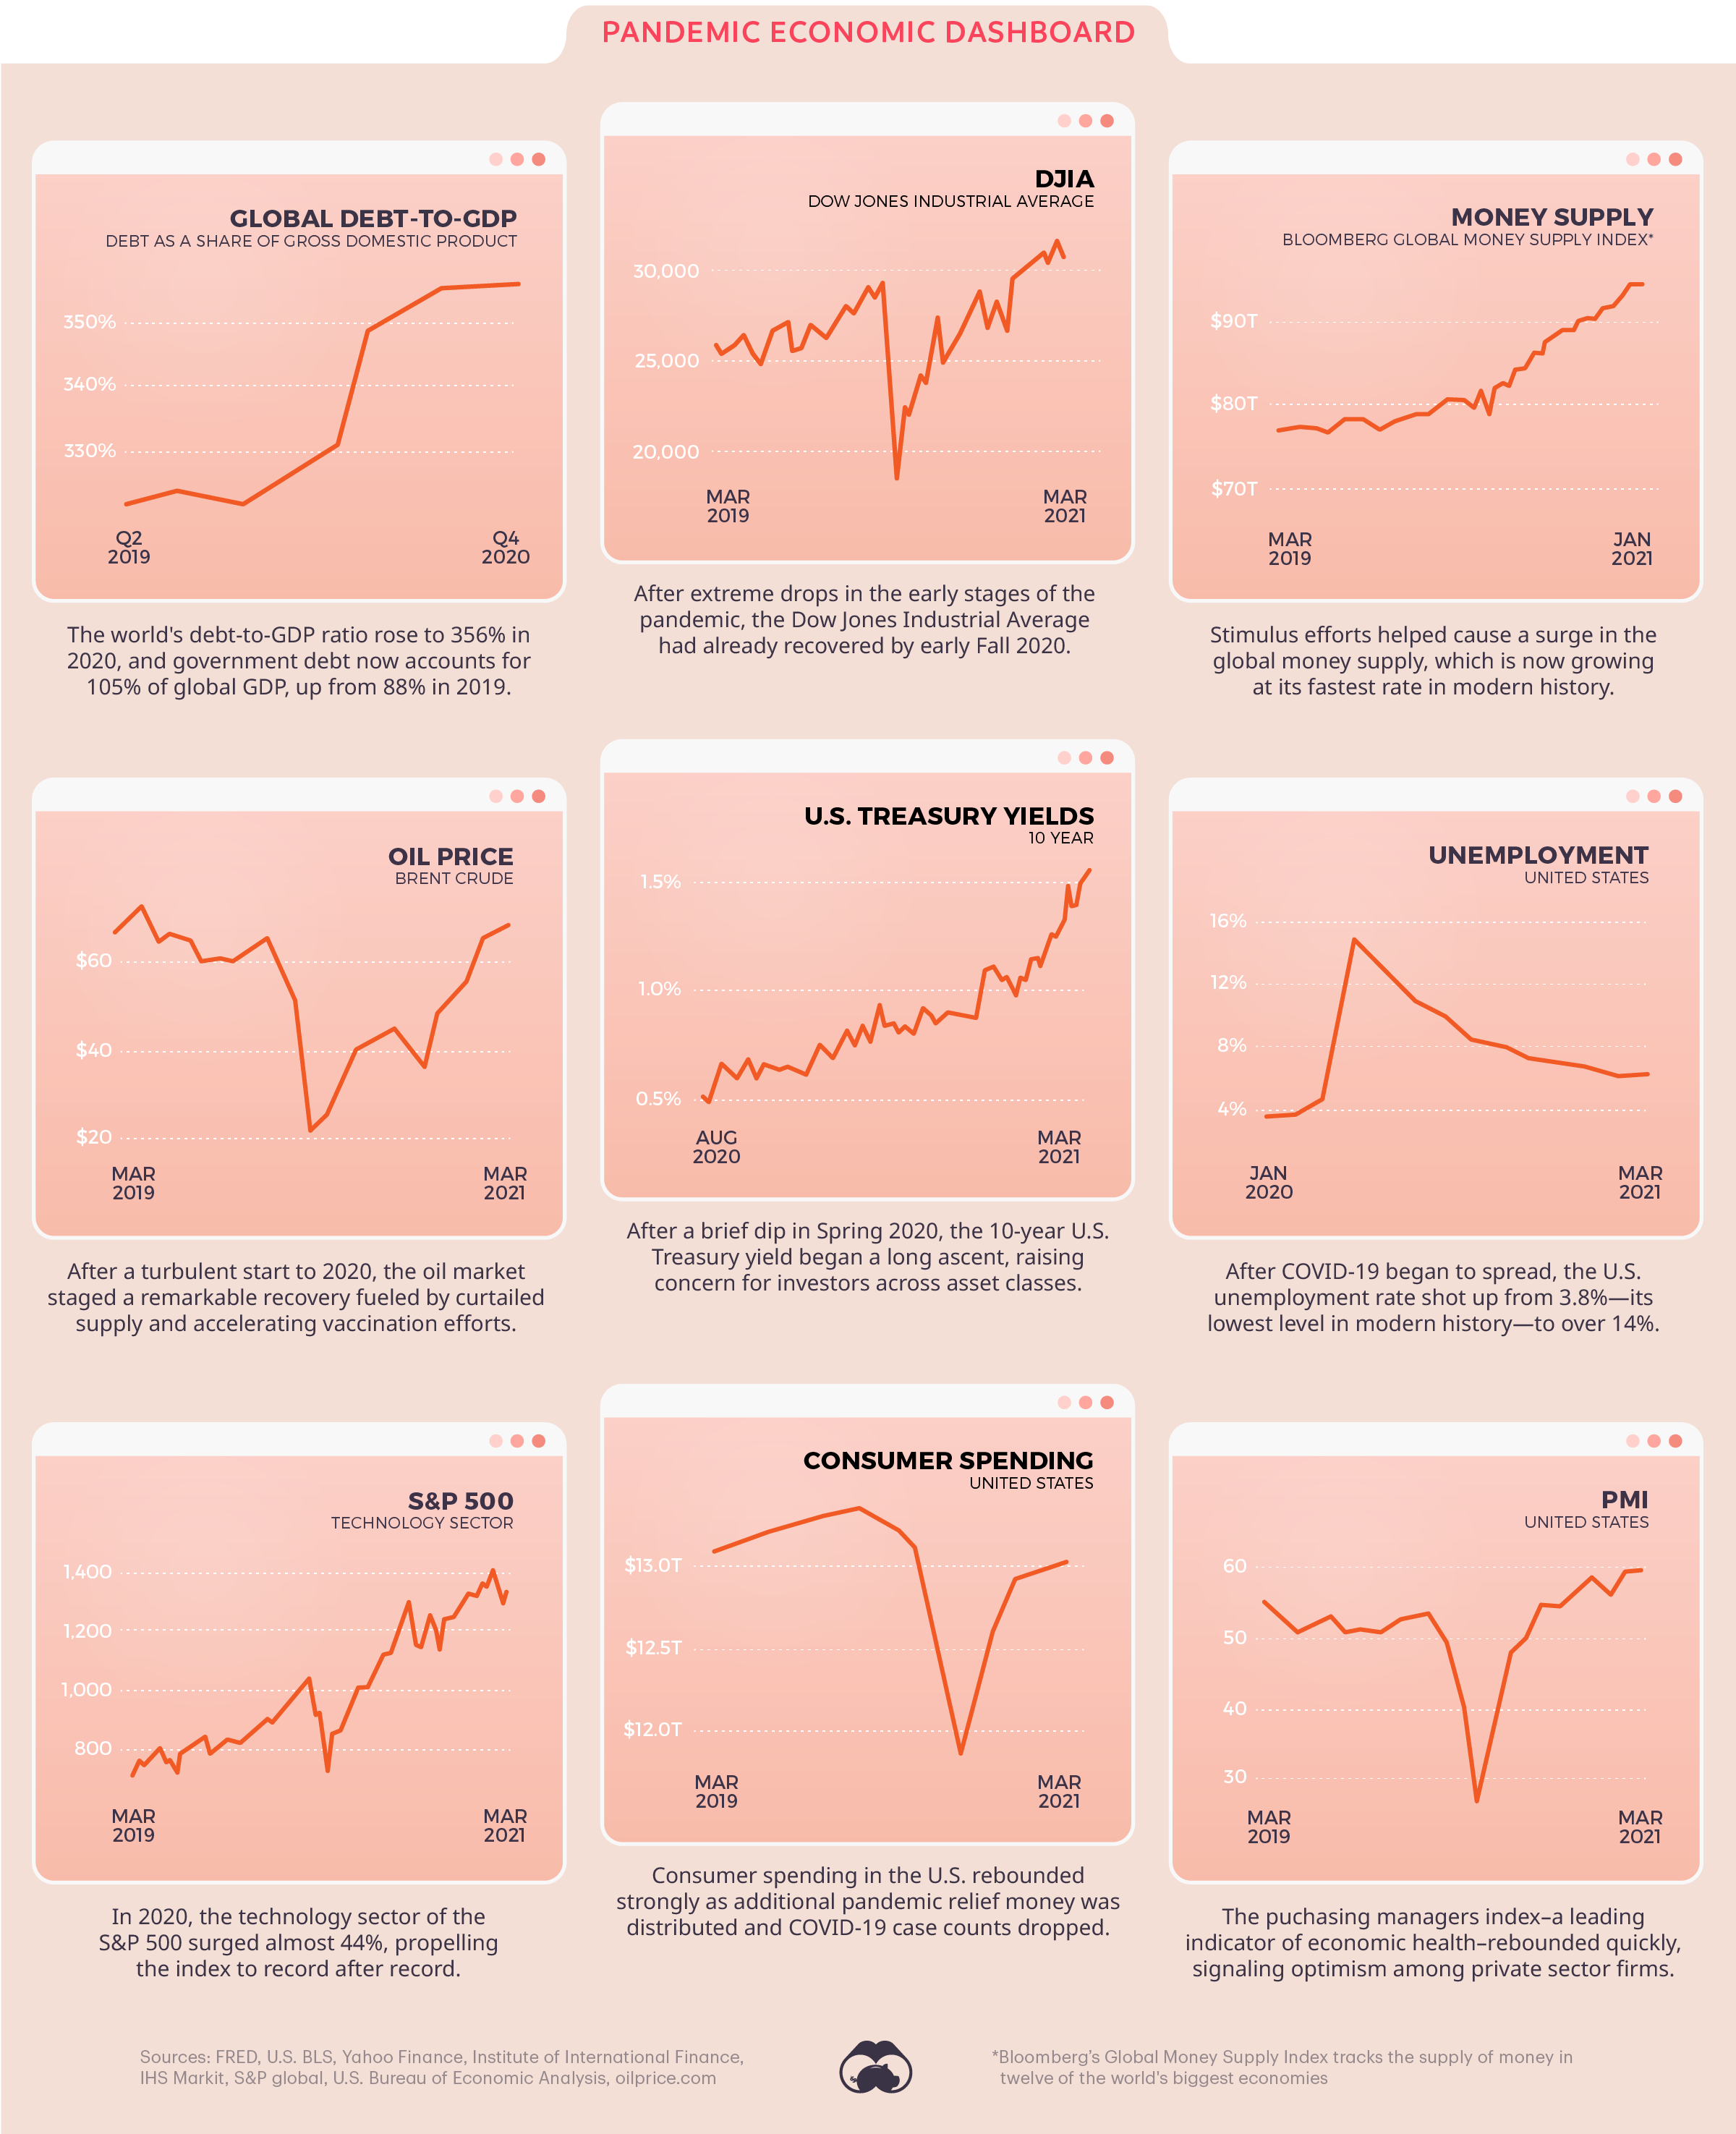
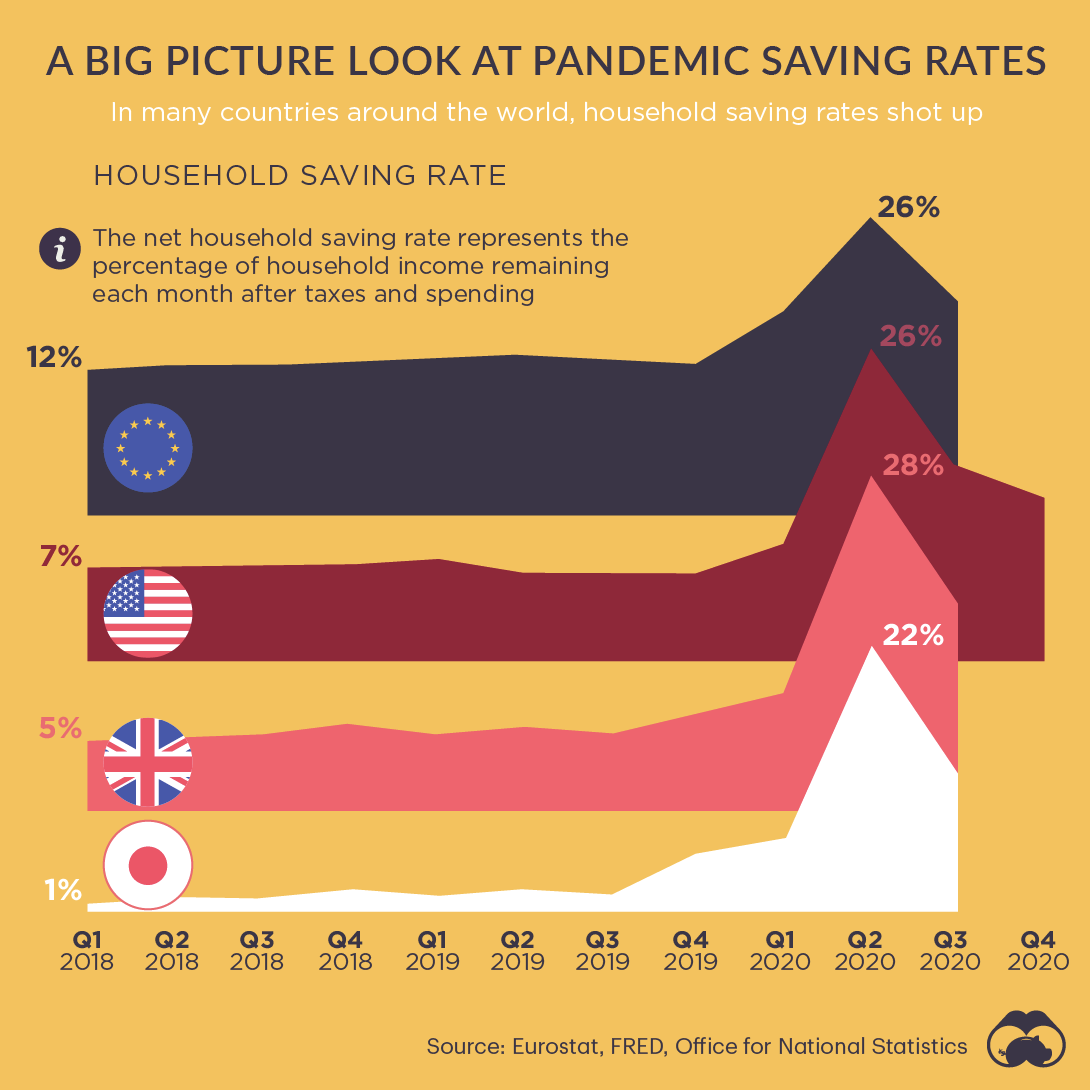
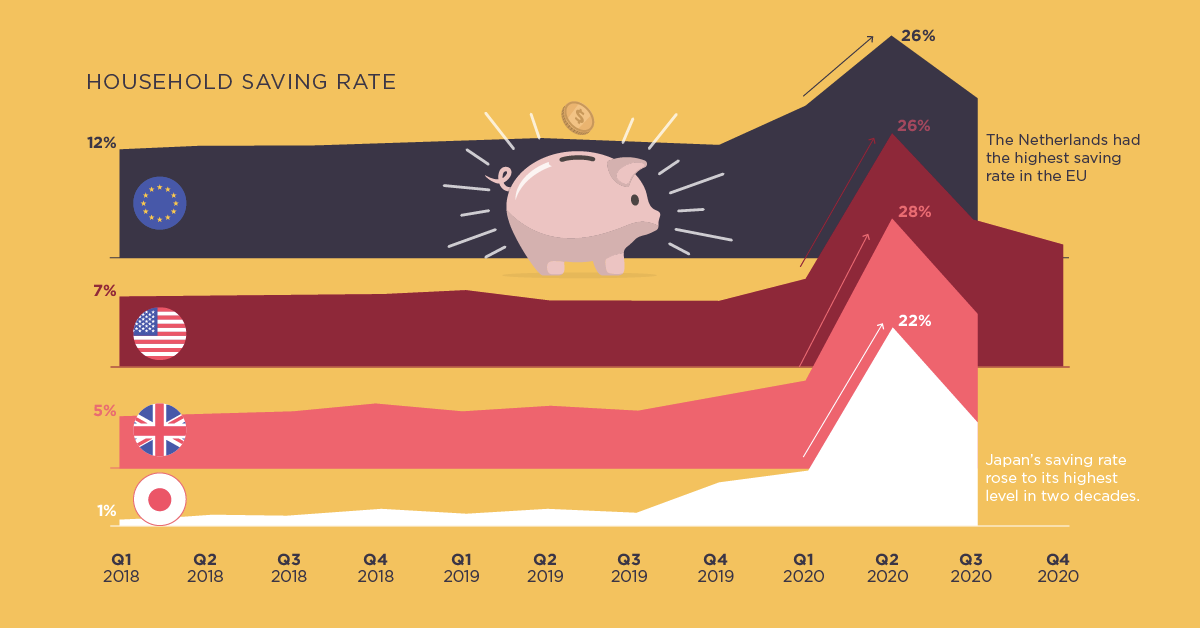
One Year In: Did People Save More or Less During the Pandemic?
Were people more frugal during the pandemic or did they break the bank? This visual assesses the saving rates across different countries.
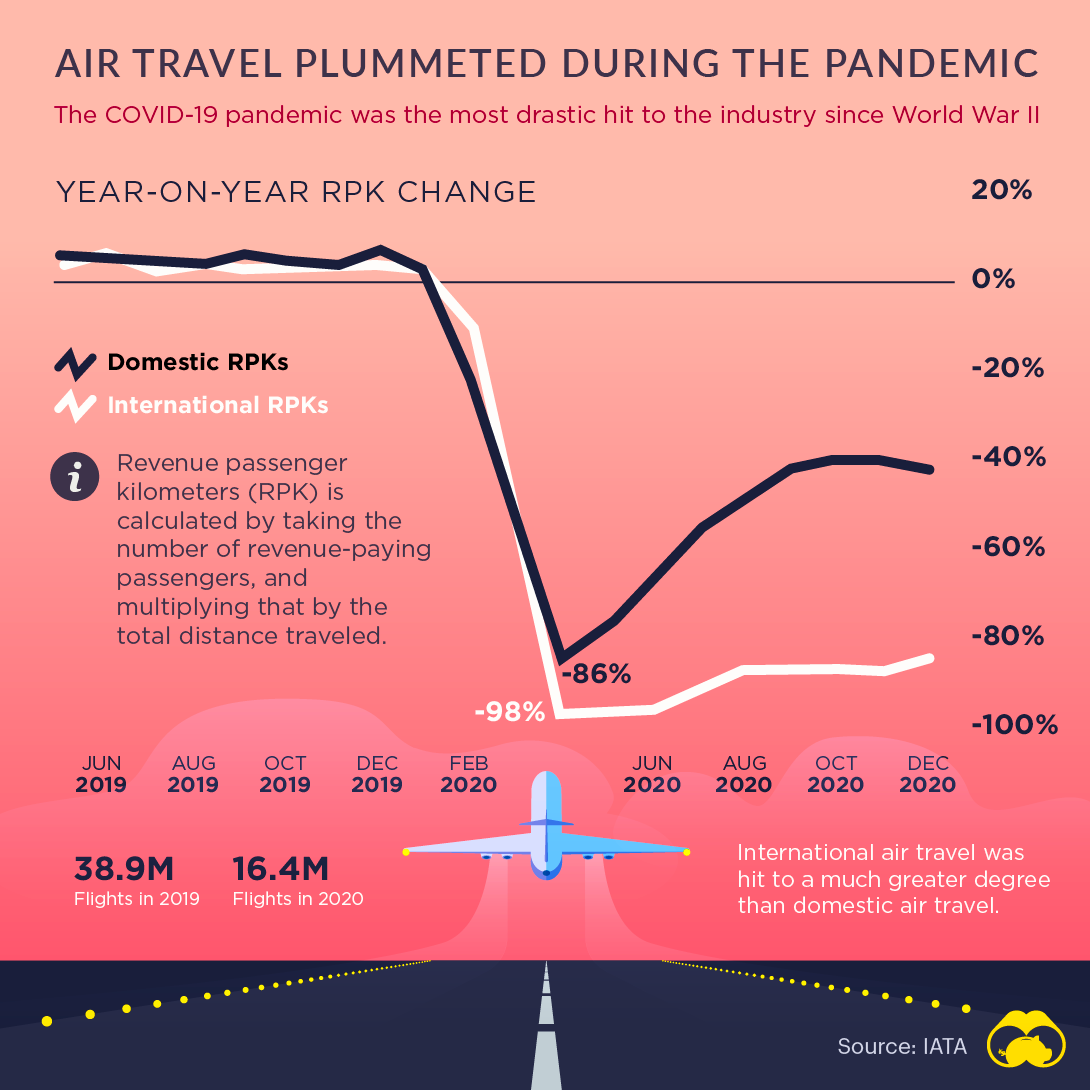
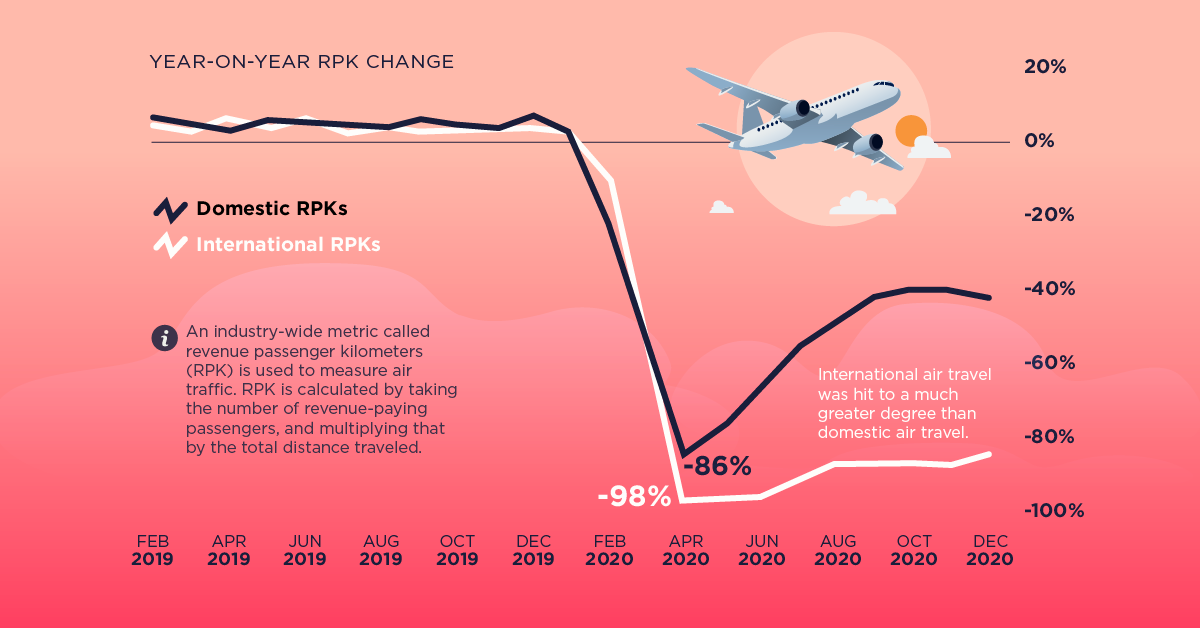
One Year In: Air Travel Plummeted During the COVID-19 Pandemic
In spring 2020, roughly two-thirds of the world’s passenger jets were grounded. Here’s how things have rebounded since the onset of the pandemic.
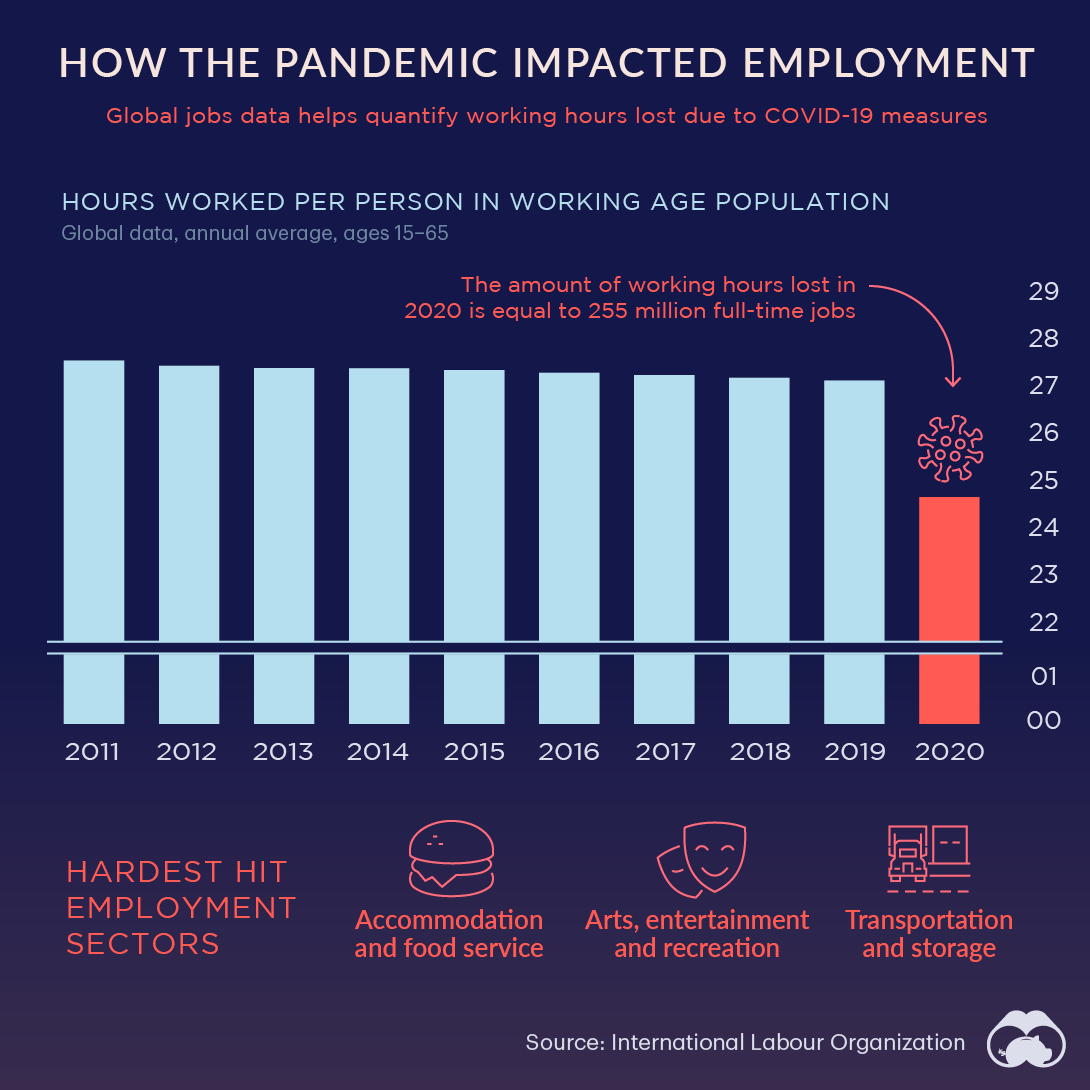
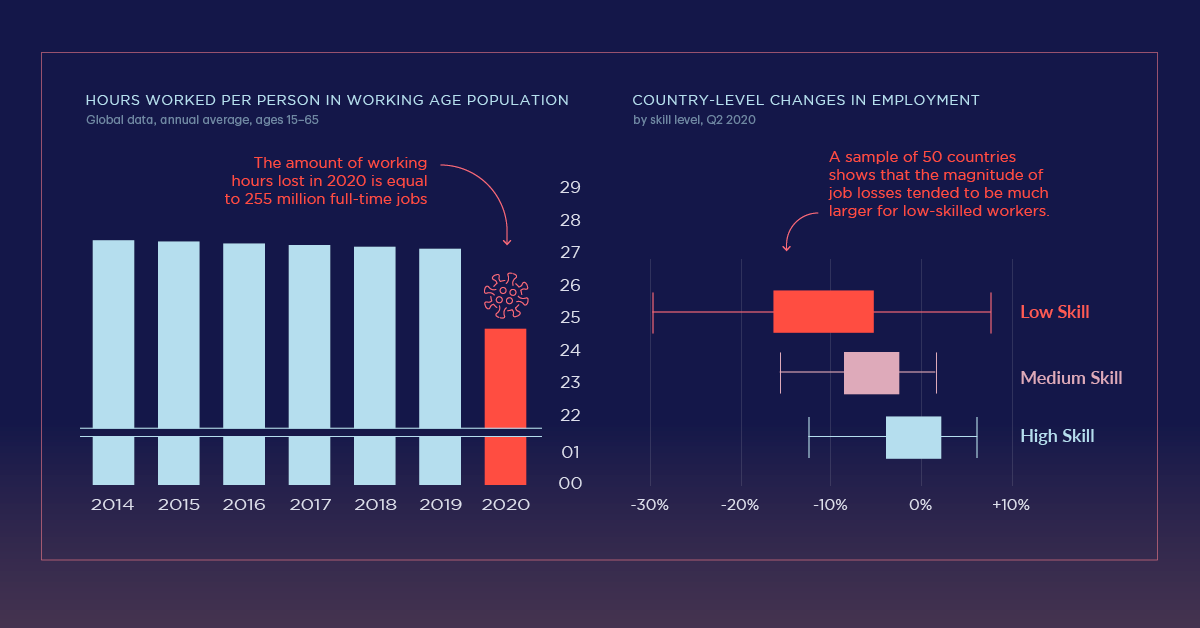
One Year In: How the Pandemic Impacted Employment Around the World
The pandemic has impacted employment greatly. This visual reveals how its effects have led to losses in hours worked by global workers in 2020.
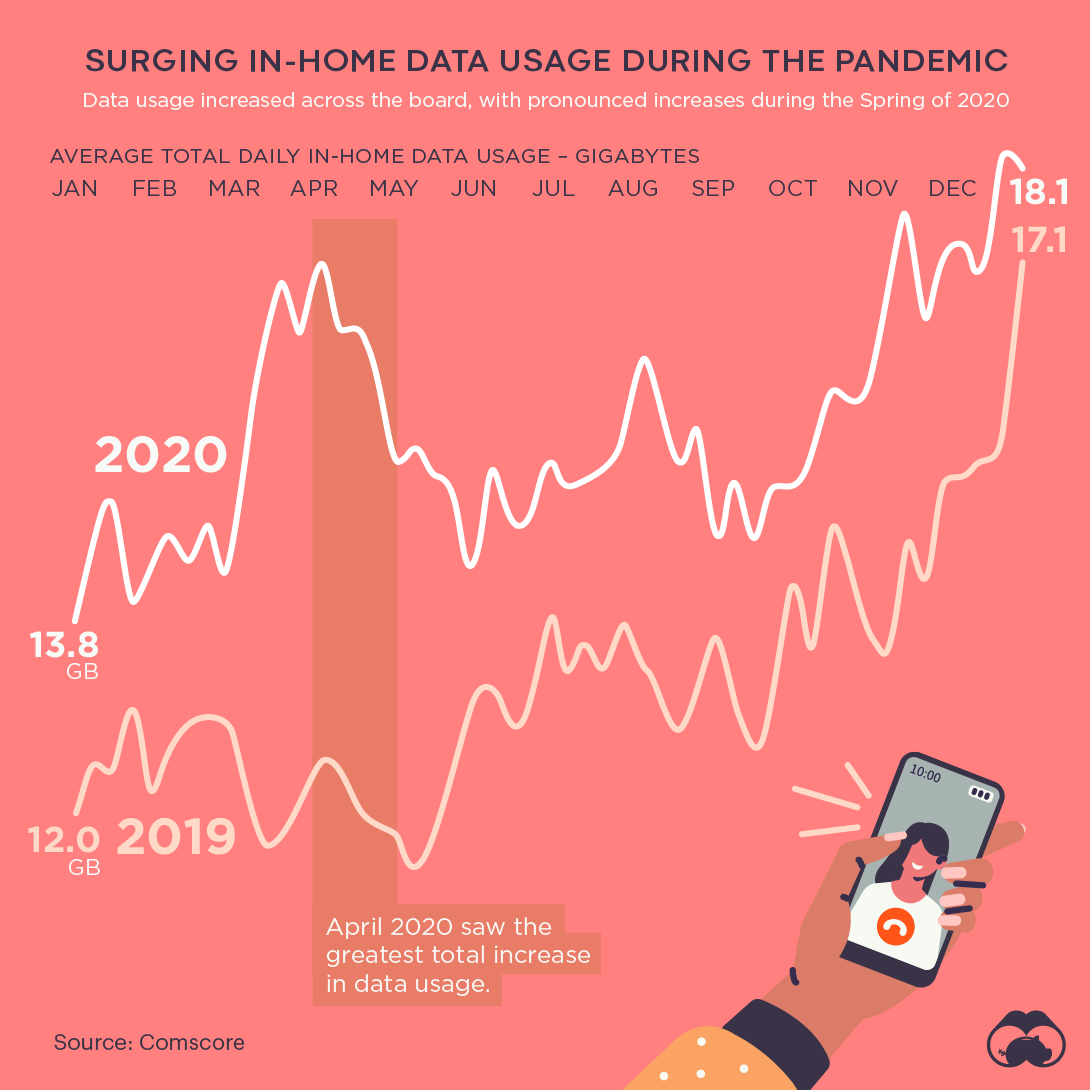
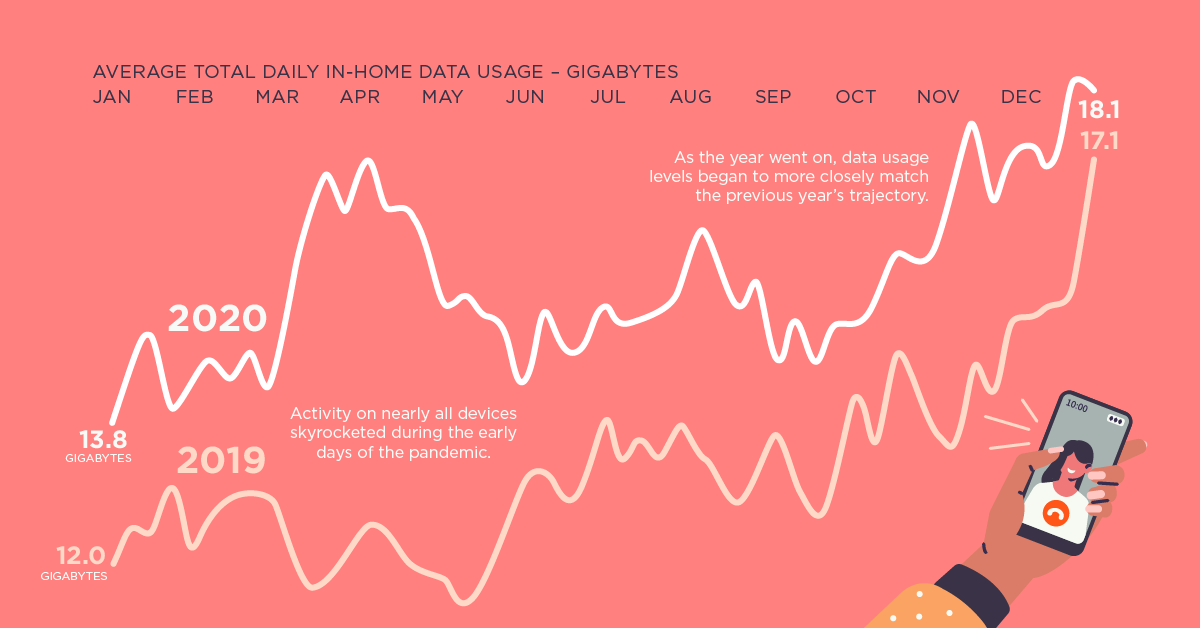
One Year In: Data Usage Surged During Pandemic
Data usage across America peaked in April 2020, but reached relatively normal levels by the end of the year.
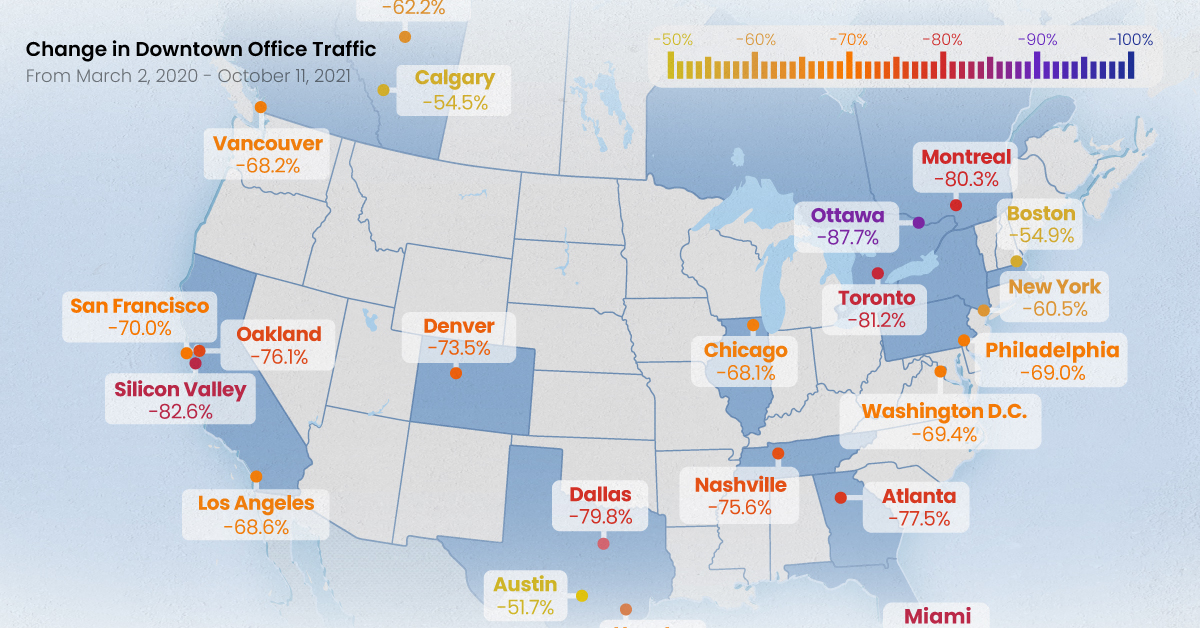
Pandemic Recovery: Have North American Downtowns Bounced Back?
All North American downtowns are facing a sluggish recovery, but some are still seeing more than 80% less foot traffic than pre-pandemic times
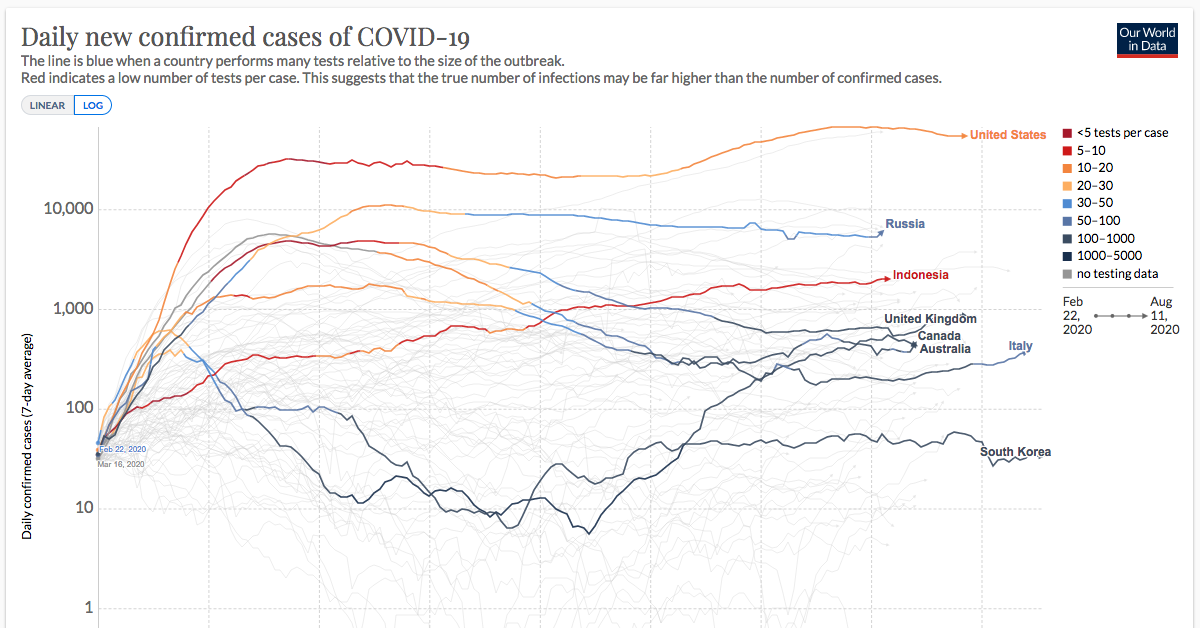
Global COVID-19 Containment: Confirmed Cases, Updated Daily
This continuously updated chart provides a more complete look at the efficacy of COVID-19 containment strategies.
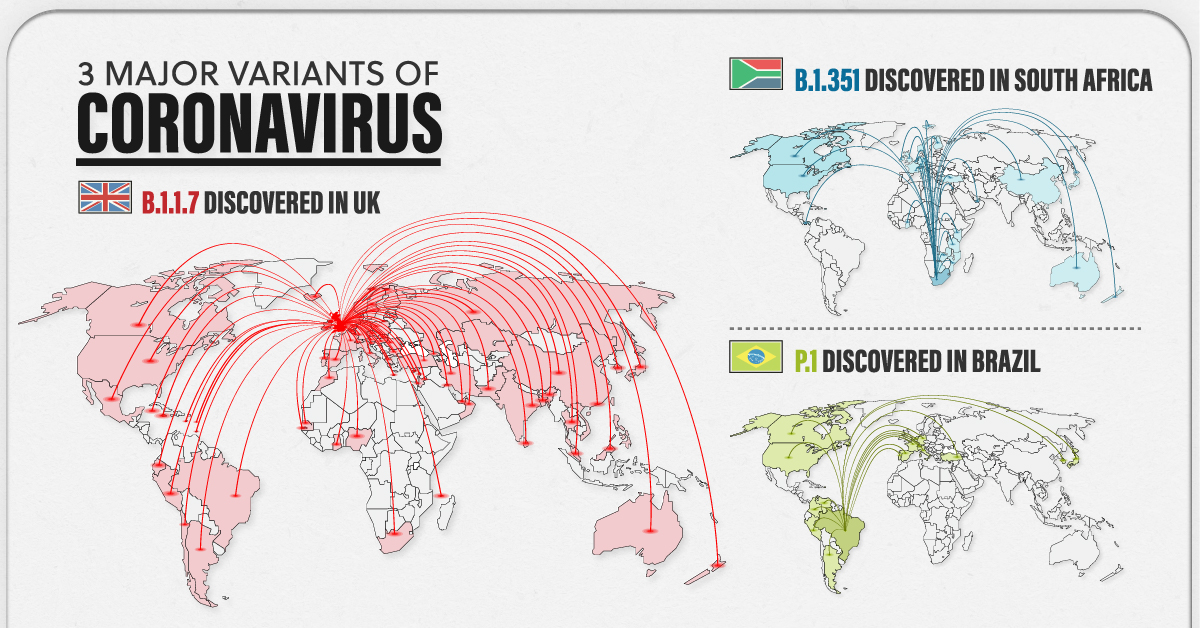
Explained: The 3 Major COVID-19 Variants
New variants of COVID-19 are spreading fast around the world. Here’s a look at the 3 major ones and how they differ from one another.