Markets
The Biggest Companies in the World in 2021
View the full-resolution version of this infographic.


The Biggest Companies in the World
View the high-resolution version of the infographic by clicking here.
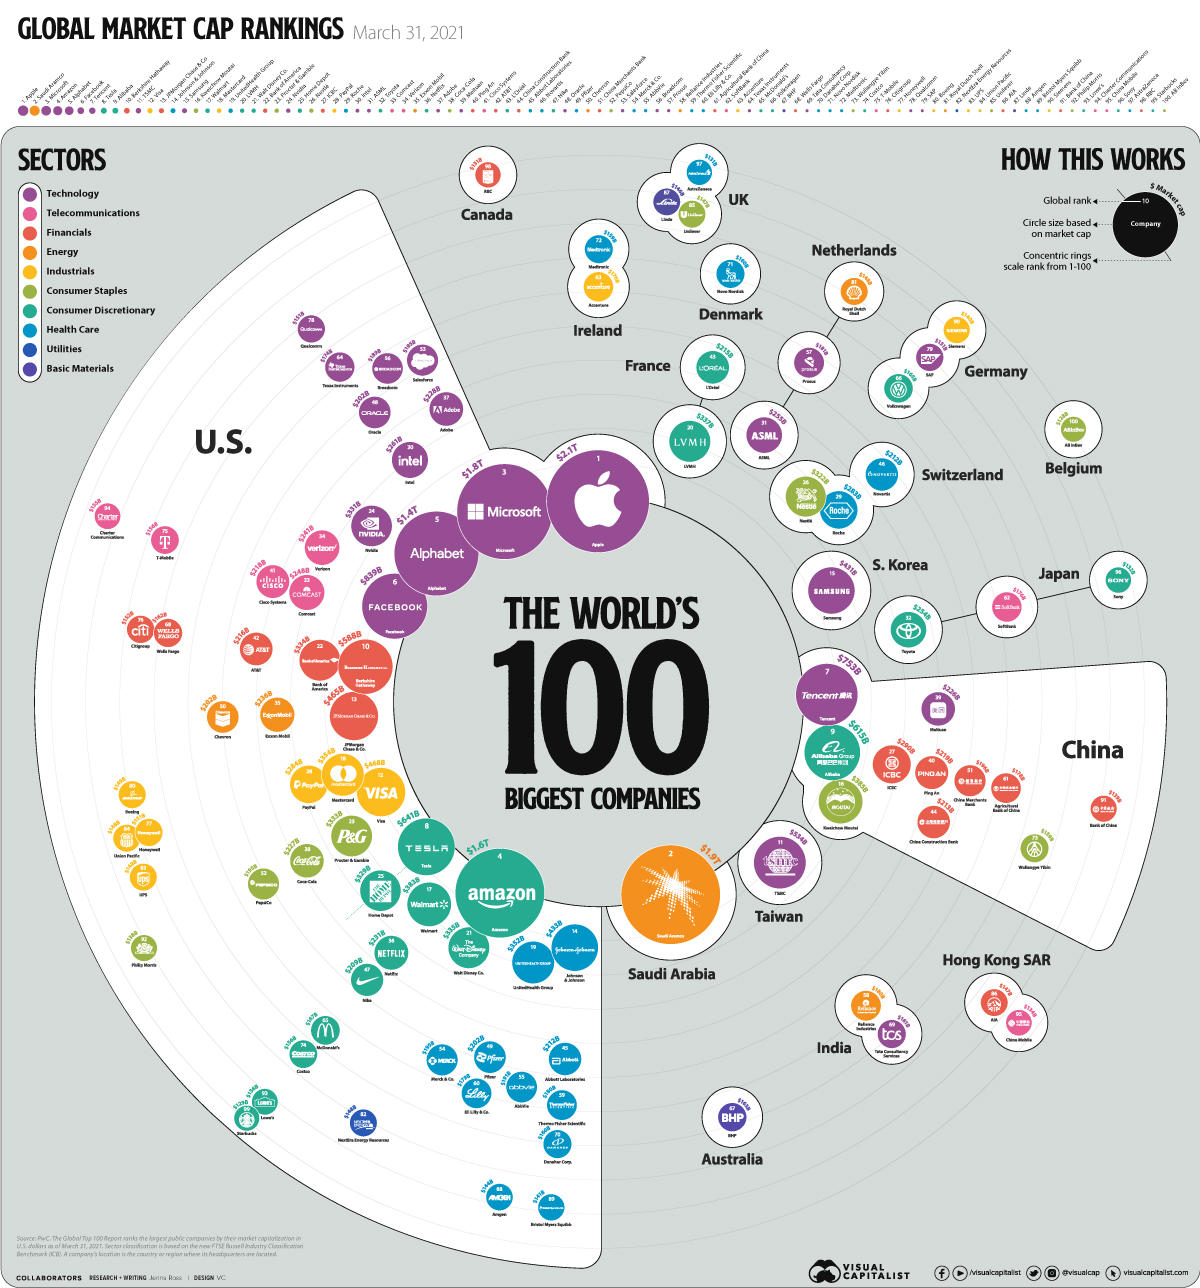
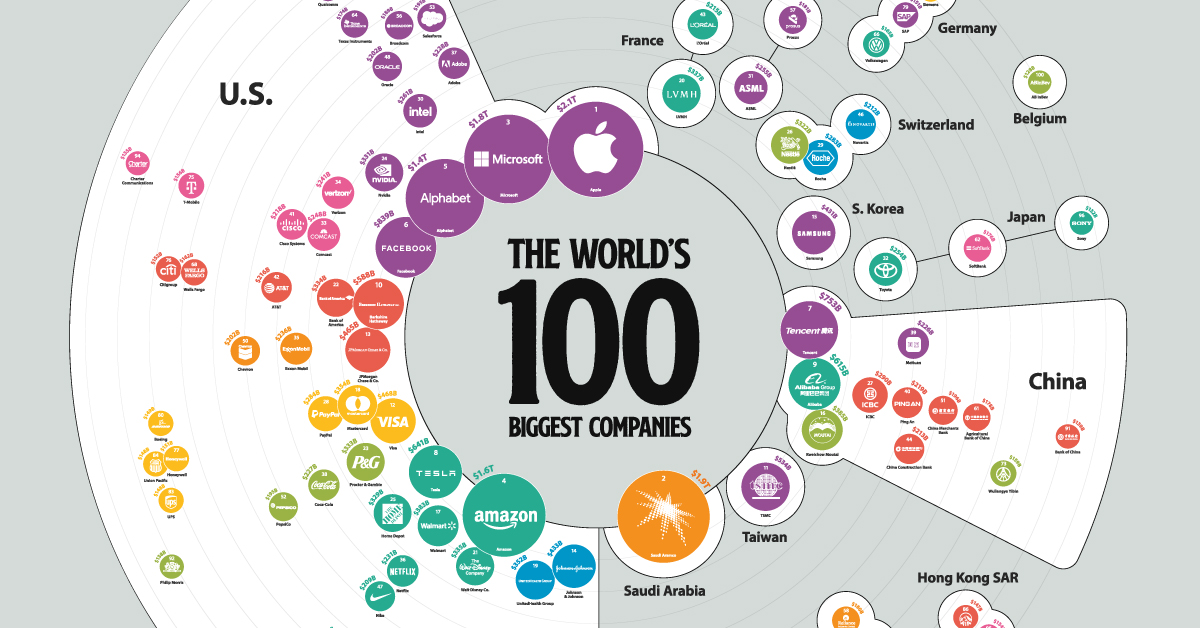
Since the COVID-19 crash, global equity markets have seen a strong recovery. The 100 biggest companies in the world were worth a record-breaking $31.7 trillion as of March 31 2021, up 48% year-over-year. As a point of comparison, the combined GDP of the U.S. and China was $35.7 trillion in 2020.
In today’s graphic, we use PwC data to show the world’s biggest businesses by market capitalization, as well as the countries and sectors they are from.
The Top 100, Ranked
PwC ranked the largest publicly-traded companies by their market capitalization in U.S. dollars. It’s also worth noting that sector classification is based on the FTSE Russell Industry Classification Benchmark, and a company’s location is based on where its headquarters are located.
Here is the top 100 ranking of the biggest companies in the world, organized from the biggest to the smallest.
| Rank | Company name | Location | Sector | Market Capitalization |
|---|---|---|---|---|
| 1 | APPLE INC | 🇺🇸 United States | Technology | $2.1T |
| 2 | SAUDI ARAMCO | 🇸🇦 Saudi Arabia | Energy | $1.9T |
| 3 | MICROSOFT CORP | 🇺🇸 United States | Technology | $1.8T |
| 4 | AMAZON.COM INC | 🇺🇸 United States | Consumer Discretionary | $1.6T |
| 5 | ALPHABET INC | 🇺🇸 United States | Technology | $1.4T |
| 6 | FACEBOOK INC | 🇺🇸 United States | Technology | $839B |
| 7 | TENCENT | 🇨🇳 China | Technology | $753B |
| 8 | TESLA INC | 🇺🇸 United States | Consumer Discretionary | $641B |
| 9 | ALIBABA GRP | 🇨🇳 China | Consumer Discretionary | $615B |
| 10 | BERKSHIRE HATHAWAY | 🇺🇸 United States | Financials | $588B |
| 11 | TSMC | 🇹🇼 Taiwan | Technology | $534B |
| 12 | VISA INC | 🇺🇸 United States | Industrials | $468B |
| 13 | JPMORGAN CHASE | 🇺🇸 United States | Financials | $465B |
| 14 | JOHNSON & JOHNSON | 🇺🇸 United States | Health Care | $433B |
| 15 | SAMSUNG ELECTRONICS | 🇰🇷 South Korea | Technology | $431B |
| 16 | KWEICHOW MOUTA | 🇨🇳 China | Consumer Staples | $385B |
| 17 | WALMART INC | 🇺🇸 United States | Consumer Discretionary | $383B |
| 18 | MASTERCARD INC | 🇺🇸 United States | Industrials | $354B |
| 19 | UNITEDHEALTH GRP | 🇺🇸 United States | Health Care | $352B |
| 20 | LVMH MOET HENNESSY | 🇫🇷 France | Consumer Discretionary | $337B |
| 21 | WALT DISNEY CO | 🇺🇸 United States | Consumer Discretionary | $335B |
| 22 | BANK OF AMERICA | 🇺🇸 United States | Financials | $334B |
| 23 | PROCTER & GAMBLE | 🇺🇸 United States | Consumer Staples | $333B |
| 24 | NVIDIA CORP | 🇺🇸 United States | Technology | $331B |
| 25 | HOME DEPOT INC | 🇺🇸 United States | Consumer Discretionary | $329B |
| 26 | NESTLE SA | 🇨🇭 Switzerland | Consumer Staples | $322B |
| 27 | IND & COMM BK | 🇨🇳 China | Financials | $290B |
| 28 | PAYPAL HOLDINGS | 🇺🇸 United States | Industrials | $284B |
| 29 | ROCHE HOLDING | 🇨🇭 Switzerland | Health Care | $283B |
| 30 | INTEL CORP | 🇺🇸 United States | Technology | $261B |
| 31 | ASML HOLDING NV | 🇳🇱 Netherlands | Technology | $255B |
| 32 | TOYOTA MOTOR | 🇯🇵 Japan | Consumer Discretionary | $254B |
| 33 | COMCAST CORP | 🇺🇸 United States | Telecommunications | $248B |
| 34 | VERIZON COMMUNICATIONS | 🇺🇸 United States | Telecommunications | $241B |
| 35 | EXXON MOBIL CORP | 🇺🇸 United States | Energy | $236B |
| 36 | NETFLIX INC | 🇺🇸 United States | Consumer Discretionary | $231B |
| 37 | ADOBE INC | 🇺🇸 United States | Technology | $228B |
| 38 | COCA-COLA CO | 🇺🇸 United States | Consumer Staples | $227B |
| 39 | MEITUAN | 🇨🇳 China | Technology | $226B |
| 40 | PING AN | 🇨🇳 China | Financials | $219B |
| 41 | CISCO SYSTEMS | 🇺🇸 United States | Telecommunications | $218B |
| 42 | AT&T INC | 🇺🇸 United States | Financials | $216B |
| 43 | L'OREAL | 🇫🇷 France | Consumer Discretionary | $215B |
| 44 | CHINA CONSTRUCTION BANK | 🇨🇳 China | Financials | $213B |
| 45 | ABBOTT LABS | 🇺🇸 United States | Health Care | $212B |
| 46 | NOVARTIS AG | 🇨🇭 Switzerland | Health Care | $212B |
| 47 | NIKE INC | 🇺🇸 United States | Consumer Discretionary | $209B |
| 48 | ORACLE CORP | 🇺🇸 United States | Technology | $202B |
| 49 | PFIZER INC | 🇺🇸 United States | Health Care | $202B |
| 50 | CHEVRON CORP | 🇺🇸 United States | Oil & Gas | $202B |
| 51 | CHINA MERCH | 🇨🇳 China | Financials | $196B |
| 52 | PEPSICO INC | 🇺🇸 United States | Consumer Staples | $195B |
| 53 | SALESFORCE.COM | 🇺🇸 United States | Technology | $195B |
| 54 | MERCK & CO | 🇺🇸 United States | Health Care | $195B |
| 55 | ABBVIE INC | 🇺🇸 United States | Health Care | $191B |
| 56 | BROADCOM INC | 🇺🇸 United States | Technology | $189B |
| 57 | PROSUS NV | 🇳🇱 Netherlands | Technology | $181B |
| 58 | RELIANCE INDS | 🇮🇳 India | Energy | $180B |
| 59 | THERMO FISHER | 🇺🇸 United States | Health Care | $180B |
| 60 | ELI LILLY & CO | 🇺🇸 United States | Health Care | $179B |
| 61 | AGRICULTURAL BANK OF CHINA | 🇨🇳 China | Financials | $178B |
| 62 | SOFTBANK GROUP | 🇯🇵 Japan | Telecommunications | $176B |
| 63 | ACCENTURE PLC | 🇮🇪 Ireland | Industrials | $176B |
| 64 | TEXAS INSTRUMENT | 🇺🇸 United States | Technology | $174B |
| 65 | MCDONALDS CORP | 🇺🇸 United States | Consumer Discretionary | $167B |
| 66 | VOLKSWAGEN AG | 🇩🇪 Germany | Consumer Discretionary | $165B |
| 67 | BHP GROUP LTD | 🇦🇺 Australia | Basic Materials | $163B |
| 68 | WELLS FARGO & CO | 🇺🇸 United States | Financials | $162B |
| 69 | TATA CONSULTANCY | 🇮🇳 India | Technology | $161B |
| 70 | DANAHER CORP | 🇺🇸 United States | Health Care | $160B |
| 71 | NOVO NORDISK | 🇩🇰 Denmark | Health Care | $160B |
| 72 | MEDTRONIC PLC | 🇮🇪 Ireland | Health Care | $159B |
| 73 | WULIANGYE YIBI | 🇨🇳 China | Consumer Staples | $159B |
| 74 | COSTCO WHOLESALE | 🇺🇸 United States | Consumer Discretionary | $156B |
| 75 | T-MOBILE US INC | 🇺🇸 United States | Telecommunications | $156B |
| 76 | CITIGROUP INC | 🇺🇸 United States | Financials | $152B |
| 77 | HONEYWELL INTL | 🇺🇸 United States | Industrials | $151B |
| 78 | QUALCOMM INC | 🇺🇸 United States | Technology | $151B |
| 79 | SAP SE | 🇩🇪 Germany | Technology | $151B |
| 80 | BOEING CO | 🇺🇸 United States | Industrials | $149B |
| 81 | ROYAL DUTCH SHELL | 🇳🇱 Netherlands | Oil & Gas | $148B |
| 82 | NEXTERA ENERGY | 🇺🇸 United States | Utilities | $148B |
| 83 | UNITED PARCEL | 🇺🇸 United States | Industrials | $148B |
| 84 | UNION PAC CORP | 🇺🇸 United States | Industrials | $148B |
| 85 | UNILEVER PLC | 🇬🇧 United Kingdom | Consumer Staples | $147B |
| 86 | AIA | 🇭🇰 Hong Kong SAR | Financials | $147B |
| 87 | LINDE PLC | 🇬🇧 United Kingdom | Basic Materials | $146B |
| 88 | AMGEN INC | 🇺🇸 United States | Health Care | $144B |
| 89 | BRISTOL-MYER SQB | 🇺🇸 United States | Health Care | $141B |
| 90 | SIEMENS AG | 🇩🇪 Germany | Industrials | $140B |
| 91 | BANK OF CHINA | 🇨🇳 China | Financials | $139B |
| 92 | PHILIP MORRIS INC | 🇺🇸 United States | Consumer Staples | $138B |
| 93 | LOWE'S COS INC | 🇺🇸 United States | Consumer Discretionary | $136B |
| 94 | CHARTER COMMUNICATIONS | 🇺🇸 United States | Telecommunications | $135B |
| 95 | CHINA MOBILE | 🇭🇰 Hong Kong SAR | Telecommunications | $134B |
| 96 | SONY GROUP CORP | 🇯🇵 Japan | Consumer Discretionary | $132B |
| 97 | ASTRAZENECA PLC | 🇬🇧 United Kingdom | Health Care | $131B |
| 98 | ROYAL BANK OF CANADA | 🇨🇦 Canada | Financials | $131B |
| 99 | STARBUCKS CORP | 🇺🇸 United States | Consumer Discretionary | $129B |
| 100 | ANHEUSER-BUSCH | 🇧🇪 Belgium | Consumer Staples | $128B |
Note: Data as of March 31, 2021.
Within the ranking, there was a wide disparity in value. Apple was worth over $2 trillion, more than 16 times that of Anheuser-Busch (AB InBev), which took the 100th spot at $128 billion.
In total, 59 companies were headquartered in the United States, making up 65% of the top 100’s total market capitalization. China and its regions was the second most common location for company headquarters, with 14 companies on the list.
Risers and Fallers
What are some of the notable changes to the biggest companies in the world compared to last year’s ranking?
Tesla’s market capitalization surged by an eye-watering 565%, temporarily making Elon Musk the richest person in the world. Food delivery platform Meituan and PayPal benefited from growing e-commerce popularity with their market capitalizations growing by 221% and 151% respectively.
Tech companies TSMC and ASML Holdings were also among the top 10 risers, thanks to a shortage of semiconductor chips and growing demand.
On the other end of the scale, Swiss companies Nestlé, Novartis, and Roche Holding were all among the bottom 10 companies by market capitalization growth. China Mobile was the only company to decline with a -12% change. The company was delisted from the New York Stock Exchange as a result of an executive order issued by former president Donald Trump, and recently announced its intention to list on the Shanghai Stock Exchange.
A Sector View
Across the 100 biggest companies in the world, some sectors had higher weightings.
| Sector | Total Market Cap in Top 100 | % of Top 100 Market Cap | Number of Companies in Top 100 |
|---|---|---|---|
| Technology | $10.5T | 33.0% | 20 |
| Consumer Discretionary | $6.0T | 18.9% | 17 |
| Financials | $3.4T | 10.8% | 14 |
| Health Care | $3.3T | 10.5% | 16 |
| Energy | $2.7T | 8.5% | 5 |
| Consumer Staples | $2.0T | 6.4% | 9 |
| Industrials | $2.0T | 6.4% | 9 |
| Telecommunications | $1.3T | 4.1% | 7 |
| Basic Materials | $0.3T | 1.0% | 2 |
| Utilities | $0.1T | 0.5% | 1 |
Technology had the highest market capitalization and was also the most common sector, with Big Tech dominating the top 10. Companies in the consumer discretionary, financials, and health care sectors also had a strong representation in the ranking.
Despite having only five companies on the list, the energy sector amounted to almost 10% of the top 100’s market capitalization, mostly due to Saudi Aramco’s whopping valuation.
An Uncertain Recovery
From near market lows on March 31, 2020, all sectors saw increases in their market capitalization. However, top 100 companies in some sectors outperformed their respective industry index, while others did not.
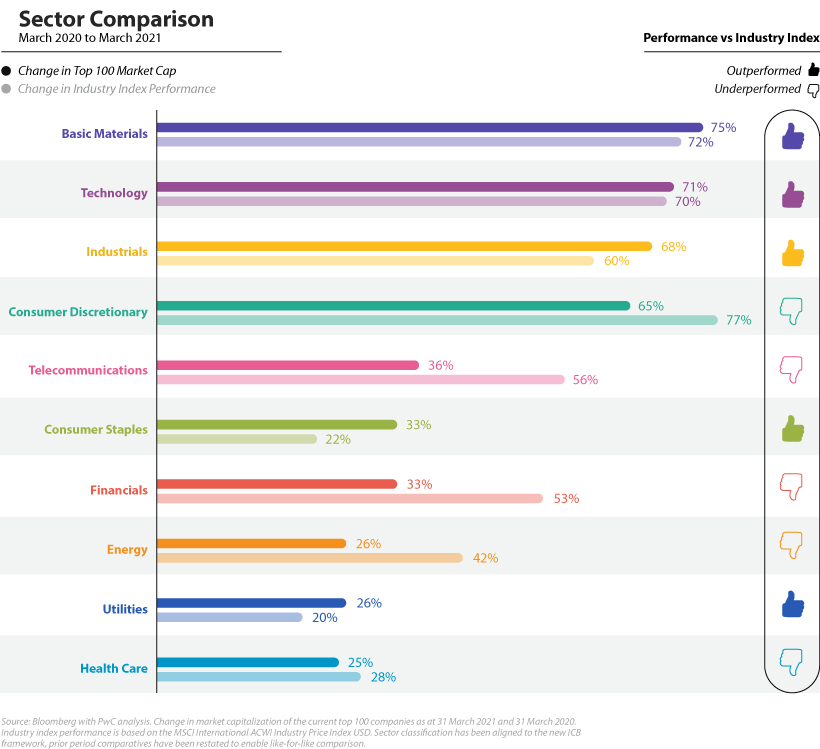
Basic materials and industrials, both cyclical sectors, were high performers in the top 100 and outperformed their respective industry indexes. Technology companies also outperformed, and accounted for $255 billion or 31% of all shareholder distributions by the top 100, far more than any other sector. Apple alone spent $73 billion on share buybacks and $14 billion in dividends in the 2020 calendar year.
On the other hand, the worst-performing sectors in the top 100 were health care, utilities, and energy. While the index performance for health care and utilities was also relatively poor, the wider energy sector performed fairly well.
It’s perhaps not surprising that all sectors saw positive returns since their low levels in March 2020, buoyed by fiscal stimulus and central bank policies. As countries begin to reopen, will the value of the biggest companies in the world continue to climb?


Markets
Ranked: The Largest U.S. Corporations by Number of Employees
We visualized the top U.S. companies by employees, revealing the massive scale of retailers like Walmart, Target, and Home Depot.


The Largest U.S. Corporations by Number of Employees
This was originally posted on our Voronoi app. Download the app for free on Apple or Android and discover incredible data-driven charts from a variety of trusted sources.
Revenue and profit are common measures for measuring the size of a business, but what about employee headcount?
To see how big companies have become from a human perspective, we’ve visualized the top U.S. companies by employees. These figures come from companiesmarketcap.com, and were accessed in March 2024. Note that this ranking includes publicly-traded companies only.
Data and Highlights
The data we used to create this list of largest U.S. corporations by number of employees can be found in the table below.
| Company | Sector | Number of Employees |
|---|---|---|
| Walmart | Consumer Staples | 2,100,000 |
| Amazon | Consumer Discretionary | 1,500,000 |
| UPS | Industrials | 500,000 |
| Home Depot | Consumer Discretionary | 470,000 |
| Concentrix | Information Technology | 440,000 |
| Target | Consumer Staples | 440,000 |
| Kroger | Consumer Staples | 430,000 |
| UnitedHealth | Health Care | 400,000 |
| Berkshire Hathaway | Financials | 383,000 |
| Starbucks | Consumer Discretionary | 381,000 |
| Marriott International | Consumer Discretionary | 377,000 |
| Cognizant | Information Technology | 346,600 |
Retail and Logistics Top the List
Companies like Walmart, Target, and Kroger have a massive headcount due to having many locations spread across the country, which require everything from cashiers to IT professionals.
Moving goods around the world is also highly labor intensive, explaining why UPS has half a million employees globally.
Below the Radar?
Two companies that rank among the largest U.S. corporations by employees which may be less familiar to the public include Concentrix and Cognizant. Both of these companies are B2B brands, meaning they primarily work with other companies rather than consumers. This contrasts with brands like Amazon or Home Depot, which are much more visible among average consumers.
A Note on Berkshire Hathaway
Warren Buffett’s company doesn’t directly employ 383,000 people. This headcount actually includes the employees of the firm’s many subsidiaries, such as GEICO (insurance), Dairy Queen (retail), and Duracell (batteries).
If you’re curious to see how Buffett’s empire has grown over the years, check out this animated graphic that visualizes the growth of Berkshire Hathaway’s portfolio from 1994 to 2022.

-

 Markets2 weeks ago
America’s Top Companies by Revenue (1994 vs. 2023)
-

 Environment2 weeks ago
Ranked: Top Countries by Total Forest Loss Since 2001
-

 Real Estate2 weeks ago
Visualizing America’s Shortage of Affordable Homes
-

 Maps2 weeks ago
Mapped: Average Wages Across Europe
-

 Mining2 weeks ago
Charted: The Value Gap Between the Gold Price and Gold Miners
-

 Demographics2 weeks ago
Visualizing the Size of the Global Senior Population
-

 Misc2 weeks ago
Tesla Is Once Again the World’s Best-Selling EV Company
-

 Technology2 weeks ago
Ranked: The Most Popular Smartphone Brands in the U.S.