Markets
The Biggest Business Risks in 2021


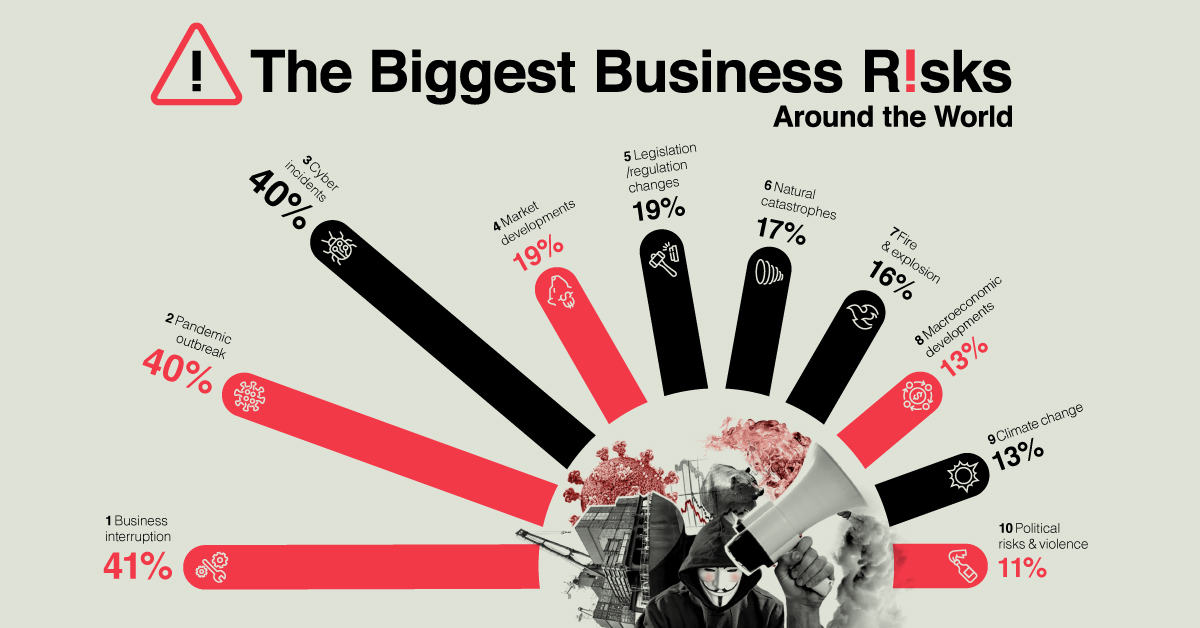
The Biggest Business Risks Around the World
We live in an increasingly volatile world, where change is the only constant.
Businesses, too, face rapidly changing environments and associated risks that they need to adapt to—or risk falling behind. These can range from supply chain issues due to shipping blockages, to disruptions from natural catastrophes.
As countries and companies continue to grapple with the effects of the pandemic, nearly 3,000 risk management experts were surveyed for the Allianz Risk Barometer, uncovering the top 10 business risks that leaders must watch out for in 2021.
The Top 10 Business Risks: The Pandemic Trio Emerges
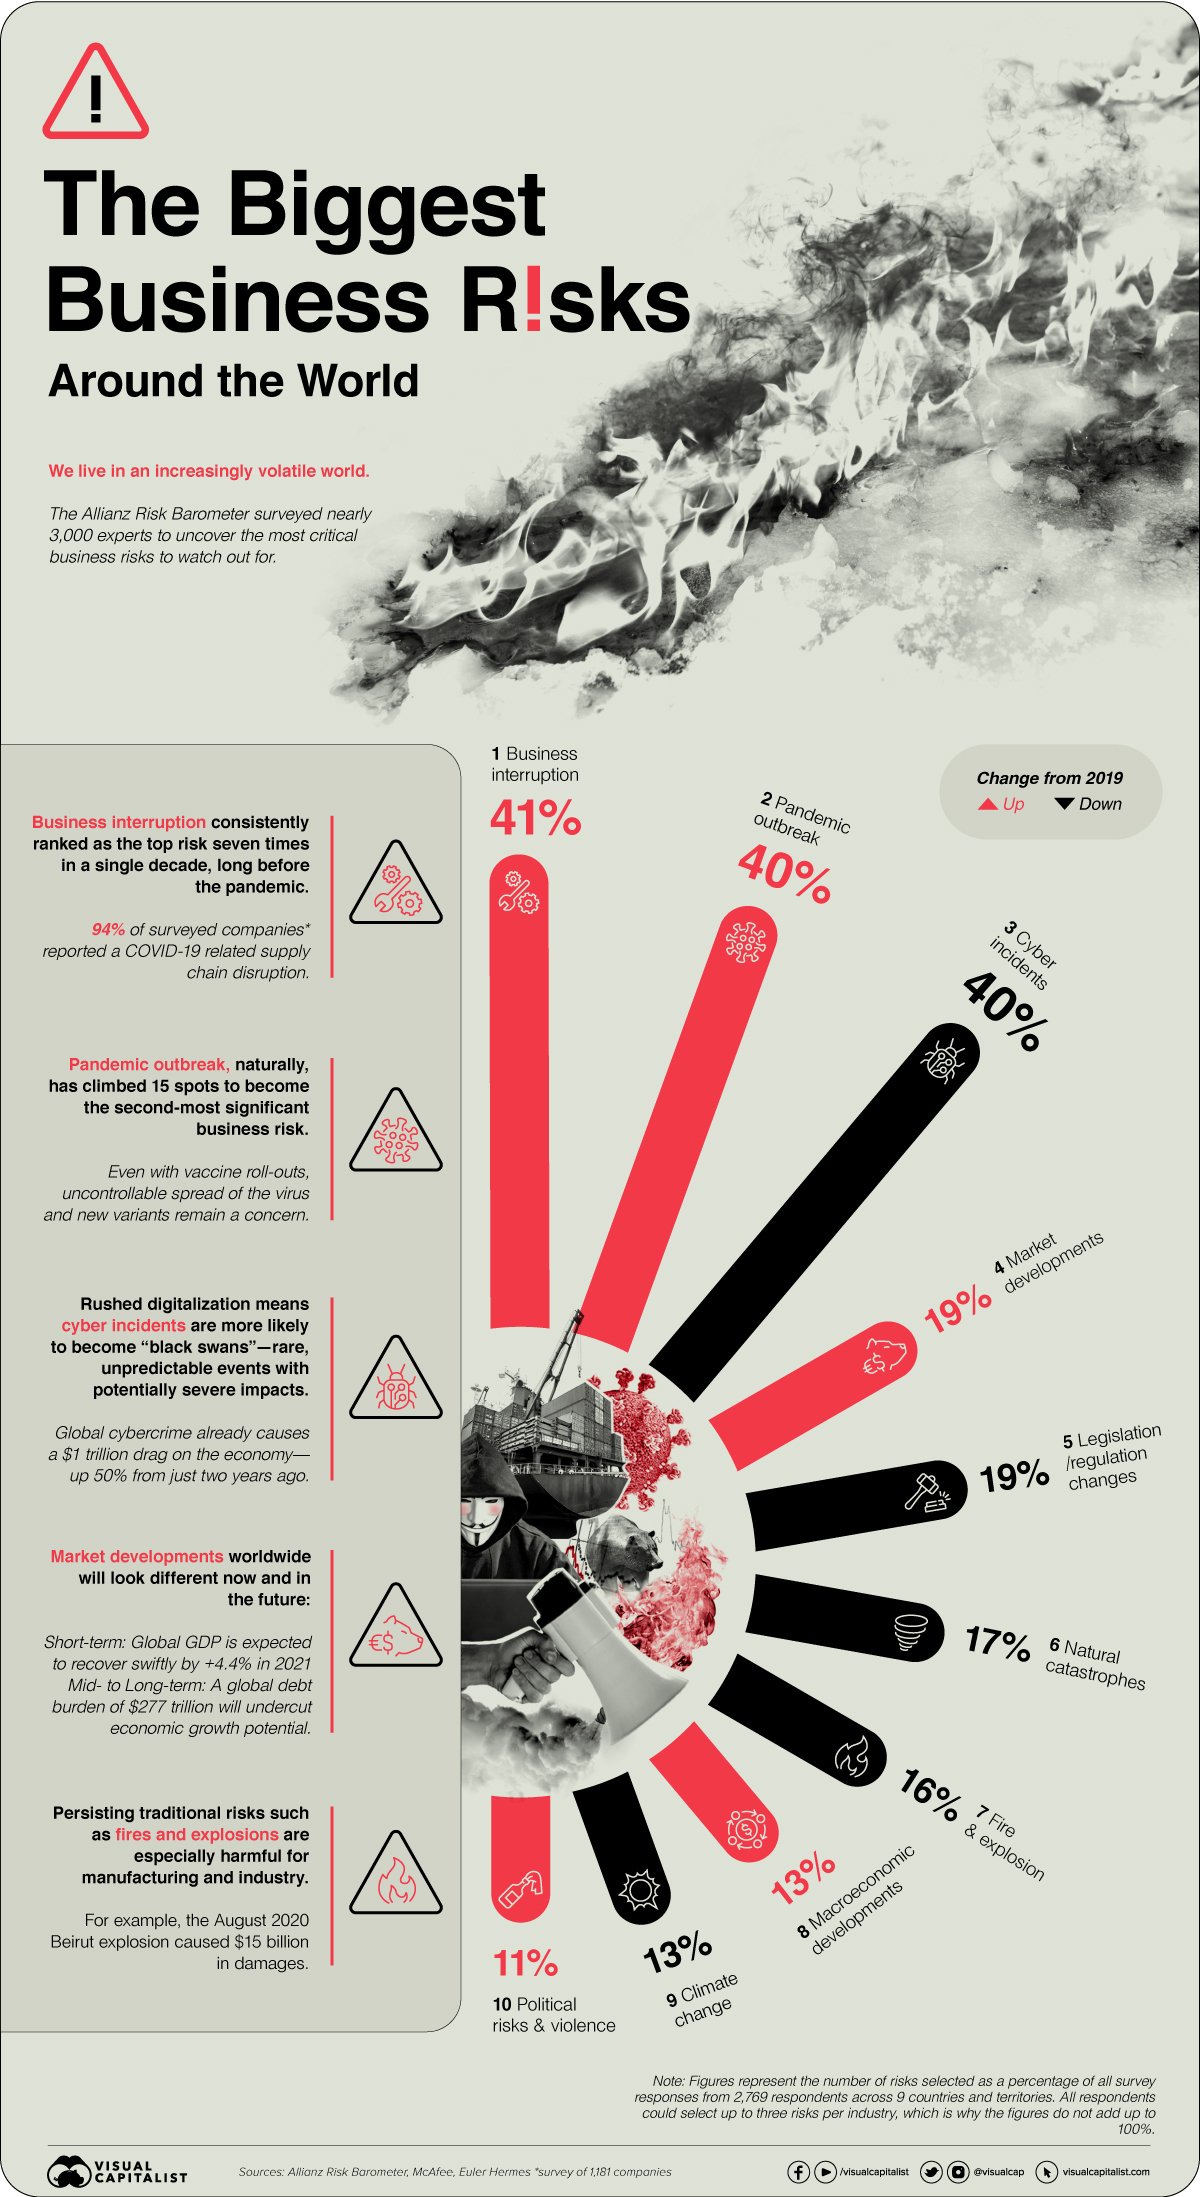
Business Interruption tops the charts consistently as the biggest business risk. This risk has slotted into the #1 spot seven times in the last decade of the survey, showing it has been on the minds of business leaders well before the pandemic began.
However, that is not to say that the pandemic hasn’t made awareness of this risk more acute. In fact, 94% of surveyed companies reported a COVID-19 related supply chain disruption in 2020.
| Rank (2021) | % Responses | Risk Name | Business Risk Examples | Change from 2020 |
|---|---|---|---|---|
| #1 | 41% | Business Interruption | Supply chain disruptions | ↑ |
| #2 | 40% | Pandemic Outbreak | Health and workforce issues, restrictions on movement | ↑ |
| #3 | 40% | Cyber Incidents | Cybercrime, IT failure/outage, data breaches, fines and penalties | ↓ |
| #4 | 19% | Market Developments | Volatility, intensified competition/new entrants, M&A, market stagnation, market fluctuation | ↑ |
| #5 | 19% | Legislation/ Regulation Changes | Trade wars and tariffs, economic sanctions, protectionism, Brexit, Euro-zone disintegration | ↓ |
| #6 | 17% | Natural Catastrophes | Storm, flood, earthquake, wildfire | ↓ |
| #7 | 16% | Fire, Explosion | - | ↓ |
| #8 | 13% | Macroeconomic Developments | Monetary policies, austerity programs, commodity price increase, deflation, inflation | ↑ |
| #9 | 13% | Climate Change | - | ↓ |
| #10 | 11% | Political Risks And Violence | Political instability, war, terrorism, civil commotion, riots and looting | ↑ |
Note: Figures do not add to 100% as respondents could select up to three risks per industry.
Pandemic Outbreak, naturally, has climbed 15 spots to become the second-most significant business risk. Even with vaccine roll-outs, the uncontrollable spread of the virus and new variants remain a concern.
The third most prominent business risk, Cyber Incidents, are also on the rise. Global cybercrime already causes a $1 trillion drag on the economy—a 50% jump from just two years ago. In addition, the pandemic-induced rush towards digitalization leaves businesses increasingly susceptible to cyber incidents.
Other Socio-Economic Business Risks
The top three risks mentioned above are considered the “pandemic trio”, owing to their inextricable and intertwined effects on the business world. However, these next few notable business risks are also not far behind.
Globally, GDP is expected to recover by +4.4% in 2021, compared to the -4.5% contraction from 2020. These Market Developments may also see a short-term 2 percentage point increase in GDP growth estimates in the event of rapid and successful vaccination campaigns.
In the long term, however, the world will need to contend with a record of $277 trillion worth of debt, which may potentially affect these economic growth projections. Rising insolvency rates also remain a key post-COVID concern.
Persisting traditional risks such as Fires and Explosions are especially damaging for manufacturing and industry. For example, the August 2020 Beirut explosion caused $15 billion in damages.
What’s more, Political Risks And Violence have escalated in number, scale, and duration worldwide in the form of civil unrest and protests. Such disruption is often underestimated, but insured losses can add up into the billions.
No Such Thing as a Risk-Free Life
The risks that businesses face depend on a multitude of factors, from political (in)stability and growing regulations to climate change and macroeconomic shifts.
Will a post-pandemic world accentuate these global business risks even further, or will something entirely new rear its head?


Markets
U.S. Debt Interest Payments Reach $1 Trillion
U.S. debt interest payments have surged past the $1 trillion dollar mark, amid high interest rates and an ever-expanding debt burden.


U.S. Debt Interest Payments Reach $1 Trillion
This was originally posted on our Voronoi app. Download the app for free on iOS or Android and discover incredible data-driven charts from a variety of trusted sources.
The cost of paying for America’s national debt crossed the $1 trillion dollar mark in 2023, driven by high interest rates and a record $34 trillion mountain of debt.
Over the last decade, U.S. debt interest payments have more than doubled amid vast government spending during the pandemic crisis. As debt payments continue to soar, the Congressional Budget Office (CBO) reported that debt servicing costs surpassed defense spending for the first time ever this year.
This graphic shows the sharp rise in U.S. debt payments, based on data from the Federal Reserve.
A $1 Trillion Interest Bill, and Growing
Below, we show how U.S. debt interest payments have risen at a faster pace than at another time in modern history:
| Date | Interest Payments | U.S. National Debt |
|---|---|---|
| 2023 | $1.0T | $34.0T |
| 2022 | $830B | $31.4T |
| 2021 | $612B | $29.6T |
| 2020 | $518B | $27.7T |
| 2019 | $564B | $23.2T |
| 2018 | $571B | $22.0T |
| 2017 | $493B | $20.5T |
| 2016 | $460B | $20.0T |
| 2015 | $435B | $18.9T |
| 2014 | $442B | $18.1T |
| 2013 | $425B | $17.2T |
| 2012 | $417B | $16.4T |
| 2011 | $433B | $15.2T |
| 2010 | $400B | $14.0T |
| 2009 | $354B | $12.3T |
| 2008 | $380B | $10.7T |
| 2007 | $414B | $9.2T |
| 2006 | $387B | $8.7T |
| 2005 | $355B | $8.2T |
| 2004 | $318B | $7.6T |
| 2003 | $294B | $7.0T |
| 2002 | $298B | $6.4T |
| 2001 | $318B | $5.9T |
| 2000 | $353B | $5.7T |
| 1999 | $353B | $5.8T |
| 1998 | $360B | $5.6T |
| 1997 | $368B | $5.5T |
| 1996 | $362B | $5.3T |
| 1995 | $357B | $5.0T |
| 1994 | $334B | $4.8T |
| 1993 | $311B | $4.5T |
| 1992 | $306B | $4.2T |
| 1991 | $308B | $3.8T |
| 1990 | $298B | $3.4T |
| 1989 | $275B | $3.0T |
| 1988 | $254B | $2.7T |
| 1987 | $240B | $2.4T |
| 1986 | $225B | $2.2T |
| 1985 | $219B | $1.9T |
| 1984 | $205B | $1.7T |
| 1983 | $176B | $1.4T |
| 1982 | $157B | $1.2T |
| 1981 | $142B | $1.0T |
| 1980 | $113B | $930.2B |
| 1979 | $96B | $845.1B |
| 1978 | $84B | $789.2B |
| 1977 | $69B | $718.9B |
| 1976 | $61B | $653.5B |
| 1975 | $55B | $576.6B |
| 1974 | $50B | $492.7B |
| 1973 | $45B | $469.1B |
| 1972 | $39B | $448.5B |
| 1971 | $36B | $424.1B |
| 1970 | $35B | $389.2B |
| 1969 | $30B | $368.2B |
| 1968 | $25B | $358.0B |
| 1967 | $23B | $344.7B |
| 1966 | $21B | $329.3B |
Interest payments represent seasonally adjusted annual rate at the end of Q4.
At current rates, the U.S. national debt is growing by a remarkable $1 trillion about every 100 days, equal to roughly $3.6 trillion per year.
As the national debt has ballooned, debt payments even exceeded Medicaid outlays in 2023—one of the government’s largest expenditures. On average, the U.S. spent more than $2 billion per day on interest costs last year. Going further, the U.S. government is projected to spend a historic $12.4 trillion on interest payments over the next decade, averaging about $37,100 per American.
Exacerbating matters is that the U.S. is running a steep deficit, which stood at $1.1 trillion for the first six months of fiscal 2024. This has accelerated due to the 43% increase in debt servicing costs along with a $31 billion dollar increase in defense spending from a year earlier. Additionally, a $30 billion increase in funding for the Federal Deposit Insurance Corporation in light of the regional banking crisis last year was a major contributor to the deficit increase.
Overall, the CBO forecasts that roughly 75% of the federal deficit’s increase will be due to interest costs by 2034.

-

 Real Estate2 weeks ago
Visualizing America’s Shortage of Affordable Homes
-

 Technology1 week ago
Ranked: Semiconductor Companies by Industry Revenue Share
-

 Money1 week ago
Which States Have the Highest Minimum Wage in America?
-

 Real Estate1 week ago
Ranked: The Most Valuable Housing Markets in America
-

 Business2 weeks ago
Charted: Big Four Market Share by S&P 500 Audits
-

 AI2 weeks ago
The Stock Performance of U.S. Chipmakers So Far in 2024
-

 Misc2 weeks ago
Almost Every EV Stock is Down After Q1 2024
-

 Money2 weeks ago
Where Does One U.S. Tax Dollar Go?