Markets
The Big Pharma Takeover of Medical Cannabis

The Big Pharma Takeover of Medical Cannabis
As evidence of cannabis’ many benefits mounts, so does the interest from the global pharmaceutical industry, known as Big Pharma. The entrance of such behemoths will radically transform the cannabis industry—once heavily stigmatized, it is now a potentially game-changing source of growth for countless companies.
Today’s infographic comes to us from CB2 Insights, and explores how and why the notorious Big Pharma are interested in the nascent cannabis industry.
Who are “Big Pharma”?
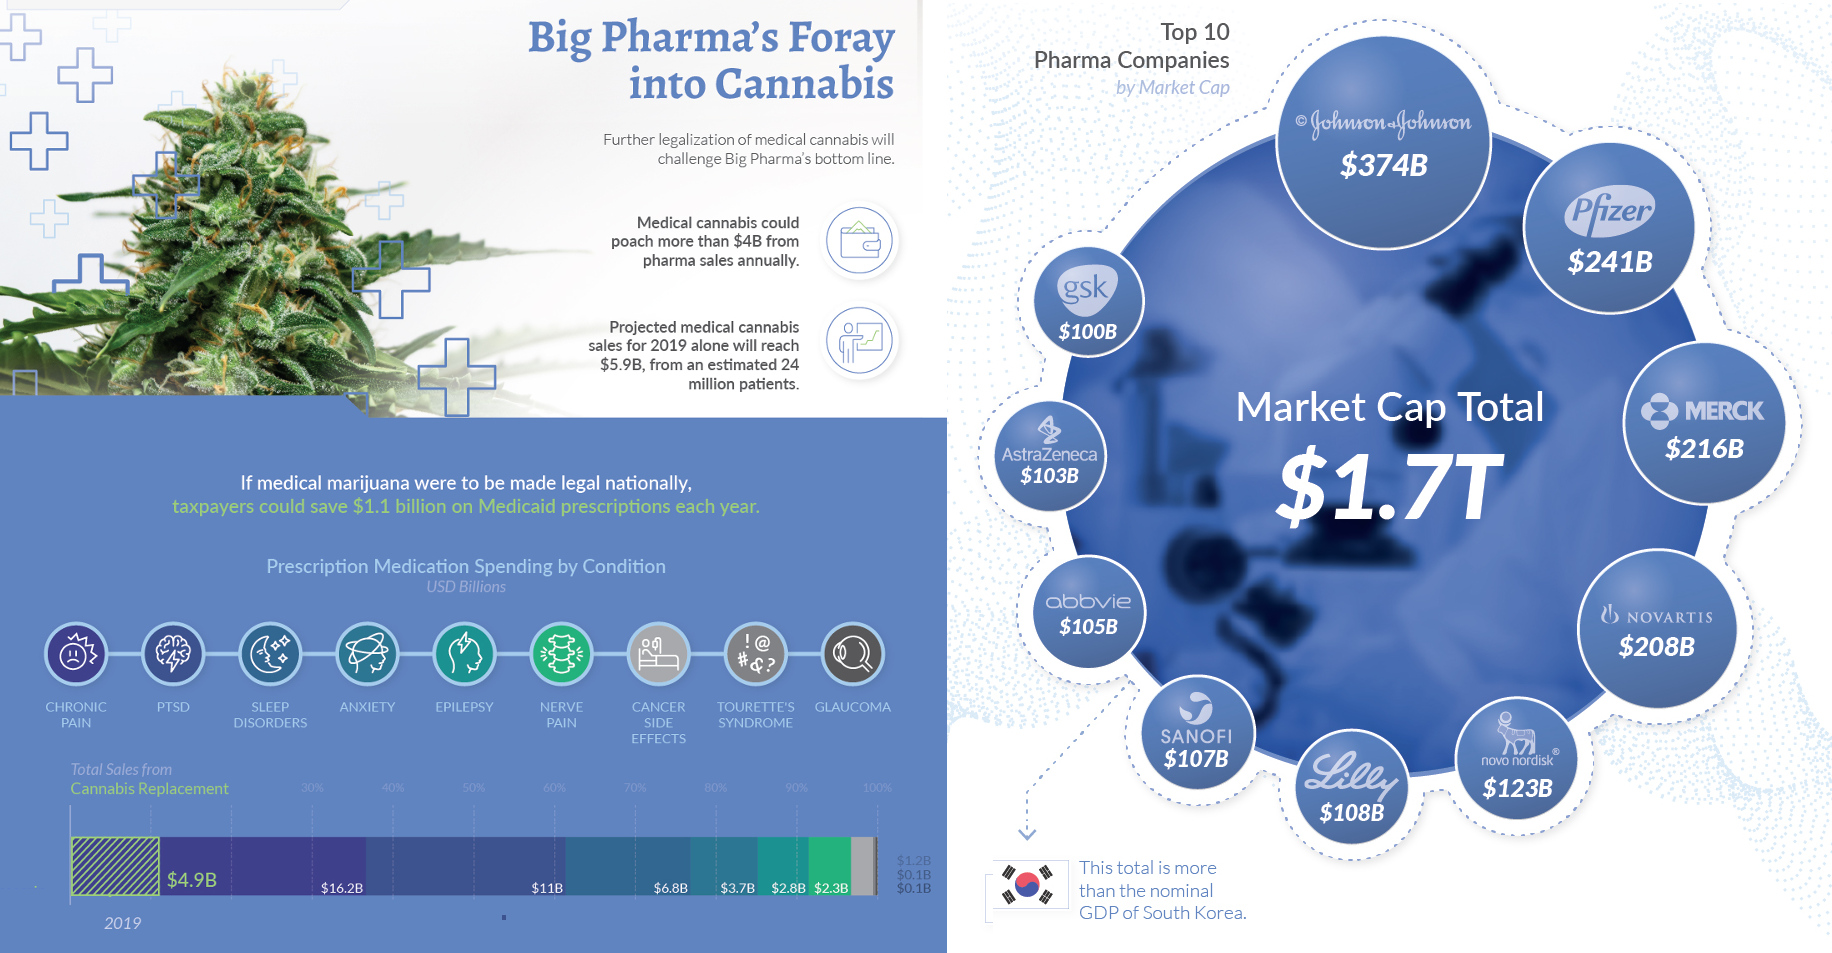
The term refers to some of the largest pharmaceutical companies in the world, considered especially influential as a group. To give a sense of their sheer size, the market cap of the top 10 Big Pharma companies is $1.7 trillion—Johnson & Johnson being the largest, with a market capitalization of $374 billion.
So far, Big Pharma has watched the cannabis industry from the sidelines, deterred by regulatory concerns. What we are seeing now is the sleeping giant’s takeover slowly intensifying as more patents, partnerships, and sponsored clinical trials come to fruition.
Could Cannabis be Sold Over the Counter?
The cannabis plant has been used in medicine for 6,000 years. However, there is still considerable debate around the role it plays in healthcare today. There are currently almost 400 active and completed clinical trials worldwide surrounding cannabidiol (CBD), a type of cannabinoid that makes up 40% of the cannabis plant’s extract.
Cannabis relies on CBD’s therapeutic properties, and recent studies suggest it may be useful in combating a variety of health conditions, such as:
- Epilepsy
- Schizophrenia
- Multiple sclerosis
- Migraines
- Arthritis
- Cancer side effects
As of 2019, 33 states and the District of Columbia have legalized cannabis for medical use. Its potential for pain management has led some experts to recommend it as an alternative to addictive painkillers, with one study of 13 states showing opiate-related deaths decreasing by over 33% in the six years since medical cannabis was legalized.
As the industry evolves, data is becoming increasingly important in understanding the potential of cannabis—both as a viable medical treatment, and as a recreational product. The shift away from anecdotal evidence towards big data will inform future policies, and give rise to a new era of consumer education.
Big Pharma’s Foray into Cannabis
Further legalization of cannabis will challenge Big Pharma’s bottom line, and poach more than $4 billion from pharma sales annually. In fact, medical cannabis sales are projected to reach $5.9 billion in 2019, from an estimated 24 million patients.
Seven of Canada’s top 10 cannabis patent holders are major multinational pharmaceutical companies, a trend that is not unique to Canada.
| Company Rank | 🇨🇦 Canadian Patents | Company Rank | 🇺🇸 U.S. Patents |
|---|---|---|---|
| 1. Novartis | 21 | 1. Abbvie | 59 |
| 2. Pfizer | 14 | 2. Sanofie | 39 |
| 3. GW Pharmaceuticals | 13 | 3. Merck | 35 |
| 4. Ericsson | 13 | 4. Bristol-Myers Squibb | 34 |
| 5. Merck | 11 | 5. GW Pharmaceuticals | 28 |
| 6. Solvay Pharmaceuticals | 7 | 6. Pfizer | 25 |
| 7. Kao Corporation | 7 | 7. Hebrew University of Jerusalem | 19 |
| 8. Ogeda SA | 7 | 8. Roche | 17 |
| 9. Sanofi | 6 | 9. University of Connecticut | 16 |
| 10. University of Connecticut | 6 | 10. U.S. Health and Human Services | 13 |
It comes as no surprise that many pharmaceutical giants have already formed strong partnerships with cannabis companies, such as Novartis and Tilray, who will develop and distribute medical cannabis together in legal jurisdictions around the world.
Data is the Missing Link
While the body of knowledge about the many uses of cannabis continue to grow, clinical evidence is key for widespread adoption.
Products backed by data will be a defining criteria for major companies to come into the market en masse. And ultimately, Big Pharma’s entry could accelerate public understanding and confidence in cannabis as a viable option for a range of ailments, and mark the next major milestone for the industry.


Markets
U.S. Debt Interest Payments Reach $1 Trillion
U.S. debt interest payments have surged past the $1 trillion dollar mark, amid high interest rates and an ever-expanding debt burden.


U.S. Debt Interest Payments Reach $1 Trillion
This was originally posted on our Voronoi app. Download the app for free on iOS or Android and discover incredible data-driven charts from a variety of trusted sources.
The cost of paying for America’s national debt crossed the $1 trillion dollar mark in 2023, driven by high interest rates and a record $34 trillion mountain of debt.
Over the last decade, U.S. debt interest payments have more than doubled amid vast government spending during the pandemic crisis. As debt payments continue to soar, the Congressional Budget Office (CBO) reported that debt servicing costs surpassed defense spending for the first time ever this year.
This graphic shows the sharp rise in U.S. debt payments, based on data from the Federal Reserve.
A $1 Trillion Interest Bill, and Growing
Below, we show how U.S. debt interest payments have risen at a faster pace than at another time in modern history:
| Date | Interest Payments | U.S. National Debt |
|---|---|---|
| 2023 | $1.0T | $34.0T |
| 2022 | $830B | $31.4T |
| 2021 | $612B | $29.6T |
| 2020 | $518B | $27.7T |
| 2019 | $564B | $23.2T |
| 2018 | $571B | $22.0T |
| 2017 | $493B | $20.5T |
| 2016 | $460B | $20.0T |
| 2015 | $435B | $18.9T |
| 2014 | $442B | $18.1T |
| 2013 | $425B | $17.2T |
| 2012 | $417B | $16.4T |
| 2011 | $433B | $15.2T |
| 2010 | $400B | $14.0T |
| 2009 | $354B | $12.3T |
| 2008 | $380B | $10.7T |
| 2007 | $414B | $9.2T |
| 2006 | $387B | $8.7T |
| 2005 | $355B | $8.2T |
| 2004 | $318B | $7.6T |
| 2003 | $294B | $7.0T |
| 2002 | $298B | $6.4T |
| 2001 | $318B | $5.9T |
| 2000 | $353B | $5.7T |
| 1999 | $353B | $5.8T |
| 1998 | $360B | $5.6T |
| 1997 | $368B | $5.5T |
| 1996 | $362B | $5.3T |
| 1995 | $357B | $5.0T |
| 1994 | $334B | $4.8T |
| 1993 | $311B | $4.5T |
| 1992 | $306B | $4.2T |
| 1991 | $308B | $3.8T |
| 1990 | $298B | $3.4T |
| 1989 | $275B | $3.0T |
| 1988 | $254B | $2.7T |
| 1987 | $240B | $2.4T |
| 1986 | $225B | $2.2T |
| 1985 | $219B | $1.9T |
| 1984 | $205B | $1.7T |
| 1983 | $176B | $1.4T |
| 1982 | $157B | $1.2T |
| 1981 | $142B | $1.0T |
| 1980 | $113B | $930.2B |
| 1979 | $96B | $845.1B |
| 1978 | $84B | $789.2B |
| 1977 | $69B | $718.9B |
| 1976 | $61B | $653.5B |
| 1975 | $55B | $576.6B |
| 1974 | $50B | $492.7B |
| 1973 | $45B | $469.1B |
| 1972 | $39B | $448.5B |
| 1971 | $36B | $424.1B |
| 1970 | $35B | $389.2B |
| 1969 | $30B | $368.2B |
| 1968 | $25B | $358.0B |
| 1967 | $23B | $344.7B |
| 1966 | $21B | $329.3B |
Interest payments represent seasonally adjusted annual rate at the end of Q4.
At current rates, the U.S. national debt is growing by a remarkable $1 trillion about every 100 days, equal to roughly $3.6 trillion per year.
As the national debt has ballooned, debt payments even exceeded Medicaid outlays in 2023—one of the government’s largest expenditures. On average, the U.S. spent more than $2 billion per day on interest costs last year. Going further, the U.S. government is projected to spend a historic $12.4 trillion on interest payments over the next decade, averaging about $37,100 per American.
Exacerbating matters is that the U.S. is running a steep deficit, which stood at $1.1 trillion for the first six months of fiscal 2024. This has accelerated due to the 43% increase in debt servicing costs along with a $31 billion dollar increase in defense spending from a year earlier. Additionally, a $30 billion increase in funding for the Federal Deposit Insurance Corporation in light of the regional banking crisis last year was a major contributor to the deficit increase.
Overall, the CBO forecasts that roughly 75% of the federal deficit’s increase will be due to interest costs by 2034.

-

 Mining2 weeks ago
Charted: The Value Gap Between the Gold Price and Gold Miners
-

 Real Estate1 week ago
Ranked: The Most Valuable Housing Markets in America
-

 Business1 week ago
Charted: Big Four Market Share by S&P 500 Audits
-

 AI1 week ago
The Stock Performance of U.S. Chipmakers So Far in 2024
-

 Misc1 week ago
Almost Every EV Stock is Down After Q1 2024
-

 Money2 weeks ago
Where Does One U.S. Tax Dollar Go?
-

 Green2 weeks ago
Ranked: Top Countries by Total Forest Loss Since 2001
-

 Real Estate2 weeks ago
Visualizing America’s Shortage of Affordable Homes