Markets
The Anatomy of the $2 Trillion COVID-19 Stimulus Bill
The Anatomy of the $2 Trillion COVID-19 Stimulus Bill
The unprecedented response to the COVID-19 pandemic has prioritized keeping people apart to slow the spread of the virus. While measures such as business closures and travel restrictions are effective at fighting a pandemic, they also have a dramatic impact on the economy.
To help right the ship, the Coronavirus Aid, Relief, and Economic Security Act — also known as the CARES Act — was passed by U.S. lawmakers last week with little fanfare. The act became the largest economic stimulus bill in modern history, more than doubling the stimulus act passed in 2009 during the Financial Crisis.
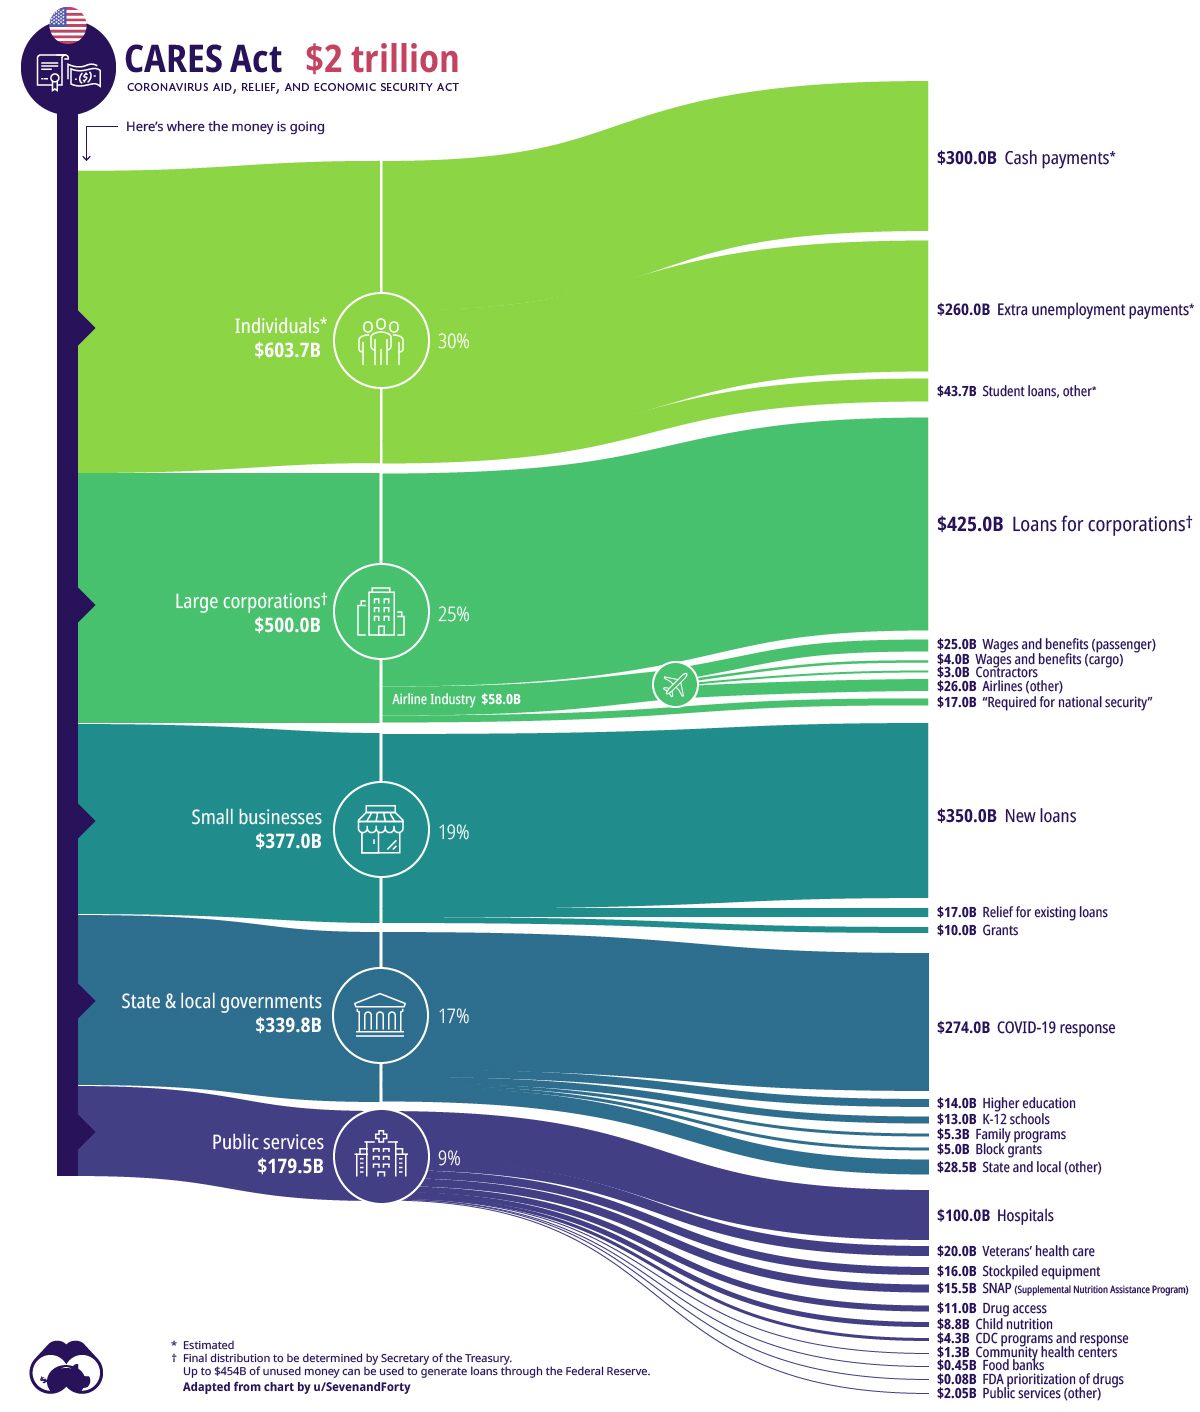
Today’s Sankey diagram is a visual representation of where the $2 trillion will be spent. Broadly speaking, there are five components to the COVID-19 stimulus bill:
| Category | Total Amount | Share of the Package |
|---|---|---|
| Individuals / Families | $603.7 billion | 30% |
| Big Business | $500.0 billion | 25% |
| Small Business | $377.0 billion | 19% |
| State and Local Government | $340.0 billion | 17% |
| Public Services | $179.5 billion | 9% |
Although the COVID-19 stimulus bill is incredibly complex, here are some of the most important parts to be aware of.
Funds for Individuals
Amount: $603.7 billion – 30% of total CARES Act
In order to stimulate the sputtering economy quickly, the U.S. government will deploy “helicopter money” — direct cash payments to individuals and families.
The centerpiece of this plan is a $1,200 direct payment for those earning up to $75,000 per year. For higher earners, payment amounts will phase out, ending altogether at the $99,000 income level. Families will also receive $500 per child.
There are three other key things to know about this portion of the stimulus funds:
- There will be a temporary suspension for any student loan held by the federal government. This means no payments required and no interest accrued until the end of September, 2020.
- Borrowers with federally backed loans can request forbearance on mortgage payments for up to six months.
- There will be an expansion of unemployment benefits, including a four-month enhancement of benefits. This plan includes freelancers, workers in the gig economy, and furloughed employees.
Big Business
Amount: $500.0 billion – 25% of total CARES Act
This component of the package is aimed at stabilizing big businesses in hard-hit sectors.
The most obvious industry to receive support will be the airlines. About $58 billion has been earmarked for commercial and cargo airlines, as well as airline contractors. Perhaps in response to recent criticism of the industry, companies receiving stimulus money will be barred from engaging in stock buybacks for the term of the loan plus one year.
One interesting pathway highlighted by today’s Sankey diagram is the $17 billion allocated to “maintaining national security”. While this provision doesn’t mention any specific company by name, the primary recipient is believed to be Boeing.
The bill also indicates that an inspector general will oversee the recovery process, along with a special committee.
Small Business
Amount: $377.0 billion – 19% of total CARES Act
To ease the strain on businesses around the country, the Small Business Administration (SBA) will be given $350 billion to provide loans of up to $10 million to qualifying organizations. These funds can be used for mission critical activities, such as paying rent or keeping employees on the payroll during COVID-19 closures.
As well, the bill sets aside $10 billion in grants for small businesses that need help covering short-term operating costs.
State and Local Governments
Amount: $340.0 billion – 17% of total CARES Act
The biggest portion of funds going to local and state governments is the $274 billion allocated towards direct COVID-19 response. The rest of the funds in this component will go to schools and child care services.
Public and Health Services
Amount: $179.5 billion – 9% of total CARES Act
The biggest slice of this pie goes to healthcare providers, who will receive $100 billion in grants to help fight COVID-19. This was a major ask from groups representing the healthcare industry, as they look to make up the lost revenue caused by focusing on the outbreak — as opposed to performing elective surgeries and other procedures. There will also be a 20% increase in Medicare payments for treating patients with the virus.
Money is also set aside for initiatives such as increasing the availability of ventilators and masks for the Strategic National Stockpile, as well as providing additional funding for the Center for Disease Control and expanding the reach of virtual doctors.
Finally, beyond the healthcare-related funding, the CARES Act also addresses food security programs and a long list of educational and arts initiatives.
Hat tip to Reddit user SevenandForty for inspiring this graphic.


Markets
U.S. Debt Interest Payments Reach $1 Trillion
U.S. debt interest payments have surged past the $1 trillion dollar mark, amid high interest rates and an ever-expanding debt burden.


U.S. Debt Interest Payments Reach $1 Trillion
This was originally posted on our Voronoi app. Download the app for free on iOS or Android and discover incredible data-driven charts from a variety of trusted sources.
The cost of paying for America’s national debt crossed the $1 trillion dollar mark in 2023, driven by high interest rates and a record $34 trillion mountain of debt.
Over the last decade, U.S. debt interest payments have more than doubled amid vast government spending during the pandemic crisis. As debt payments continue to soar, the Congressional Budget Office (CBO) reported that debt servicing costs surpassed defense spending for the first time ever this year.
This graphic shows the sharp rise in U.S. debt payments, based on data from the Federal Reserve.
A $1 Trillion Interest Bill, and Growing
Below, we show how U.S. debt interest payments have risen at a faster pace than at another time in modern history:
| Date | Interest Payments | U.S. National Debt |
|---|---|---|
| 2023 | $1.0T | $34.0T |
| 2022 | $830B | $31.4T |
| 2021 | $612B | $29.6T |
| 2020 | $518B | $27.7T |
| 2019 | $564B | $23.2T |
| 2018 | $571B | $22.0T |
| 2017 | $493B | $20.5T |
| 2016 | $460B | $20.0T |
| 2015 | $435B | $18.9T |
| 2014 | $442B | $18.1T |
| 2013 | $425B | $17.2T |
| 2012 | $417B | $16.4T |
| 2011 | $433B | $15.2T |
| 2010 | $400B | $14.0T |
| 2009 | $354B | $12.3T |
| 2008 | $380B | $10.7T |
| 2007 | $414B | $9.2T |
| 2006 | $387B | $8.7T |
| 2005 | $355B | $8.2T |
| 2004 | $318B | $7.6T |
| 2003 | $294B | $7.0T |
| 2002 | $298B | $6.4T |
| 2001 | $318B | $5.9T |
| 2000 | $353B | $5.7T |
| 1999 | $353B | $5.8T |
| 1998 | $360B | $5.6T |
| 1997 | $368B | $5.5T |
| 1996 | $362B | $5.3T |
| 1995 | $357B | $5.0T |
| 1994 | $334B | $4.8T |
| 1993 | $311B | $4.5T |
| 1992 | $306B | $4.2T |
| 1991 | $308B | $3.8T |
| 1990 | $298B | $3.4T |
| 1989 | $275B | $3.0T |
| 1988 | $254B | $2.7T |
| 1987 | $240B | $2.4T |
| 1986 | $225B | $2.2T |
| 1985 | $219B | $1.9T |
| 1984 | $205B | $1.7T |
| 1983 | $176B | $1.4T |
| 1982 | $157B | $1.2T |
| 1981 | $142B | $1.0T |
| 1980 | $113B | $930.2B |
| 1979 | $96B | $845.1B |
| 1978 | $84B | $789.2B |
| 1977 | $69B | $718.9B |
| 1976 | $61B | $653.5B |
| 1975 | $55B | $576.6B |
| 1974 | $50B | $492.7B |
| 1973 | $45B | $469.1B |
| 1972 | $39B | $448.5B |
| 1971 | $36B | $424.1B |
| 1970 | $35B | $389.2B |
| 1969 | $30B | $368.2B |
| 1968 | $25B | $358.0B |
| 1967 | $23B | $344.7B |
| 1966 | $21B | $329.3B |
Interest payments represent seasonally adjusted annual rate at the end of Q4.
At current rates, the U.S. national debt is growing by a remarkable $1 trillion about every 100 days, equal to roughly $3.6 trillion per year.
As the national debt has ballooned, debt payments even exceeded Medicaid outlays in 2023—one of the government’s largest expenditures. On average, the U.S. spent more than $2 billion per day on interest costs last year. Going further, the U.S. government is projected to spend a historic $12.4 trillion on interest payments over the next decade, averaging about $37,100 per American.
Exacerbating matters is that the U.S. is running a steep deficit, which stood at $1.1 trillion for the first six months of fiscal 2024. This has accelerated due to the 43% increase in debt servicing costs along with a $31 billion dollar increase in defense spending from a year earlier. Additionally, a $30 billion increase in funding for the Federal Deposit Insurance Corporation in light of the regional banking crisis last year was a major contributor to the deficit increase.
Overall, the CBO forecasts that roughly 75% of the federal deficit’s increase will be due to interest costs by 2034.

-

 Real Estate2 weeks ago
Visualizing America’s Shortage of Affordable Homes
-

 Technology1 week ago
Ranked: Semiconductor Companies by Industry Revenue Share
-

 Money1 week ago
Which States Have the Highest Minimum Wage in America?
-

 Real Estate1 week ago
Ranked: The Most Valuable Housing Markets in America
-

 Business2 weeks ago
Charted: Big Four Market Share by S&P 500 Audits
-

 AI2 weeks ago
The Stock Performance of U.S. Chipmakers So Far in 2024
-

 Misc2 weeks ago
Almost Every EV Stock is Down After Q1 2024
-

 Money2 weeks ago
Where Does One U.S. Tax Dollar Go?