Markets
The $88 Trillion World Economy in One Chart
Check out the latest 2023 update of global GDP in one chart.
The $88 Trillion World Economy in One Chart
Check out the latest 2023 update of global GDP in one chart.
The global economy can seem like an abstract concept, yet it influences our everyday lives in both obvious and subtle ways. Nowhere is this clearer than in the current economic state amid the throes of the pandemic.
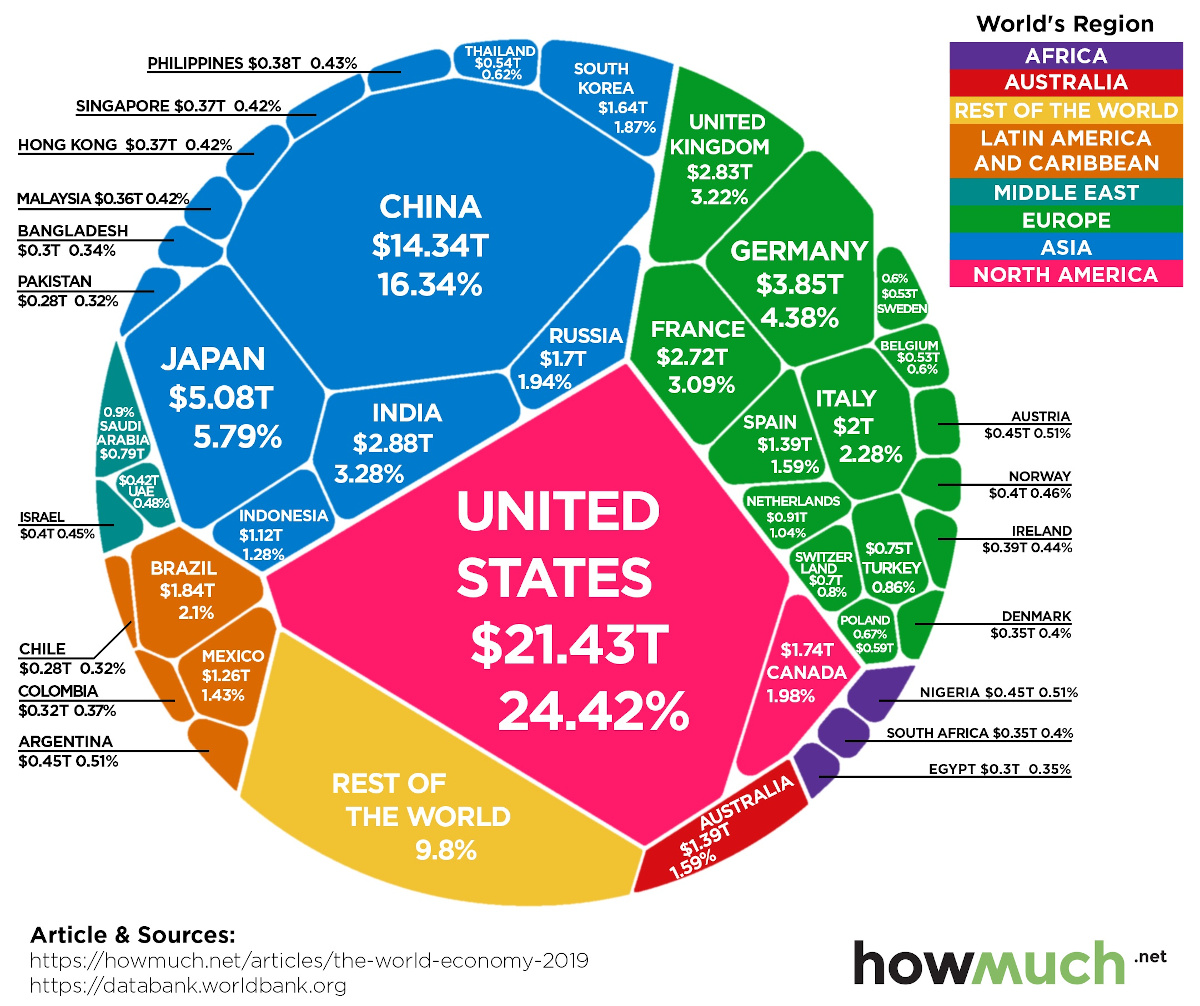
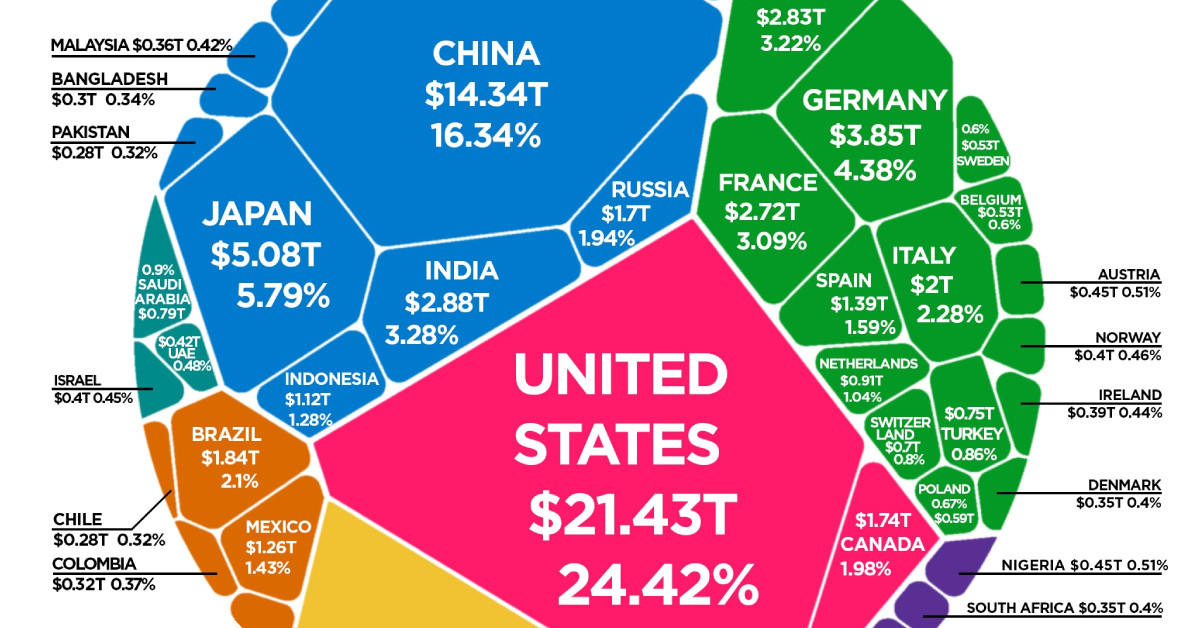
This voronoi-style visualization from HowMuch relies on gross domestic product (GDP) data from the World Bank to paint a picture of the global economy—which crested $87.8 trillion in 2019.
Editor’s note: Annual data on economic output is a lagging indicator, and is released the following year by organizations such as the World Bank. The figures in this diagram provide a snapshot of the global economy in 2019, but do not necessarily represent the impact of recent developments such as COVID-19.
Top 10 Countries by GDP (2019)
In the one-year period since the last release of official data in 2018, the global economy grew approximately $2 trillion in size—or about 2.3%.
The United States continues to have the top GDP, accounting for nearly one-quarter of the world economy. China also continued to grow its share of global GDP, going from 15.9% to 16.3%.
| Rank | Country | GDP | % of Global GDP |
|---|---|---|---|
| #1 | 🇺🇸 U.S. | $21.4T | 24.4% |
| #2 | 🇨🇳 China | $14.3T | 16.3% |
| #3 | 🇯🇵 Japan | $5.1T | 5.8% |
| #4 | 🇩🇪 Germany | $3.9T | 4.4% |
| #5 | 🇮🇳 India | $2.9T | 3.3% |
| #6 | 🇬🇧 UK | $2.8T | 3.2% |
| #7 | 🇫🇷 France | $2.7T | 3.1% |
| #8 | 🇮🇹 Italy | $2.0T | 2.3% |
| #9 | 🇧🇷 Brazil | $1.8T | 2.1% |
| #10 | 🇨🇦 Canada | $1.7T | 2.0% |
| Top 10 Countries | $58.7 trillion | 66.9% |
In recent years, the Indian economy has continued to have an upward trajectory—now pulling ahead of both the UK and France—to become one of the world’s top five economies.
In aggregate, these top 10 countries combine for over two-thirds of total global GDP.
2020 Economic Contractions
So far this year, multiple countries have experienced temporary economic contractions, including many of the top 10 countries listed above.
The following interactive chart from Our World in Data helps to give us some perspective on this turbulence, comparing Q2 economic figures against those from the same quarter last year.
One of the hardest hit economies has been Peru. The Latin American country, which is about the 50th largest in terms of GDP globally, saw its economy contract by 30.2% in Q2 despite efforts to curb the virus early.
Spain and the UK are also feeling the impact, posting quarterly GDP numbers that are 22.1% and 21.7% smaller respectively.
Meanwhile, Taiwan and South Korea are two countries that may have done the best at weathering the COVID-19 storm. Both saw minuscule contractions in a quarter where the global economy seemed to grind to a halt.
Projections Going Forward
According to the World Bank, the global economy could ultimately shrink 5.2% in 2020—the deepest cut since WWII.
See below for World Bank projections on GDP in 2020 for when the dust settles, as well as the subsequent potential for recovery in 2021.
| Country/ Region / Economy Type | 2020 Growth Projection | 2021E Rebound Forecast |
|---|---|---|
| United States | -6.1% | 4.0% |
| Euro Area | -9.1% | 4.5% |
| Advanced economies | -7.0% | 3.9% |
| Emerging economies | -2.5% | 4.6% |
| East Asia and Pacific | -0.5% | 6.6% |
| Europe and Central Asia | -4.7% | 3.6% |
| Latin America and the Caribbean | -7.2% | 2.8% |
| Middle East and North Africa | -4.2% | 2.3% |
| South Asia | -2.7% | 2.8% |
| Sub-Saharan Africa | -2.8% | 3.1% |
| Global Growth | -5.2% | 4.2% |
Source: World Bank Global Economic Prospects, released June 2020


Markets
U.S. Debt Interest Payments Reach $1 Trillion
U.S. debt interest payments have surged past the $1 trillion dollar mark, amid high interest rates and an ever-expanding debt burden.


U.S. Debt Interest Payments Reach $1 Trillion
This was originally posted on our Voronoi app. Download the app for free on iOS or Android and discover incredible data-driven charts from a variety of trusted sources.
The cost of paying for America’s national debt crossed the $1 trillion dollar mark in 2023, driven by high interest rates and a record $34 trillion mountain of debt.
Over the last decade, U.S. debt interest payments have more than doubled amid vast government spending during the pandemic crisis. As debt payments continue to soar, the Congressional Budget Office (CBO) reported that debt servicing costs surpassed defense spending for the first time ever this year.
This graphic shows the sharp rise in U.S. debt payments, based on data from the Federal Reserve.
A $1 Trillion Interest Bill, and Growing
Below, we show how U.S. debt interest payments have risen at a faster pace than at another time in modern history:
| Date | Interest Payments | U.S. National Debt |
|---|---|---|
| 2023 | $1.0T | $34.0T |
| 2022 | $830B | $31.4T |
| 2021 | $612B | $29.6T |
| 2020 | $518B | $27.7T |
| 2019 | $564B | $23.2T |
| 2018 | $571B | $22.0T |
| 2017 | $493B | $20.5T |
| 2016 | $460B | $20.0T |
| 2015 | $435B | $18.9T |
| 2014 | $442B | $18.1T |
| 2013 | $425B | $17.2T |
| 2012 | $417B | $16.4T |
| 2011 | $433B | $15.2T |
| 2010 | $400B | $14.0T |
| 2009 | $354B | $12.3T |
| 2008 | $380B | $10.7T |
| 2007 | $414B | $9.2T |
| 2006 | $387B | $8.7T |
| 2005 | $355B | $8.2T |
| 2004 | $318B | $7.6T |
| 2003 | $294B | $7.0T |
| 2002 | $298B | $6.4T |
| 2001 | $318B | $5.9T |
| 2000 | $353B | $5.7T |
| 1999 | $353B | $5.8T |
| 1998 | $360B | $5.6T |
| 1997 | $368B | $5.5T |
| 1996 | $362B | $5.3T |
| 1995 | $357B | $5.0T |
| 1994 | $334B | $4.8T |
| 1993 | $311B | $4.5T |
| 1992 | $306B | $4.2T |
| 1991 | $308B | $3.8T |
| 1990 | $298B | $3.4T |
| 1989 | $275B | $3.0T |
| 1988 | $254B | $2.7T |
| 1987 | $240B | $2.4T |
| 1986 | $225B | $2.2T |
| 1985 | $219B | $1.9T |
| 1984 | $205B | $1.7T |
| 1983 | $176B | $1.4T |
| 1982 | $157B | $1.2T |
| 1981 | $142B | $1.0T |
| 1980 | $113B | $930.2B |
| 1979 | $96B | $845.1B |
| 1978 | $84B | $789.2B |
| 1977 | $69B | $718.9B |
| 1976 | $61B | $653.5B |
| 1975 | $55B | $576.6B |
| 1974 | $50B | $492.7B |
| 1973 | $45B | $469.1B |
| 1972 | $39B | $448.5B |
| 1971 | $36B | $424.1B |
| 1970 | $35B | $389.2B |
| 1969 | $30B | $368.2B |
| 1968 | $25B | $358.0B |
| 1967 | $23B | $344.7B |
| 1966 | $21B | $329.3B |
Interest payments represent seasonally adjusted annual rate at the end of Q4.
At current rates, the U.S. national debt is growing by a remarkable $1 trillion about every 100 days, equal to roughly $3.6 trillion per year.
As the national debt has ballooned, debt payments even exceeded Medicaid outlays in 2023—one of the government’s largest expenditures. On average, the U.S. spent more than $2 billion per day on interest costs last year. Going further, the U.S. government is projected to spend a historic $12.4 trillion on interest payments over the next decade, averaging about $37,100 per American.
Exacerbating matters is that the U.S. is running a steep deficit, which stood at $1.1 trillion for the first six months of fiscal 2024. This has accelerated due to the 43% increase in debt servicing costs along with a $31 billion dollar increase in defense spending from a year earlier. Additionally, a $30 billion increase in funding for the Federal Deposit Insurance Corporation in light of the regional banking crisis last year was a major contributor to the deficit increase.
Overall, the CBO forecasts that roughly 75% of the federal deficit’s increase will be due to interest costs by 2034.

-

 Mining2 weeks ago
Charted: The Value Gap Between the Gold Price and Gold Miners
-

 Real Estate1 week ago
Ranked: The Most Valuable Housing Markets in America
-

 Business1 week ago
Charted: Big Four Market Share by S&P 500 Audits
-

 AI1 week ago
The Stock Performance of U.S. Chipmakers So Far in 2024
-

 Misc1 week ago
Almost Every EV Stock is Down After Q1 2024
-

 Money2 weeks ago
Where Does One U.S. Tax Dollar Go?
-

 Green2 weeks ago
Ranked: Top Countries by Total Forest Loss Since 2001
-

 Real Estate2 weeks ago
Visualizing America’s Shortage of Affordable Homes