Technology
The 8 Major Forces Shaping the Future of the Global Economy
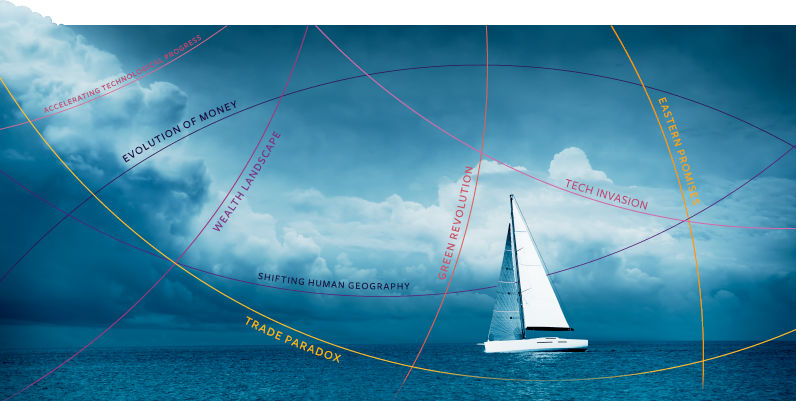
I can’t change the direction of the wind, but I can adjust my sails to always reach my destination.
– Jimmy Dean
The world is changing faster than ever before.
With billions of people hyper-connected to each other in an unprecedented global network, it allows for an almost instantaneous and frictionless spread of new ideas and innovations.
Combine this connectedness with rapidly changing demographics, shifting values and attitudes, growing political uncertainty, and exponential advances in technology, and it’s clear the next decade is setting up to be one of historic transformation.
But where do all of these big picture trends intersect, and how can we make sense of a world engulfed in complexity and nuance? Furthermore, how do we set our sails to take advantage of the opportunities presented by this sea of change?
The Intersection of Data and Powerful Visuals
Interpreting massive amounts of data on how the world is changing can be taxing for even the most brilliant thinkers.
For this reason, our entire team at Visual Capitalist is focused on using the power of visual storytelling to make the world’s information more accessible. Our team of information designers works daily to transform complex data into graphics that are both intuitive and insightful, allowing you to see big picture trends from a new perspective.
After all, science says that 65% of people are visual learners – so why not put data in a language they can understand?
While we regularly publish our visuals in an online format, our most recent endeavor has been to compile our best charts, infographics, and data visualizations into one place: our new book Visualizing Change: A Data-Driven Snapshot of Our World, a 256-page hardcover coffee-table book on the forces shaping business, wealth, technology, and the economy.
The book focuses on eight major themes ranging from shifting human geography to the never-ending evolution of money. And below, we present some of the key visualizations in the book that serve as examples relating to each major theme.
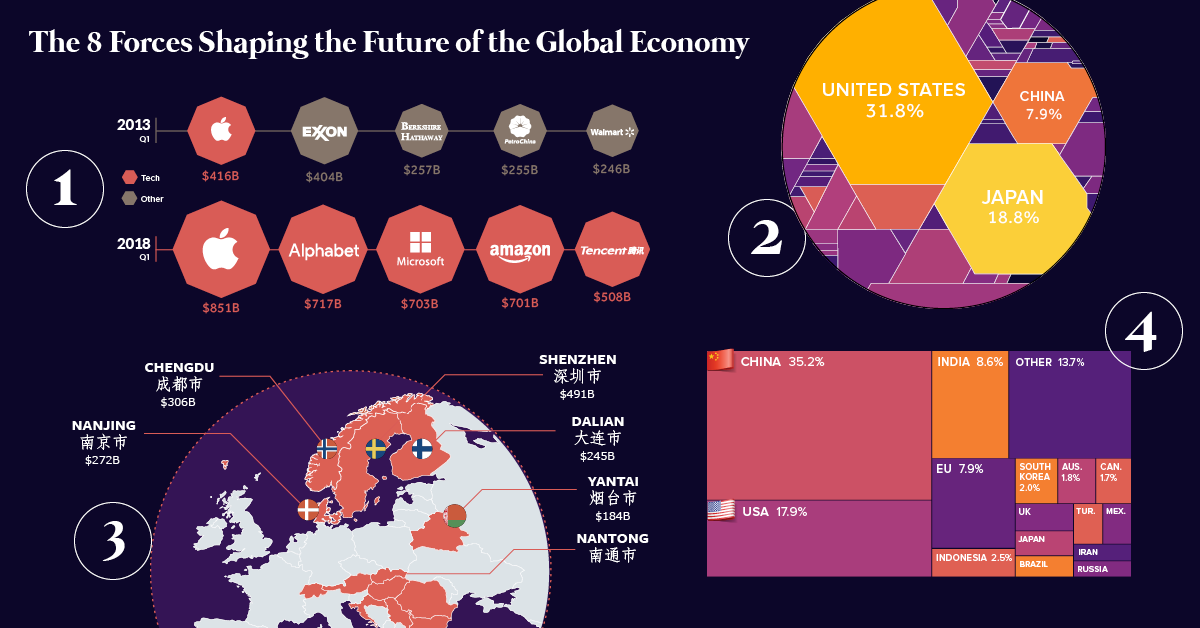
1. The Tech Invasion
For most of the history of business, the world’s leading companies have been industrially-focused.
Pioneers like Henry Ford and Thomas Edison innovated in the physical realm using atoms – they came up with novel ways to re-organize these atoms to create things like the assembly line and the incandescent lightbulb. Then, companies invested massive amounts of capital to build physical factories, pay thousands of workers, and build these things.
The majority of the great blue chip companies were built this way: IBM, U.S. Steel, General Electric, Walmart, and Ford are just some examples.
But today’s business reality is very different. We live in a world of bytes – and for the first time technology and commerce have collided in a way that makes data far more valuable than physical, tangible objects.
The best place to see this is in how the market values businesses.
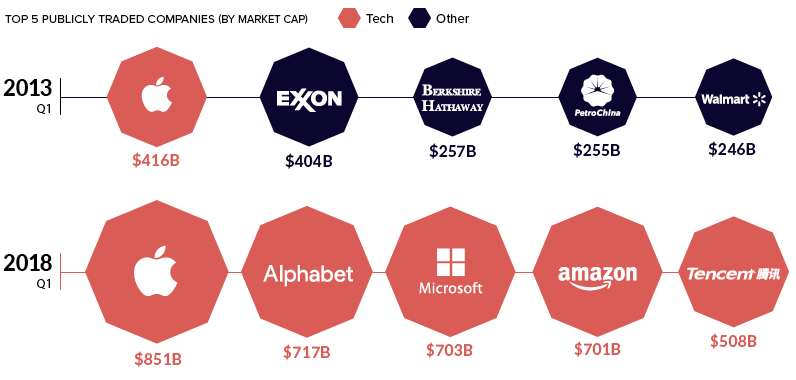
As you can see above, companies like Apple, Amazon, and Microsoft have supplanted traditional blue chip companies that build physical things.
The tech invasion is leveraging connectivity, network effects, artificial intelligence, and unprecedented scale to create global platforms that are almost impossible to compete with. The tech invasion has already taken over retail and advertising – and now invading forces have their eyes set on healthcare, finance, manufacturing, and education.
Will atoms ever be more valuable than bytes again?
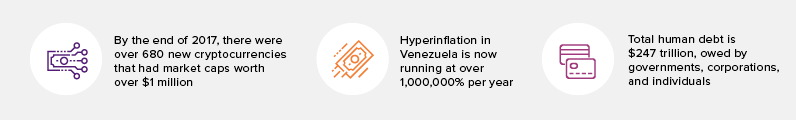
Interesting Facts:

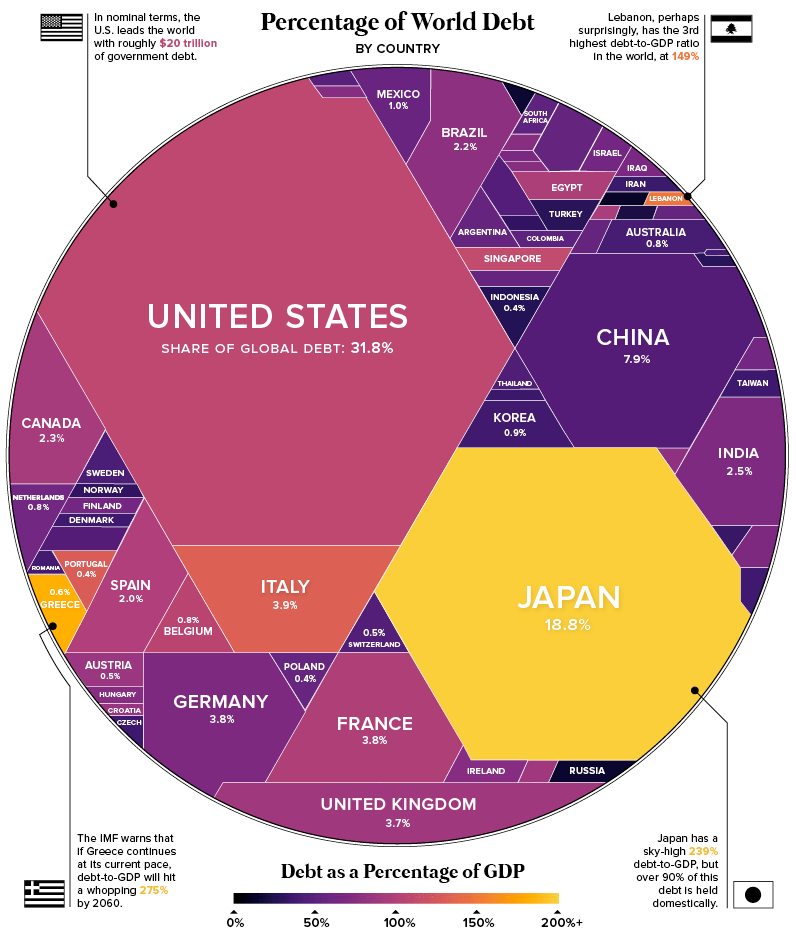
2. The Evolution of Money
Money is arguably one of humanity’s most important inventions. From beaver pelts to gold bars, the form and function of money has constantly fluctuated throughout history.
In the modern world, the definition of money is blurrier than ever. Central banks have opted to create trillions of dollars of currency out of thin air since the financial crisis – and on the flipside, you can actually use blockchain technology to create your own competing cryptocurrency in just a few clicks.
Regardless of what is money and what is not, people are borrowing record amounts of it.
The world has now amassed $247 trillion in debt, including $63 trillion borrowed by central governments:
In today’s unusual monetary circumstances, massive debt loads are just one anomaly.
Here are other examples that illustrate the evolution of money: Venezuela has hyperinflated away almost all of its currency’s value, the “War on Cash” is raging on around the world, central banks are lending out money at negative interest rates (Sweden, Japan, Switzerland, etc.), and cryptocurrencies like Bitcoin are collectively worth over $200 billion.
How we view money – and how that perception evolves over time – is an underlying factor that influences our future.
Interesting Facts:
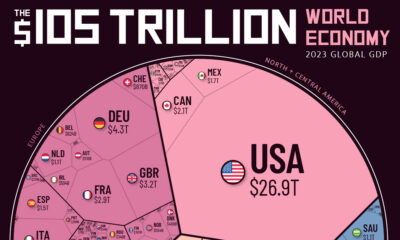
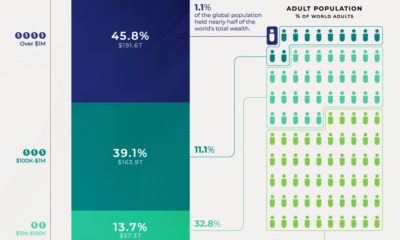
3. The Wealth Landscape
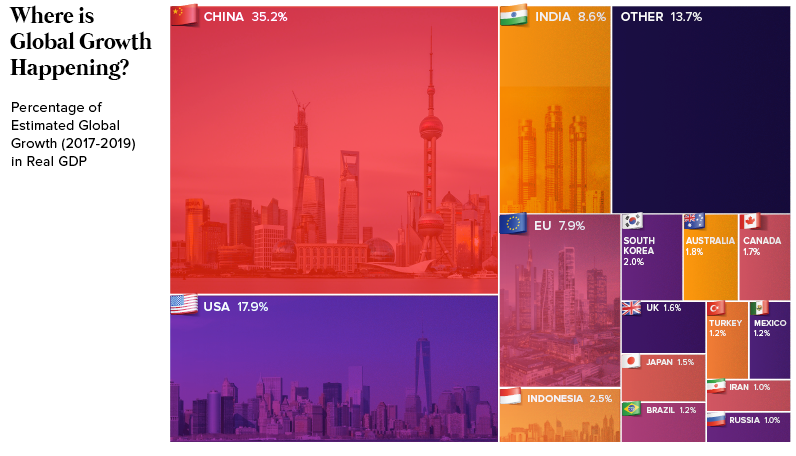
Wealth is not stagnant – and so for those looking to make the most out of global opportunities, it’s imperative to get a sense of how the wealth landscape is changing.
The modern view is either extremely healthy or bubbly, depending on how you look at it: Amazon and Apple are worth over $1 trillion, Jeff Bezos has a $100+ billion fortune, and the current bull market is the longest in modern history at 10 years.
Will this growth continue, and where will it come from?
Here’s one look based on projections from the World Bank:
Despite these estimates, there is a laundry list of items that the ultra-wealthy are concerned about – everything from the expected comeback of inflation to a world where geopolitical black swans seem to be growing more common.
Here’s why those building and protecting wealth are rightly concerned about such events:
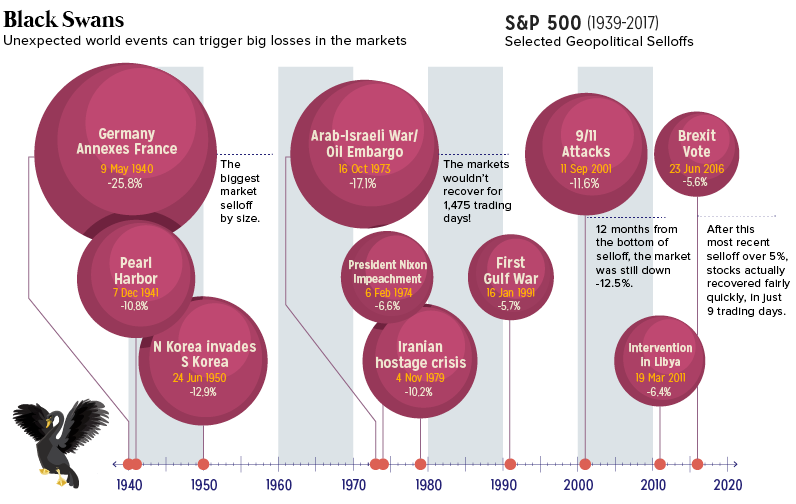
But the wealth landscape is not all just about billionaires and massive companies – it is changing in other interesting ways as well. For example, the definition of wealth itself is taking on a new meaning, with millennials leading a charge towards sustainable investing rather than being entirely focused on monetary return.
How will the wealth landscape look a decade from now?
Interesting Facts:

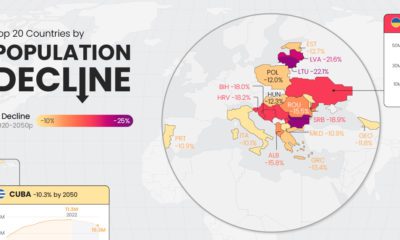
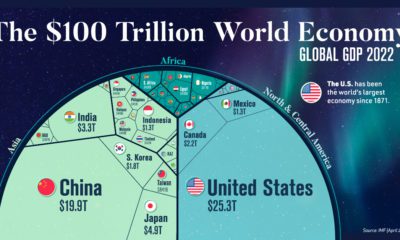
4. Eastern Promises
The economic rise of China has been a compelling story for decades.
Up until recently, we’ve only been able to get a preview of what the Eastern superpower is capable of – and in the coming years, these promises will come to fruition at a scale that will still be baffling to many.
Understandably, the scope of China’s population and economy can still be quite difficult to put into perspective.
The following map may help, as it combines both elements together to show that China has countless cities each with a higher economic productivity than entire countries.
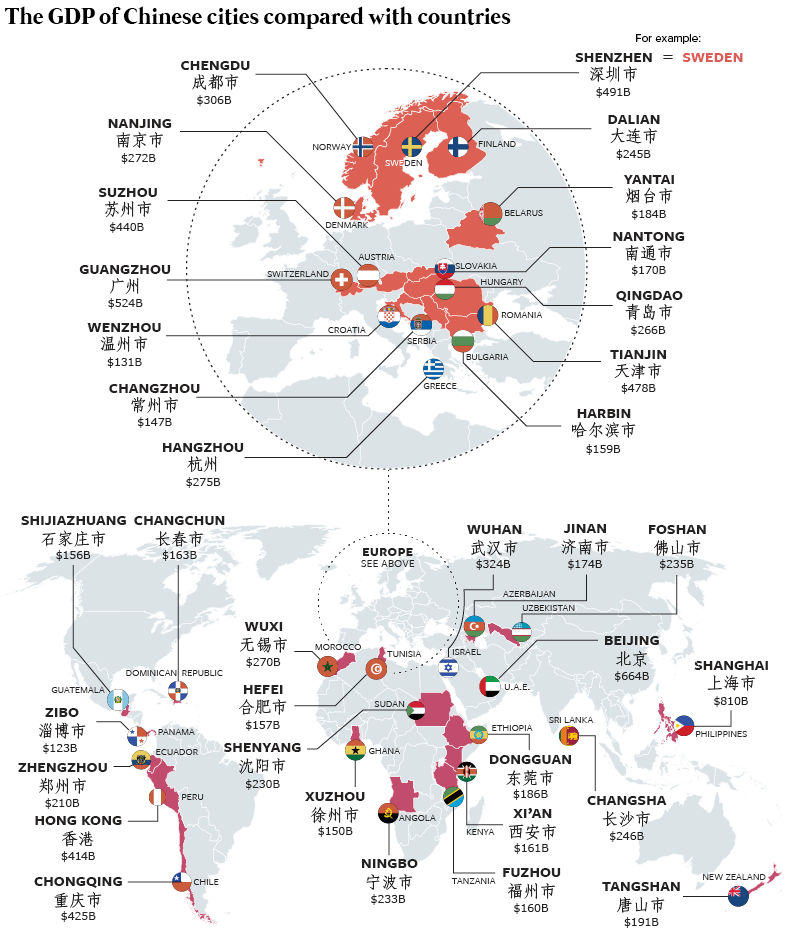
In fact, China has over 100 cities with more than 1,000,000 inhabitants. These cities, many of which fly below the radar on the global stage, each have impressive economies – whether they are built upon factories, natural resource production, or the information economy.
As one impressive example, the Yangtze River Delta – a single region which contains Shanghai, Suzhou, Hangzhou, Wuxi, Nantong, Ningbo, Nanjing, and Changzhou – has a GDP (PPP) of $2.6 trillion, which is more than Italy.
Interesting Facts:

Don’t forget: our new book covers
all of these eight themes in detail:

5. Accelerating Technological Progress
As we’ve already seen, there are many facets of change that will impact our shared future.
But here’s the kicker: when it comes to technological progress, the rate of change itself is actually getting faster and faster. Each year brings more technological advancements than the last, and once the exponential “hockey stick” kicks into overdrive, innovations could happen at a blindsiding pace.
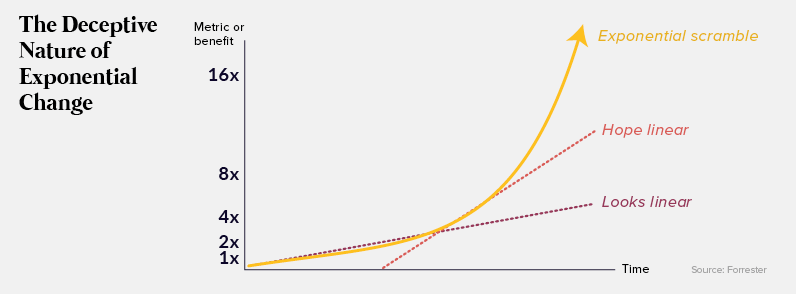
This could be described as a function of Moore’s Law, and the law of accelerating returns is also something that futurists like Ray Kurzweil have talked about for decades.
Interestingly, there is another offshoot of accelerating change that applies more to the business and economic world. Not only is the speed of change getting faster, but for various reasons, markets are able to adopt new technologies faster:
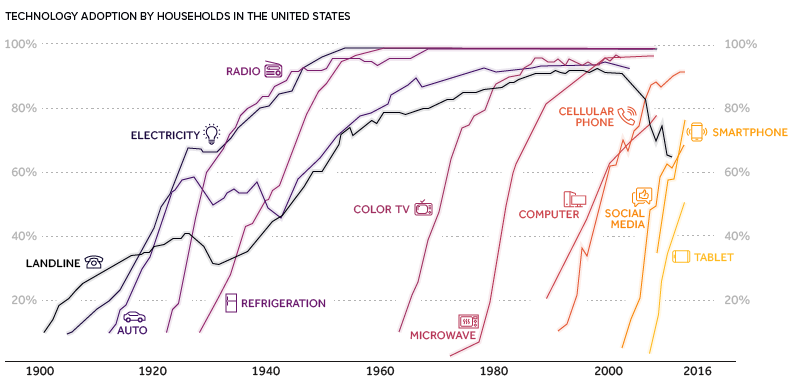
New products can achieve millions of users in just months, and the game Pokémon Go serves as an interesting case study of this potential. The game amassed 50 million users in just 19 days, which is a blink of an eye in comparison to automobiles (62 years), the telephone (50 years), or credit cards (28 years).
As new technologies are created at a faster and faster pace – and as they are adopted at record speeds by markets – it’s fair to say that future could be coming at a breakneck speed.
Interesting Facts:

6. The Green Revolution
It’s no secret that our civilization is in the middle of a seismic shift to more sustainable energy sources.
But to fully appreciate the significance of this change, you need to look at the big picture of energy over time. Below is a chart of U.S. energy consumption from 1776 until today, showing that the energy we use to power development is not permanent or static throughout history.
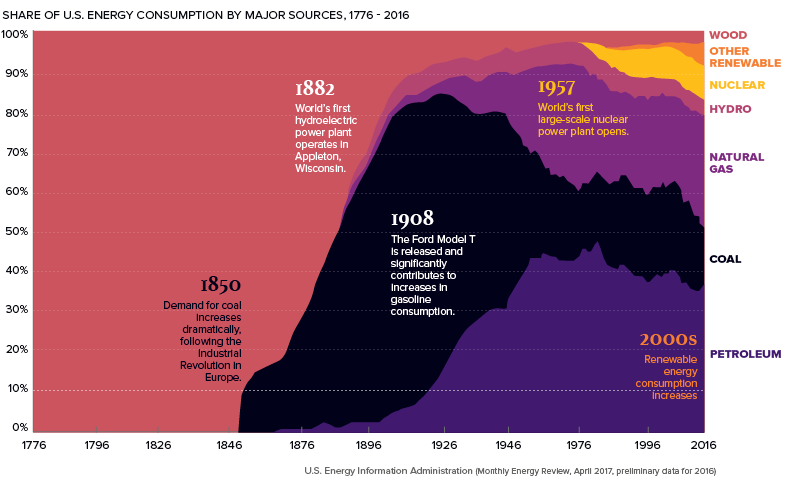
And with the speed at which technology now moves, expect our energy infrastructure and delivery systems to evolve at an even more blistering pace than we’ve experienced before.
Interesting Facts:

7. Shifting Human Geography
Global demographics are always shifting, but the population tidal wave in the coming decades will completely reshape the global economy.
In Western countries and China, populations will stabilize due to fertility rates and demographic makeups. Meanwhile, on the African continent and across the rest of Asia, booming populations combined with rapid urbanization will translate into the growth of megacities, holding upwards of 50 million people.
By the end of the 21st century, this animation shows that Africa alone could contain at least 13 megacities that are bigger than New York:
By this time, it’s projected that North America, Europe, South America, and China will combine to hold zero of the world’s 20 most populous cities. What other game-changing shifts to human geography will occur during this stretch?
Interesting Facts:

8. The Trade Paradox
By definition, a consensual and rational trade between two parties is one that makes both parties better off.
Based on this microeconomic principle, and also on the consensus by economists that free trade is ultimately beneficial, countries around the world have consistently been working to remove trade barriers since World War II with great success.
But nothing is ever straightforward, and these long-held truths are now being challenged in both societal and political contexts. We now seem to be trapped in a trade paradox in which politicians give lip service to free trade, but often take action in the opposite direction.
To get a sense of how important trade can be between two nations, we previously documented the ongoing relationship between the U.S. and Canada, in which each country is the best customer of the other:
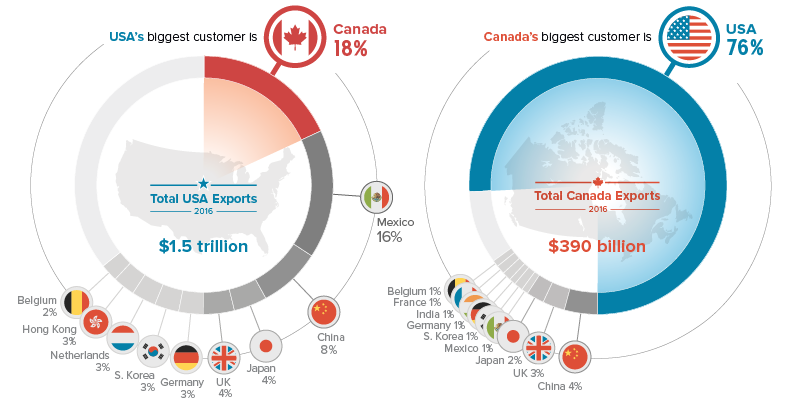
With the recent USMCA agreement, the two countries seem to have sorted their differences for now – but the trade paradox will continue to be an ongoing theme in economics and investing at a global level for many years to come, especially as the trade war against China rages on.
Points to Consider:

How You Can Visualize Change
The forces behind change are not always evident to the naked eye, but we believe that by fusing data, art, and storytelling together that we can create powerful context on the trends shaping our future.
If you enjoyed our summary above, you can explore these ideas further with our book “Visualizing Change”, which offers 256 pages of infographics, data visualizations, and charts on the future direction of the global economy and technology.

Our book makes a great holiday gift. Get it on Amazon.com or Amazon.ca, or even customize a bulk order with your logo


Technology
Ranked: Semiconductor Companies by Industry Revenue Share
Nvidia is coming for Intel’s crown. Samsung is losing ground. AI is transforming the space. We break down revenue for semiconductor companies.


Semiconductor Companies by Industry Revenue Share
This was originally posted on our Voronoi app. Download the app for free on Apple or Android and discover incredible data-driven charts from a variety of trusted sources.
Did you know that some computer chips are now retailing for the price of a new BMW?
As computers invade nearly every sphere of life, so too have the chips that power them, raising the revenues of the businesses dedicated to designing them.
But how did various chipmakers measure against each other last year?
We rank the biggest semiconductor companies by their percentage share of the industry’s revenues in 2023, using data from Omdia research.
Which Chip Company Made the Most Money in 2023?
Market leader and industry-defining veteran Intel still holds the crown for the most revenue in the sector, crossing $50 billion in 2023, or 10% of the broader industry’s topline.
All is not well at Intel, however, with the company’s stock price down over 20% year-to-date after it revealed billion-dollar losses in its foundry business.
| Rank | Company | 2023 Revenue | % of Industry Revenue |
|---|---|---|---|
| 1 | Intel | $51B | 9.4% |
| 2 | NVIDIA | $49B | 9.0% |
| 3 | Samsung Electronics | $44B | 8.1% |
| 4 | Qualcomm | $31B | 5.7% |
| 5 | Broadcom | $28B | 5.2% |
| 6 | SK Hynix | $24B | 4.4% |
| 7 | AMD | $22B | 4.1% |
| 8 | Apple | $19B | 3.4% |
| 9 | Infineon Tech | $17B | 3.2% |
| 10 | STMicroelectronics | $17B | 3.2% |
| 11 | Texas Instruments | $17B | 3.1% |
| 12 | Micron Technology | $16B | 2.9% |
| 13 | MediaTek | $14B | 2.6% |
| 14 | NXP | $13B | 2.4% |
| 15 | Analog Devices | $12B | 2.2% |
| 16 | Renesas Electronics Corporation | $11B | 1.9% |
| 17 | Sony Semiconductor Solutions Corporation | $10B | 1.9% |
| 18 | Microchip Technology | $8B | 1.5% |
| 19 | Onsemi | $8B | 1.4% |
| 20 | KIOXIA Corporation | $7B | 1.3% |
| N/A | Others | $126B | 23.2% |
| N/A | Total | $545B | 100% |
Note: Figures are rounded. Totals and percentages may not sum to 100.
Meanwhile, Nvidia is very close to overtaking Intel, after declaring $49 billion of topline revenue for 2023. This is more than double its 2022 revenue ($21 billion), increasing its share of industry revenues to 9%.
Nvidia’s meteoric rise has gotten a huge thumbs-up from investors. It became a trillion dollar stock last year, and broke the single-day gain record for market capitalization this year.
Other chipmakers haven’t been as successful. Out of the top 20 semiconductor companies by revenue, 12 did not match their 2022 revenues, including big names like Intel, Samsung, and AMD.
The Many Different Types of Chipmakers
All of these companies may belong to the same industry, but they don’t focus on the same niche.
According to Investopedia, there are four major types of chips, depending on their functionality: microprocessors, memory chips, standard chips, and complex systems on a chip.
Nvidia’s core business was once GPUs for computers (graphics processing units), but in recent years this has drastically shifted towards microprocessors for analytics and AI.
These specialized chips seem to be where the majority of growth is occurring within the sector. For example, companies that are largely in the memory segment—Samsung, SK Hynix, and Micron Technology—saw peak revenues in the mid-2010s.

-

 Real Estate2 weeks ago
Visualizing America’s Shortage of Affordable Homes
-

 Technology1 week ago
Ranked: Semiconductor Companies by Industry Revenue Share
-

 Money1 week ago
Which States Have the Highest Minimum Wage in America?
-

 Real Estate1 week ago
Ranked: The Most Valuable Housing Markets in America
-

 Business2 weeks ago
Charted: Big Four Market Share by S&P 500 Audits
-

 AI2 weeks ago
The Stock Performance of U.S. Chipmakers So Far in 2024
-

 Misc2 weeks ago
Almost Every EV Stock is Down After Q1 2024
-

 Money2 weeks ago
Where Does One U.S. Tax Dollar Go?