Technology
The 50 Most Visited Websites in the World
View the full-resolution version of this infographic


The 50 Most Visited Websites In the World
View the high-resolution of the infographic by clicking here.
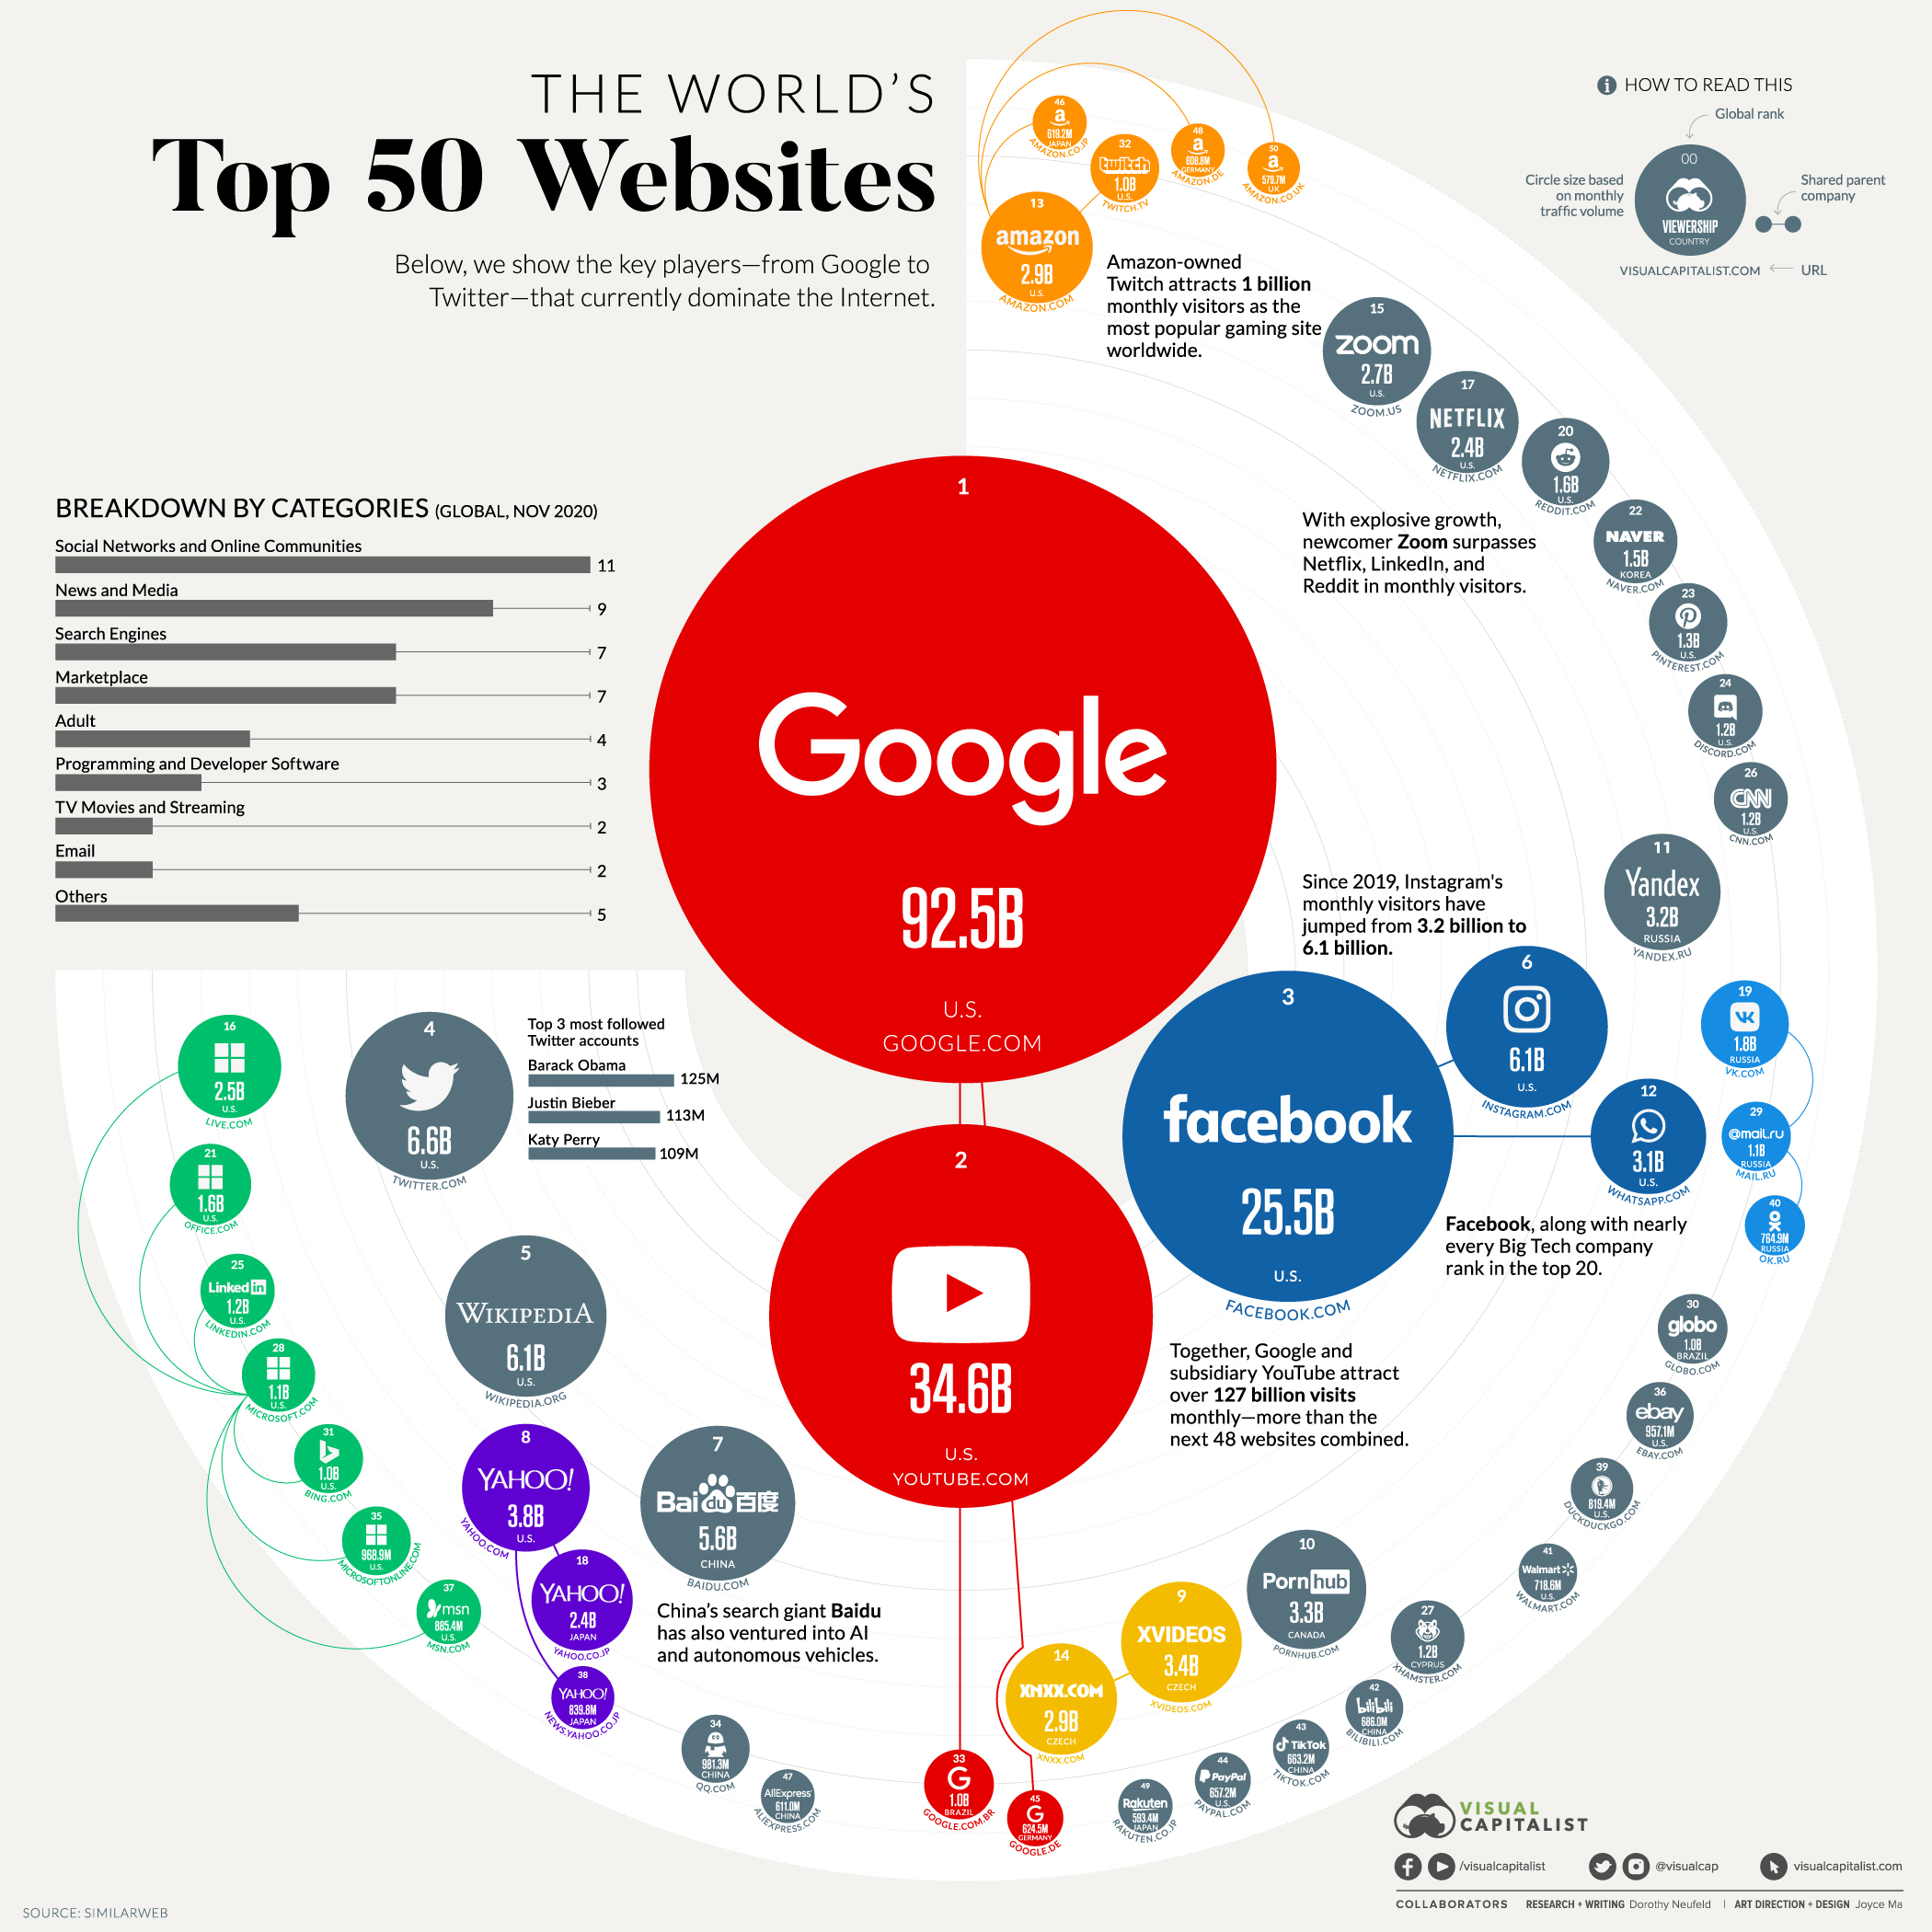
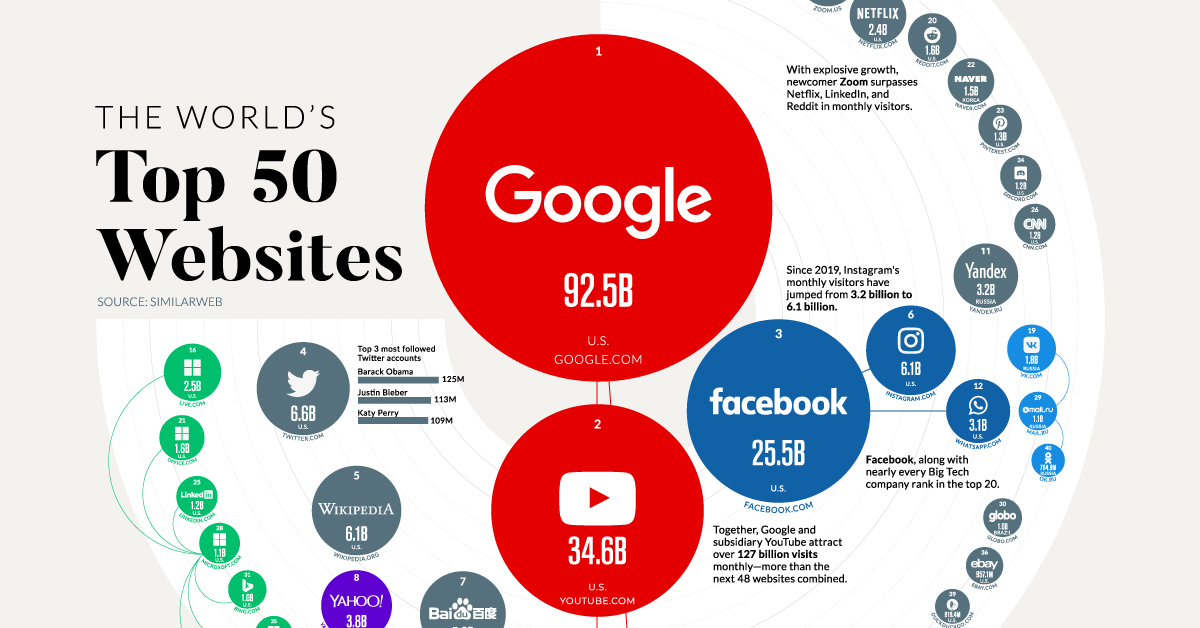
If you spend any time online, it’s likely you’re familiar with some of the world’s most visited websites. On today’s internet, a handful of giants have unmatched dominance.
Top Three Websites (Monthly visits):
- Google: 92.5 billion
- YouTube: 34.6 billion
- Facebook: 25.5 billion
Together, the top three websites rake in 152 billion visits monthly, outpacing the next 47 websites combined. What’s more, as the pandemic transformed everything from the way we work, learn, communicate, and shop—a majority of these activities migrated online.
In this new visualization, we look at the most visited websites around the world, drawing data from SimilarWeb (as of November 2020).
The Top Global Websites
Servicing over two trillion search queries annually through its network, Alphabet-owned Google ranks highest with its flagship domain, Google.com. Google derives approximately 80% of its earnings from ad revenues.
| Rank | Website | Monthly Visitors | Country of Origin | Category |
|---|---|---|---|---|
| 1 | Google.com | 92.5B | U.S. | Search Engines |
| 2 | Youtube.com | 34.6B | U.S. | TV Movies and Streaming |
| 3 | Facebook.com | 25.5B | U.S. | Social Networks and Online Communities |
| 4 | Twitter.com | 6.6B | U.S. | Social Networks and Online Communities |
| 5 | Wikipedia.org | 6.1B | U.S. | Dictionaries and Encyclopedias |
| 6 | Instagram.com | 6.1B | U.S. | Social Networks and Online Communities |
| 7 | Baidu.com | 5.6B | China | Search Engines |
| 8 | Yahoo.com | 3.8B | U.S. | News and Media |
| 9 | xvideos.com | 3.4B | Czech Republic | Adult |
| 10 | pornhub.com | 3.3B | Canada | Adult |
| 11 | Yandex.ru | 3.2B | Russia | Search Engines |
| 12 | Whatsapp.com | 3.1B | U.S. | Social Networks and Online Communities |
| 13 | Amazon.com | 2.9B | U.S. | Marketplace |
| 14 | xnxx.com | 2.9B | Czech Republic | Adult |
| 15 | Zoom.us | 2.7B | U.S. | Computers Electronics and Technology |
| 16 | Live.com | 2.5B | U.S. | |
| 17 | Netflix.com | 2.4B | U.S. | TV Movies and Streaming |
| 18 | Yahoo.co.jp | 2.4B | Japan | News and Media |
| 19 | Vk.com | 1.8B | Russia | Social Networks and Online Communities |
| 20 | Reddit.com | 1.6B | U.S. | Social Networks and Online Communities |
| 21 | Office.com | 1.6B | U.S. | Programming and Developer Software |
| 22 | Naver.com | 1.5B | South Korea | News and Media |
| 23 | Pinterest.com | 1.3B | U.S. | Social Networks and Online Communities |
| 24 | Discord.com | 1.2B | U.S. | Social Networks and Online Communities |
| 25 | Linkedin.com | 1.2B | U.S. | Social Networks and Online Communities |
| 26 | Cnn.com | 1.2B | U.S. | News and Media |
| 27 | xhamster.com | 1.2B | Cyprus | Adult |
| 28 | Microsoft.com | 1.1B | U.S. | Programming and Developer Software |
| 29 | Mail.ru | 1.1B | Russia | |
| 30 | Globo.com | 1.0B | Brazil | News and Media |
| 31 | Bing.com | 1.0B | U.S. | Search Engines |
| 32 | Twitch.tv | 1.0B | U.S. | Video Games Consoles and Accessories |
| 33 | Google.com.br | 1.0B | Brazil | Search Engines |
| 34 | QQ.com | 981.3M | China | News and Media |
| 35 | Microsoftonline.com | 968.9M | Unknown | Programming and Developer Software |
| 36 | ebay.com | 957.1M | U.S. | Marketplace |
| 37 | Msn.com | 885.4M | U.S. | News and Media |
| 38 | News.yahoo.co.jp | 839.8M | Japan | News and Media |
| 39 | Duckduckgo.com | 819.4M | U.S. | Search Engines |
| 40 | Ok.ru | 764.9M | Russia | Social Networks and Online Communities |
| 41 | Walmart.com | 718.6M | U.S. | Marketplace |
| 42 | Bilibili.com | 686.0M | China | Animation and Comics |
| 43 | Tiktok.com | 663.2M | China | Social Networks and Online Communities |
| 44 | Paypal.com | 657.2M | U.S. | Financial Planning and Management |
| 45 | Google.de | 624.5M | Germany | Search Engines |
| 46 | Amazon.co.jp | 619.2M | Japan | Marketplace |
| 47 | Aliexpress.com | 611.0M | China | Marketplace |
| 48 | Amazon.de | 608.8M | Germany | Marketplace |
| 49 | Rakuten.co.jp | 593.4M | Japan | Marketplace |
| 50 | Amazon.co.uk | 579.7M | United Kingdom | Marketplace |
Coming in second, social networking platform Facebook has a user base of 2.7 billion. On average, users spend 34 minutes on the site daily, while 36% of users say it’s also where they get their news—higher than any other social network.
As the leading search engine in China, Baidu (#7) received 5.6 billion visitors in November. Baidu is also branching out its business— venturing into electric vehicles (EVs) in a partnership with China-based automaker Geely.
As video conferencing vaulted in demand during the pandemic, Zoom (#15), launched into the most visited websites with 2.7 billion visitors monthly. Similarly, TikTok (#43) became a freshly minted addition.
The Most Visited Websites, By Country of Origin
With 27 sites on the list, the U.S. remains a dominant player. While its reach is highly concentrated on a global level, just a handful of companies own a majority of these sites.
See the static version of each regional graphic here.
Microsoft (#28), for instance, owns seven of the top sites in the world including LinkedIn (#25) and Live.com (#16). Amazon (#13), on the other hand owns five including Twitch.tv (#32), along with popular Amazon-focused domains in Japan, U.K., and Germany.
China holds five top websites: Baidu (#7), QQ (#34), Bilibili (#42), TikTok (#43), and AliExpress (#47). The Tencent-owned QQ.com, ranks as the top news site in China, with over 981 million monthly visits. Like WeChat, QQ also provides a popular messaging platform.
Just four of the most visited websites globally are based in both Russia and Japan, while the rest of the world account for 10 top sites altogether.
Reaching New Heights
While global internet patterns are clearly dominated by a few titans, what can we make of their recent traffic growth?
Between June 2019 and November 2020, Google’s monthly visitors increased 52.9%. Among the most visited websites globally, this rate of growth falls only behind Instagram (#6) at 89.1% and Twitter (#4) at 67.1%.
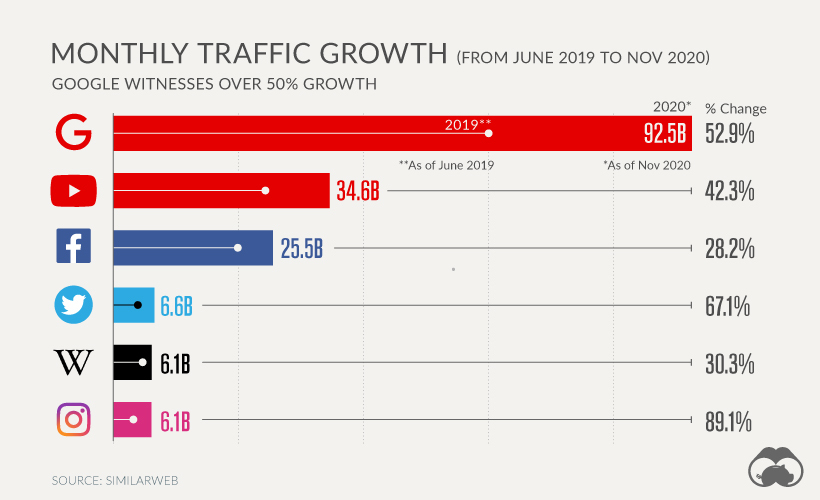
Wikipedia (#5), a non-profit website that originated in 2001 by Larry Sanger and Jimmy Wales realized over 30% growth.
While large tech companies have only accelerated their market share—Google makes up roughly 90% of the search ad market—several regulatory bodies are placing greater scrutiny on them. An October 2020 antitrust report suggested that Big Tech is in fact anti-competitive, drawing comparisons with oil tycoons of the 19th and 20th centuries.
With these key forces in mind, it raises a critical question: is there a limit to their growth?


Technology
Ranked: Semiconductor Companies by Industry Revenue Share
Nvidia is coming for Intel’s crown. Samsung is losing ground. AI is transforming the space. We break down revenue for semiconductor companies.


Semiconductor Companies by Industry Revenue Share
This was originally posted on our Voronoi app. Download the app for free on Apple or Android and discover incredible data-driven charts from a variety of trusted sources.
Did you know that some computer chips are now retailing for the price of a new BMW?
As computers invade nearly every sphere of life, so too have the chips that power them, raising the revenues of the businesses dedicated to designing them.
But how did various chipmakers measure against each other last year?
We rank the biggest semiconductor companies by their percentage share of the industry’s revenues in 2023, using data from Omdia research.
Which Chip Company Made the Most Money in 2023?
Market leader and industry-defining veteran Intel still holds the crown for the most revenue in the sector, crossing $50 billion in 2023, or 10% of the broader industry’s topline.
All is not well at Intel, however, with the company’s stock price down over 20% year-to-date after it revealed billion-dollar losses in its foundry business.
| Rank | Company | 2023 Revenue | % of Industry Revenue |
|---|---|---|---|
| 1 | Intel | $51B | 9.4% |
| 2 | NVIDIA | $49B | 9.0% |
| 3 | Samsung Electronics | $44B | 8.1% |
| 4 | Qualcomm | $31B | 5.7% |
| 5 | Broadcom | $28B | 5.2% |
| 6 | SK Hynix | $24B | 4.4% |
| 7 | AMD | $22B | 4.1% |
| 8 | Apple | $19B | 3.4% |
| 9 | Infineon Tech | $17B | 3.2% |
| 10 | STMicroelectronics | $17B | 3.2% |
| 11 | Texas Instruments | $17B | 3.1% |
| 12 | Micron Technology | $16B | 2.9% |
| 13 | MediaTek | $14B | 2.6% |
| 14 | NXP | $13B | 2.4% |
| 15 | Analog Devices | $12B | 2.2% |
| 16 | Renesas Electronics Corporation | $11B | 1.9% |
| 17 | Sony Semiconductor Solutions Corporation | $10B | 1.9% |
| 18 | Microchip Technology | $8B | 1.5% |
| 19 | Onsemi | $8B | 1.4% |
| 20 | KIOXIA Corporation | $7B | 1.3% |
| N/A | Others | $126B | 23.2% |
| N/A | Total | $545B | 100% |
Note: Figures are rounded. Totals and percentages may not sum to 100.
Meanwhile, Nvidia is very close to overtaking Intel, after declaring $49 billion of topline revenue for 2023. This is more than double its 2022 revenue ($21 billion), increasing its share of industry revenues to 9%.
Nvidia’s meteoric rise has gotten a huge thumbs-up from investors. It became a trillion dollar stock last year, and broke the single-day gain record for market capitalization this year.
Other chipmakers haven’t been as successful. Out of the top 20 semiconductor companies by revenue, 12 did not match their 2022 revenues, including big names like Intel, Samsung, and AMD.
The Many Different Types of Chipmakers
All of these companies may belong to the same industry, but they don’t focus on the same niche.
According to Investopedia, there are four major types of chips, depending on their functionality: microprocessors, memory chips, standard chips, and complex systems on a chip.
Nvidia’s core business was once GPUs for computers (graphics processing units), but in recent years this has drastically shifted towards microprocessors for analytics and AI.
These specialized chips seem to be where the majority of growth is occurring within the sector. For example, companies that are largely in the memory segment—Samsung, SK Hynix, and Micron Technology—saw peak revenues in the mid-2010s.

-

 Real Estate2 weeks ago
Visualizing America’s Shortage of Affordable Homes
-

 Technology1 week ago
Ranked: Semiconductor Companies by Industry Revenue Share
-

 Money1 week ago
Which States Have the Highest Minimum Wage in America?
-

 Real Estate1 week ago
Ranked: The Most Valuable Housing Markets in America
-

 Business2 weeks ago
Charted: Big Four Market Share by S&P 500 Audits
-

 AI2 weeks ago
The Stock Performance of U.S. Chipmakers So Far in 2024
-

 Misc2 weeks ago
Almost Every EV Stock is Down After Q1 2024
-

 Money2 weeks ago
Where Does One U.S. Tax Dollar Go?