Misc
The 44 Closest Stars and How They Compare to our Sun
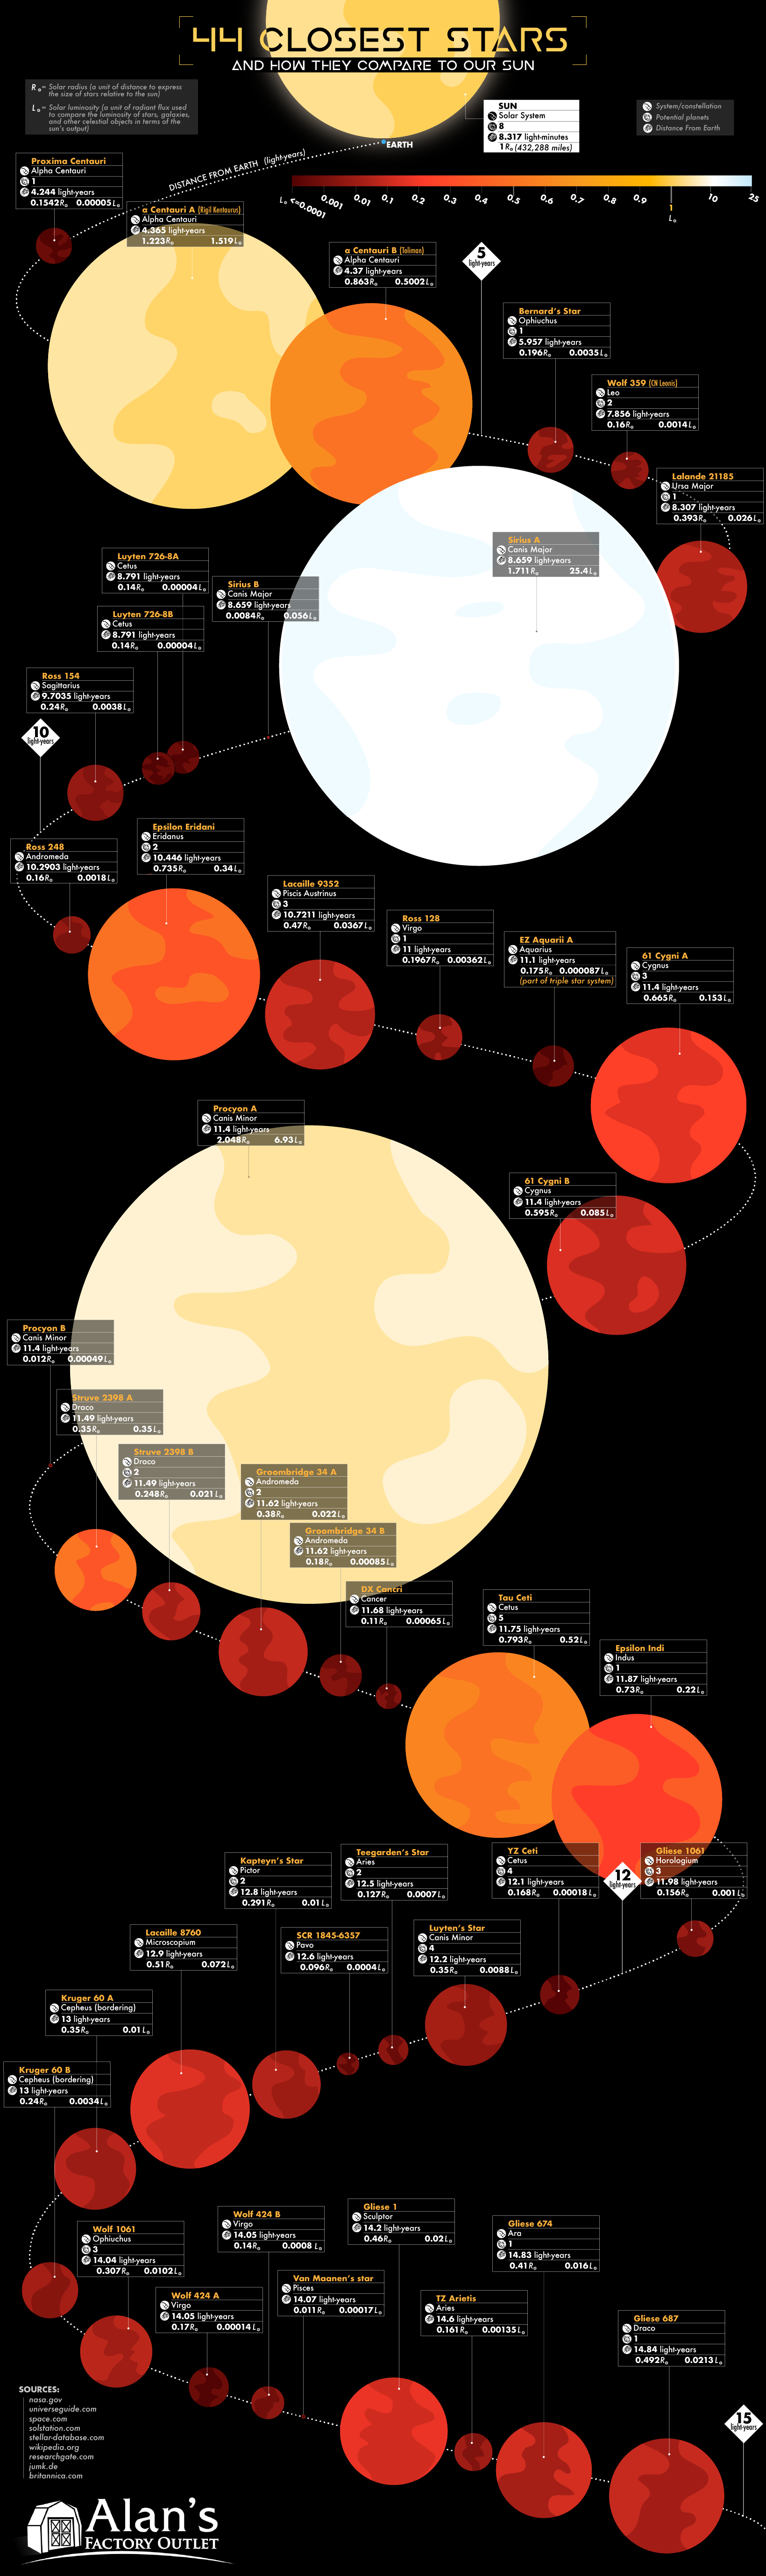
44 Closest Stars and How They Compare to our Sun
Humans have been fascinated by the stars in the night sky since the dawn of time.
We’ve been decoding the mysteries of celestial bodies for many centuries, but it is only in the last 200 years or so that we’ve been able to glean more detailed information on the lights that dot the night sky. Friedrich Bessel’s method of stellar parallax was a breakthrough in accurately measuring the positions of stars, and opened new doors in the effort to map our universe. Today, high-powered telescopes offer even more granular data on our cosmic neighborhood.
The infographic above, from Alan’s Factory Outlet, categorizes the 44 closest stars to Earth, examining the size, luminosity, constellations, systems, and potential planets of each star.
Our Nearest Stellar Neighbors
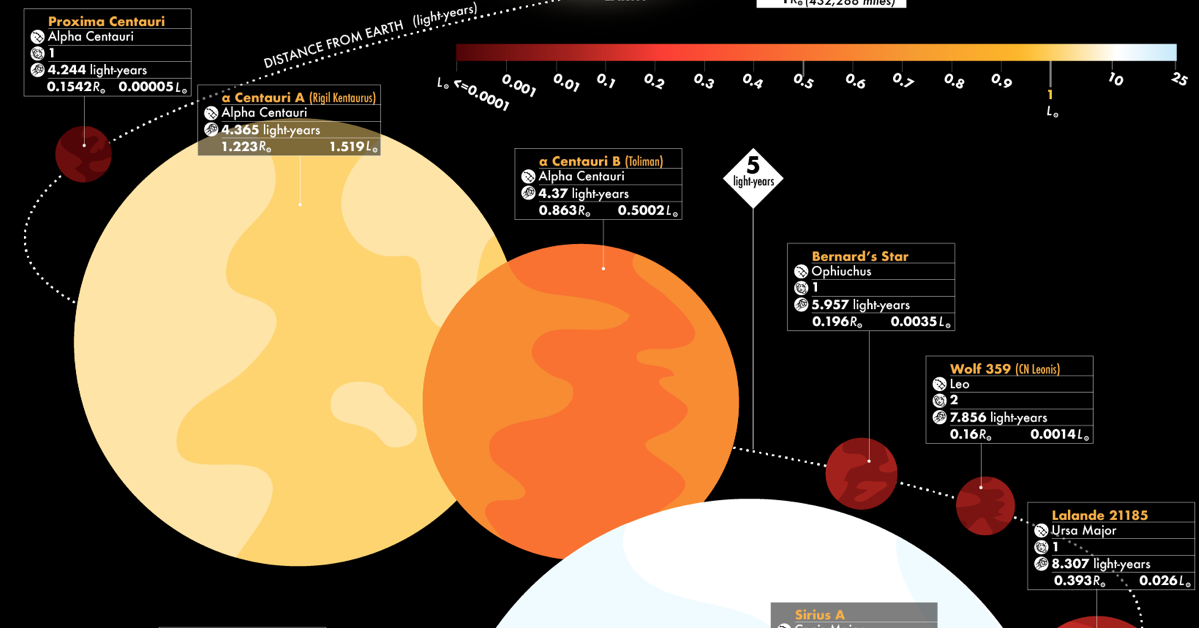
Our closest neighboring stars are all part of the same solar system: Alpha Centauri. This triple star system – consisting of Proxima Centauri, Alpha Centauri A, and Alpha Centauri B – attracts a lot of interest because it hosts planets, including one that may be similar to Earth.
The planet, Proxima Centauri b, is a lot closer to its star than Earth is to the Sun. However, because Proxima Centauri is a smaller and cooler red dwarf type star, the planet’s orbit is within the habitable zone. It’s thought that Proxima Centauri b receives approximately the same amount of solar energy as Earth does from our Sun.
Here’s a full list of the 44 of the closest stars to Earth:
| Star Name | Distance (light years) | MoE |
|---|---|---|
| Sun | 0.000016 | ±0.0011 |
| Proxima Centauri | 4.37 | ±0.0068 |
| α Centauri A | 4.37 | ±0.0068 |
| α Centauri B | 4.37 | ±0.0068 |
| Barnard's Star | 5.96 | ±0.0032 |
| Wolf 359 | 7.86 | ±0.031 |
| Lalande 21185 | 8.31 | ±0.014 |
| Sirius A | 8.66 | ±0.010 |
| Sirius B | 8.66 | ±0.010 |
| Luyten 726-8 A | 8.79 | ±0.012 |
| Luyten 726-8 B | 8.79 | ±0.012 |
| Ross 154 | 9.70 | ±0.0019 |
| Ross 248 | 10.29 | ±0.0041 |
| Epsilon Eridani | 10.45 | ±0.016 |
| Lacaille 9352 | 10.72 | ±0.0016 |
| Ross 128 | 11.01 | ±0.0026 |
| EZ Aquarii A | 11.11 | ±0.034 |
| 61 Cygni A | 11.40 | ±0.0012 |
| 61 Cygni B | 11.40 | ±0.0012 |
| Procyon A | 11.40 | ±0.032 |
| Procyon B | 11.40 | ±0.032 |
| Struve 2398 A | 11.49 | ±0.0012 |
| Struve 2398 B | 11.49 | ±0.0012 |
| Groombridge 34 A | 11.62 | ±0.0008 |
| Groombridge 34 B | 11.62 | ±0.0008 |
| DX Cancri | 11.68 | ±0.0056 |
| Tau Ceti | 11.75 | ±0.022 |
| Epsilon Indi | 11.87 | ±0.011 |
| Gliese 1061 | 11.98 | ±0.0029 |
| YZ Ceti | 12.11 | ±0.0035 |
| Luyten's Star | 12.20 | ±0.036 |
| Teegarden's Star | 12.50 | ±0.013 |
| SCR 1845-6357 | 13.05 | ±0.008 |
| Kapteyn's Star | 12.83 | ±0.0013 |
| Lacaille 8760 | 12.95 | ±0.0029 |
| Kruger 60 A | 13.07 | ±0.0052 |
| Kruger 60 B | 13.07 | ±0.0052 |
| Wolf 1061 | 14.05 | ±0.0038 |
| Wolf 424 A | 14.05 | ±0.26 |
| Van Maanen's star | 14.07 | ±0.0023 |
| Gliese 1 | 14.17 | ±0.0037 |
| TZ Arietis | 14.58 | ±0.0070 |
| Gliese 674 | 14.84 | ±0.0033 |
| Gliese 687 | 14.84 | ±0.0022 |
Even though we see many of these stars in the night sky, humans aren’t likely to see them in person any time soon. To put these vast distances into perspective, if the Voyager spacecraft were to travel to Proxima Centauri, it would take over 73,000 years to finally arrive.
The Brightest Stars in the Sky
The closest stars aren’t necessarily the ones most visible to us here on Earth. Here are the top 10 stars in terms of visual brightness from Earth:
| Rank | Proper name | Constellation | Visual magnitude (mV) | Distance (light years) |
|---|---|---|---|---|
| 1 | Sun | N/A | −26.74 | 0.000016 |
| 2 | Sirius | Canis Major | −1.46 | 8.6 |
| 3 | Canopus | Carina | −0.74 | 310.0 |
| 4 | Rigil Kentaurus & Toliman | Centaurus | −0.27 (0.01 + 1.33) | 4.4 |
| 5 | Arcturus | Boötes | −0.05 | 37.0 |
| 6 | Vega | Lyra | 0.03 (−0.02–0.07var) | 25.0 |
| 7 | Capella | Auriga | 0.08 (0.03–0.16var) | 43.0 |
| 8 | Rigel | Orion | 0.13 (0.05–0.18var) | 860.0 |
| 9 | Procyon | Canis Minor | 0.34 | 11.0 |
| 10 | Achernar | Eridanus | 0.46 (0.40–0.46var) | 139.0 |
Excluding our Sun, the brightest star visible from Earth is Sirius, or the Dog Star. Sirius, which is about 25 times more luminous than the sun, visually punctuates the constellation Canis Major.
Filling in the Gaps
The next step in learning more about our surroundings in the cosmos will be seeing which of the stars listed above have planets orbiting them. So far, the 44 stars in the infographic have over 40 planets scattered among them, though new discoveries are made all the time.
With each new mission and discovery, we learn a little bit more about our pocket of the universe.
Maps
The Largest Earthquakes in the New York Area (1970-2024)
The earthquake that shook buildings across New York in April 2024 was the third-largest quake in the Northeast U.S. over the past 50 years.


The Largest Earthquakes in the New York Area
This was originally posted on our Voronoi app. Download the app for free on Apple or Android and discover incredible data-driven charts from a variety of trusted sources.
The 4.8 magnitude earthquake that shook buildings across New York on Friday, April 5th, 2024 was the third-largest quake in the U.S. Northeast area over the past 50 years.
In this map, we illustrate earthquakes with a magnitude of 4.0 or greater recorded in the Northeastern U.S. since 1970, according to the United States Geological Survey (USGS).
Shallow Quakes and Older Buildings
The earthquake that struck the U.S. Northeast in April 2024 was felt by millions of people from Washington, D.C., to north of Boston. It even caused a full ground stop at Newark Airport.
The quake, occurring just 5 km beneath the Earth’s surface, was considered shallow, which is what contributed to more intense shaking at the surface.
According to the USGS, rocks in the eastern U.S. are significantly older, denser, and harder than those on the western side, compressed by time. This makes them more efficient conduits for seismic energy. Additionally, buildings in the Northeast tend to be older and may not adhere to the latest earthquake codes.
Despite disrupting work and school life, the earthquake was considered minor, according to the Michigan Technological University magnitude scale:
| Magnitude | Earthquake Effects | Estimated Number Each Year |
|---|---|---|
| 2.5 or less | Usually not felt, but can be recorded by seismograph. | Millions |
| 2.5 to 5.4 | Often felt, but only causes minor damage. | 500,000 |
| 5.5 to 6.0 | Slight damage to buildings and other structures. | 350 |
| 6.1 to 6.9 | May cause a lot of damage in very populated areas. | 100 |
| 7.0 to 7.9 | Major earthquake. Serious damage. | 10-15 |
| 8.0 or greater | Great earthquake. Can totally destroy communities near the epicenter. | One every year or two |
The largest earthquake felt in the area over the past 50 years was a 5.3 magnitude quake that occurred in Au Sable Forks, New York, in 2002. It damaged houses and cracked roads in a remote corner of the Adirondack Mountains, but caused no injuries.
| Date | Magnitude | Location | State |
|---|---|---|---|
| April 20, 2002 | 5.3 | Au Sable Forks | New York |
| October 7, 1983 | 5.1 | Newcomb | New York |
| April 5, 2024 | 4.8 | Whitehouse Station | New Jersey |
| October 16, 2012 | 4.7 | Hollis Center | Maine |
| January 16, 1994 | 4.6 | Sinking Spring | Pennsylvania |
| January 19, 1982 | 4.5 | Sanbornton | New Hampshire |
| September 25, 1998 | 4.5 | Adamsville | Pennsylvania |
| June 9, 1975 | 4.2 | Altona | New York |
| May 29, 1983 | 4.2 | Peru | Maine |
| April 23, 1984 | 4.2 | Conestoga | Pennsylvania |
| January 16, 1994 | 4.2 | Sinking Spring | Pennsylvania |
| November 3, 1975 | 4 | Long Lake | New York |
| June 17, 1991 | 4 | Worcester | New York |
The largest earthquake in U.S. history, however, was the 1964 Good Friday quake in Alaska, measuring 9.2 magnitude and killing 131 people.

-

 Business2 weeks ago
America’s Top Companies by Revenue (1994 vs. 2023)
-

 Environment1 week ago
Ranked: Top Countries by Total Forest Loss Since 2001
-

 Markets1 week ago
Visualizing America’s Shortage of Affordable Homes
-

 Maps2 weeks ago
Mapped: Average Wages Across Europe
-

 Mining2 weeks ago
Charted: The Value Gap Between the Gold Price and Gold Miners
-

 Demographics2 weeks ago
Visualizing the Size of the Global Senior Population
-

 Misc2 weeks ago
Tesla Is Once Again the World’s Best-Selling EV Company
-

 Technology2 weeks ago
Ranked: The Most Popular Smartphone Brands in the U.S.