Business
The 20 Most and Least Profitable Companies, Per Employee

The 20 Most and Least Profitable Companies, Per Employee
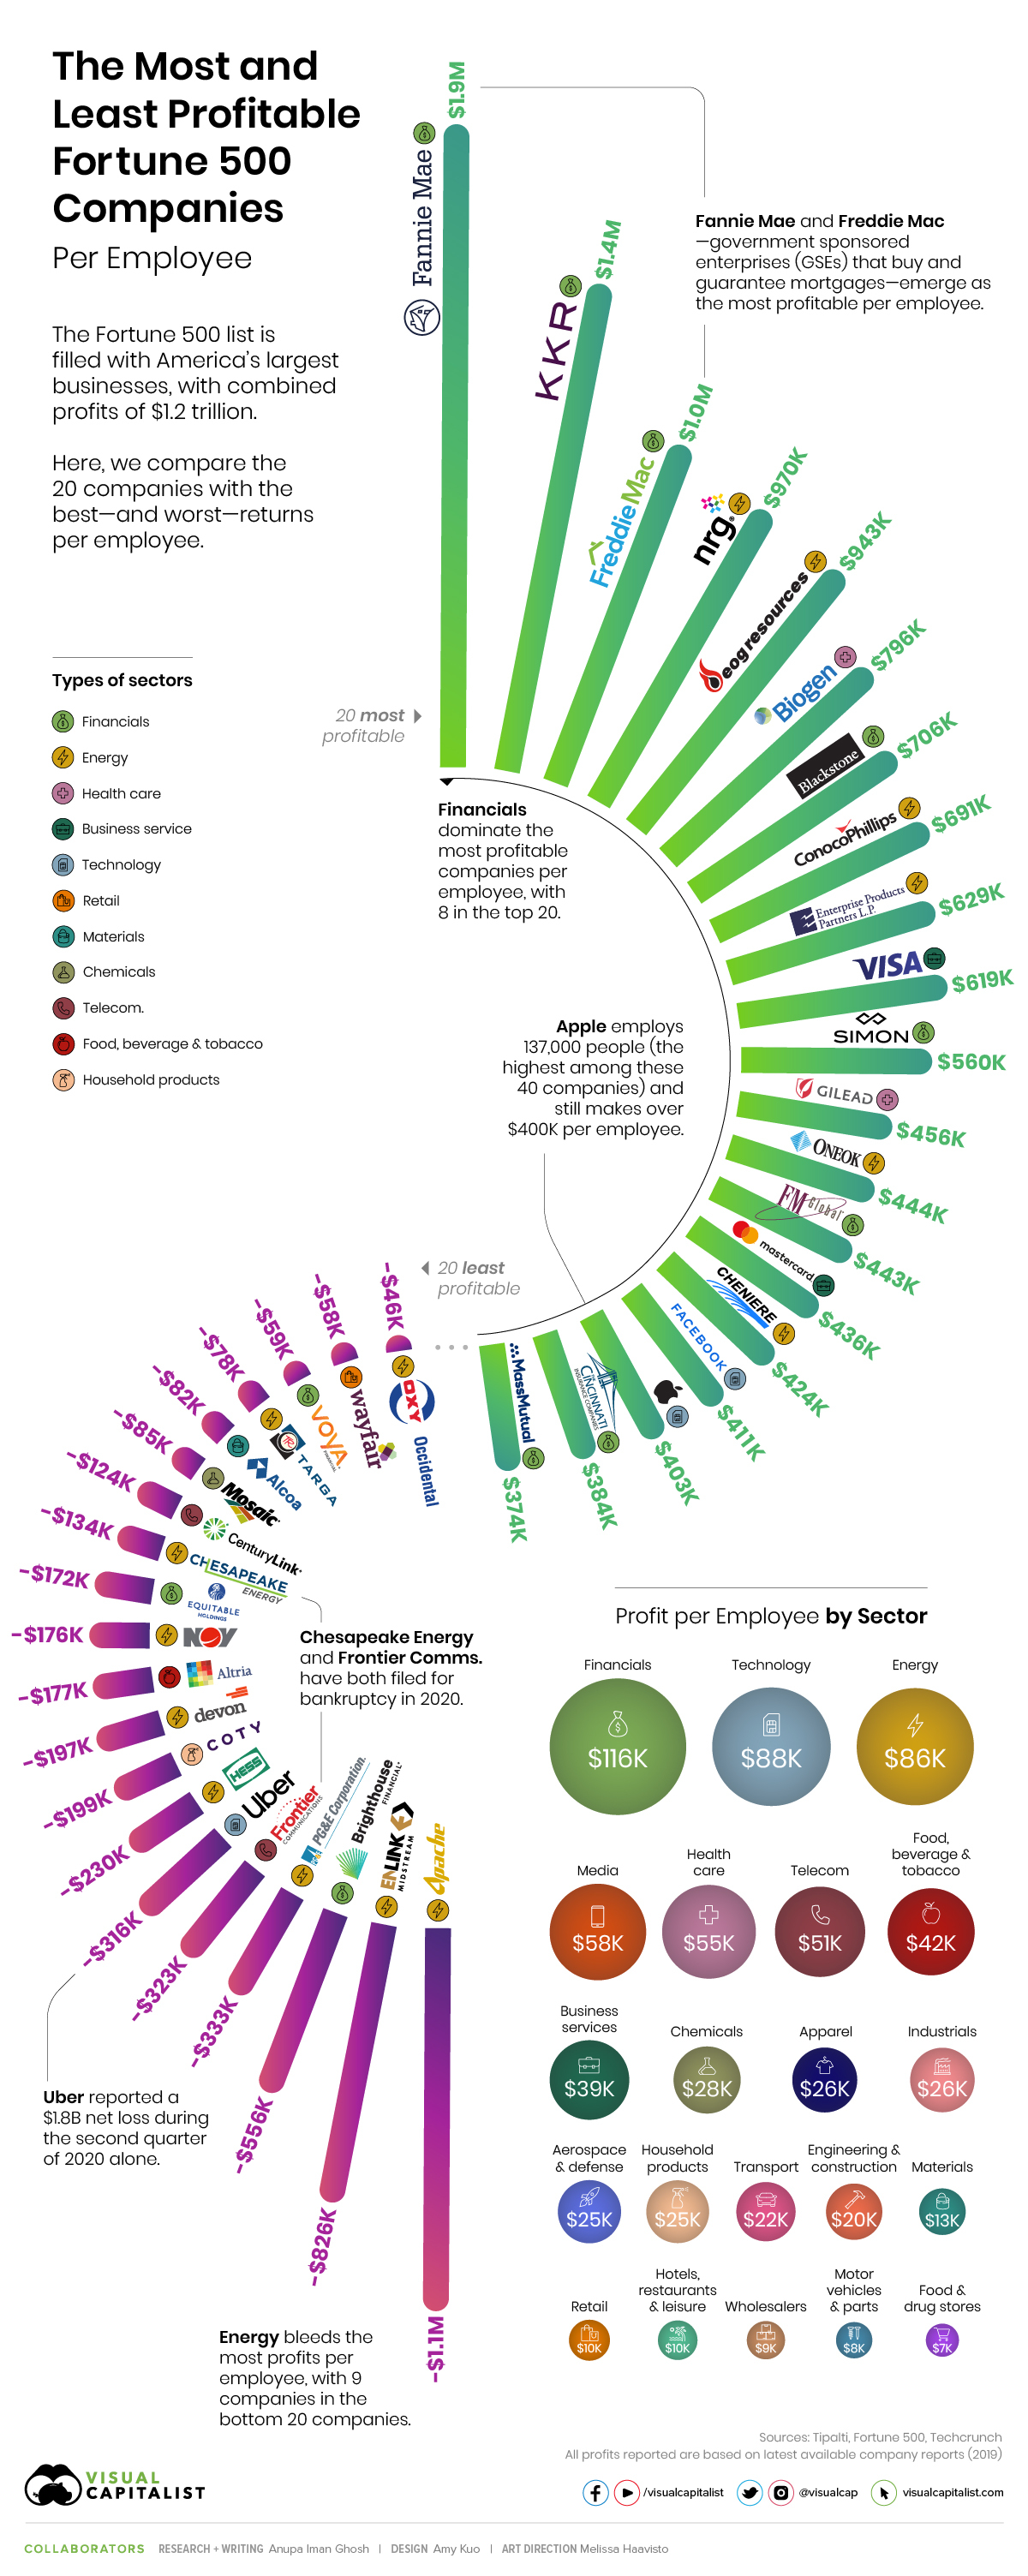
The Fortune 500 is an elite club of the biggest American businesses, which combined to generate profits of over $1.2 trillion in 2019.
But how much profit do these companies make on a per employee basis?
This visualization uncovers the answer by comparing the 20 companies with the most and least returns per employee, using calculations from Tipalti (based on the Fortune 500 list).
Top 20: Most Profit per Employee
Diving right in, the companies that make the most money per employee may surprise you.
Housing giants Fannie Mae and Freddie Mac take two of the top three spots, bringing in $1.9 million and $1.0 million per employee respectively in 2019.
The two U.S. government sponsored enterprises (GSEs) are major players in the secondary mortgage market, buying and repackaging nearly half the mortgages in the country. The duo was allowed to retain their profits as of October 2019, instead of returning them to the U.S. Treasury.
| Company | Sector | Profit per Employee | Profits ($M) | Employees |
|---|---|---|---|---|
| Fannie Mae (Federal National Mortgage Association) | Financials | $1,888,000 | $14,160 | 7,500 |
| KKR | Financials | $1,448,699 | $2,005 | 1,384 |
| Freddie Mac (Federal Home Loan Mortgage Corporation) | Financials | $1,046,721 | $7,214 | 6,892 |
| NRG Energy | Energy | $969,631 | $4,438 | 4,577 |
| EOG Resources | Energy | $943,103 | $2,735 | 2,900 |
| Biogen | Health Care | $795,811 | $5,889 | 7,400 |
| Blackstone Group | Financials | $705,680 | $2,050 | 2,905 |
| ConocoPhillips | Energy | $691,250 | $7,189 | 10,400 |
| Enterprise Products Partners | Energy | $628,904 | $4,591 | 7,300 |
| Visa | Business Services | $619,487 | $12,080 | 19,500 |
| Simon Property Group | Financials | $560,533 | $2,102 | 3,750 |
| Gilead Sciences | Health Care | $456,441 | $5,386 | 11,800 |
| Oneok | Energy | $443,789 | $1,279 | 2,882 |
| FM Global | Financials | $443,391 | $2,479 | 5,591 |
| Mastercard | Business Services | $436,452 | $8,118 | 18,600 |
| Cheniere Energy | Energy | $423,529 | $648 | 1,530 |
| Technology | $411,308 | $18,485 | 44,942 | |
| Apple | Technology | $403,328 | $55,256 | 137,000 |
| Cincinnati Financial | Financials | $384,038 | $1,997 | 5,200 |
| Massachusetts Mutual Life Insurance | Financials | $373,989 | $3,701 | 9,896 |
Apple employs 137,000 people—the largest workforce by far among the 40 companies profiled—but still makes $403,328 per employee. Facebook is the only other tech giant to bring in more money per employee at $411,308.
Bottom 20: Least Profit per Employee
On the other end of the spectrum, Uber is one of the most well-known companies currently bleeding profits, losing $316K per employee. In fact, the ride-hailing service lost approximately $1.8 billion in the second quarter of 2020 alone.
| Company | Sector | Profit per Employee | Profits ($M) | Employees |
|---|---|---|---|---|
| Apache | Energy | -$1,123,301 | -$3,553 | 3,163 |
| EnLink Midstream | Energy | -$825,830 | -$1,119 | 1,355 |
| Brighthouse Financial | Financials | -$556,391 | -$740 | 1,330 |
| PG&E | Energy | -$332,870 | -$7,656 | 23,000 |
| Frontier Communications | Telecommunications | -$322,706 | -$5,911 | 18,317 |
| Uber Technologies | Technology | -$316,208 | -$8,506 | 26,900 |
| Hess | Energy | -$229,859 | -$408 | 1,775 |
| Coty | Household Products | -$199,158 | -$3,784 | 19,000 |
| Devon Energy | Energy | -$197,222 | -$355 | 1,800 |
| Altria Group | Food, Beverages & Tobacco | -$177,123 | -$1,293 | 7,300 |
| National Oilwell Varco | Energy | -$175,927 | -$6,095 | 34,645 |
| Equitable Holdings | Financials | -$171,584 | -$1,733 | 10,100 |
| Chesapeake Energy | Energy | -$133,913 | -$308 | 2,300 |
| CenturyLink | Telecommunications | -$123,976 | -$5,269 | 42,500 |
| Mosaic | Chemicals | -$84,683 | -$1,067 | 12,600 |
| Alcoa | Materials | -$81,522 | -$1,125 | 13,800 |
| Targa Resources | Energy | -$77,985 | -$209 | 2,680 |
| Voya Financial | Financials | -$58,500 | -$351 | 6,000 |
| Wayfair | Retailing | -$57,992 | -$985 | 16,985 |
| Occidental Petroleum | Energy | -$46,319 | -$667 | 14,400 |
COVID-19 has also had an intense effect on some of the companies at the bottom end of the profit per employee spectrum. Chesapeake Energy and Frontier Communications are just two examples that have filed for Chapter 11 bankruptcy in recent months—they each lost $134K and $322K per employee in 2019 respectively.
I’m pretty confident we will see more bankruptcies than in any business person’s lifetime.
—James Hammond, CEO of BankruptcyData
Profit per Employee by Sector
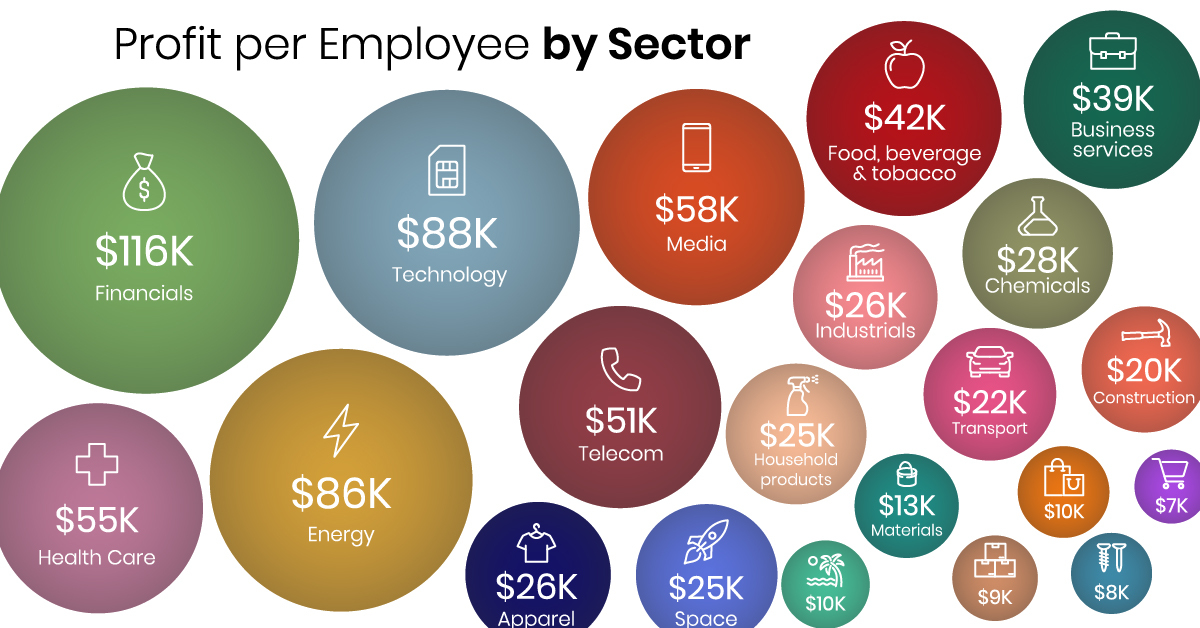
When all the companies in the Fortune 500 are taken into account, sector-specific numbers reveal interesting trends.
Financials bring in the most profit per employee at $116K, while Food and Drug Stores see 17 times less profit at $6.7K per employee. In fact, eight out of the top 20 most profitable companies are found in the financial sector.
| Sector | Profits per Employee | Profits ($M) | Employees |
|---|---|---|---|
| Financials | $116,228 | $378,445 | 3,256,067 |
| Technology | $87,532 | $252,836 | 2,888,490 |
| Energy | $85,547 | $75,410 | 881,505 |
| Media | $57,947 | $21,634 | 373,333 |
| Health Care | $54,679 | $145,166 | 2,654,872 |
| Telecommunications | $50,636 | $38,251 | 755,417 |
| F&B incl. Tobacco | $41,946 | $42,924 | 1,023,317 |
| Business Services | $39,354 | $36,835 | 936,000 |
| Chemicals | $27,977 | $11,328 | 404,888 |
| Apparel | $26,154 | $7,776 | 297,300 |
| Industrials | $25,827 | $27,006 | 1,045,675 |
| Aerospace & Defence | $24,793 | $23,903 | 964,100 |
| Household Products | $24,504 | $10,415 | 425,038 |
| Transportation | $21,762 | $32,454 | 1,491,358 |
| Engineering & Construction | $19,648 | $6,773 | 344,716 |
| Materials | $13,408 | $6,024 | 449,252 |
| Retailing | $10,373 | $67,318 | 6,489,923 |
| Hotels, Restaurants & Leisure | $9,653 | $16,880 | 1,748,714 |
| Wholesalers | $9,025 | $5,842 | 647,312 |
| Motor Vehicles & Parts | $8,113 | $7,108 | 876,123 |
| Food & Drug Stores | $6,746 | $8,355 | 1,238,645 |
Interestingly, as a whole, the energy sector comes in third place in terms of profit per employee at $86K—that said, nine out of the bottom 20 least profitable companies are also found in this highly volatile industry.
Though the vast majority of businesses impacted by COVID-19 have been small to mid-sized companies, the above calculations also show that Fortune 500 companies are not safe, either.
Technology
How Tech Logos Have Evolved Over Time
From complete overhauls to more subtle tweaks, these tech logos have had quite a journey. Featuring: Google, Apple, and more.

How Tech Logos Have Evolved Over Time
This was originally posted on our Voronoi app. Download the app for free on iOS or Android and discover incredible data-driven charts from a variety of trusted sources.
One would be hard-pressed to find a company that has never changed its logo. Granted, some brands—like Rolex, IBM, and Coca-Cola—tend to just have more minimalistic updates. But other companies undergo an entire identity change, thus necessitating a full overhaul.
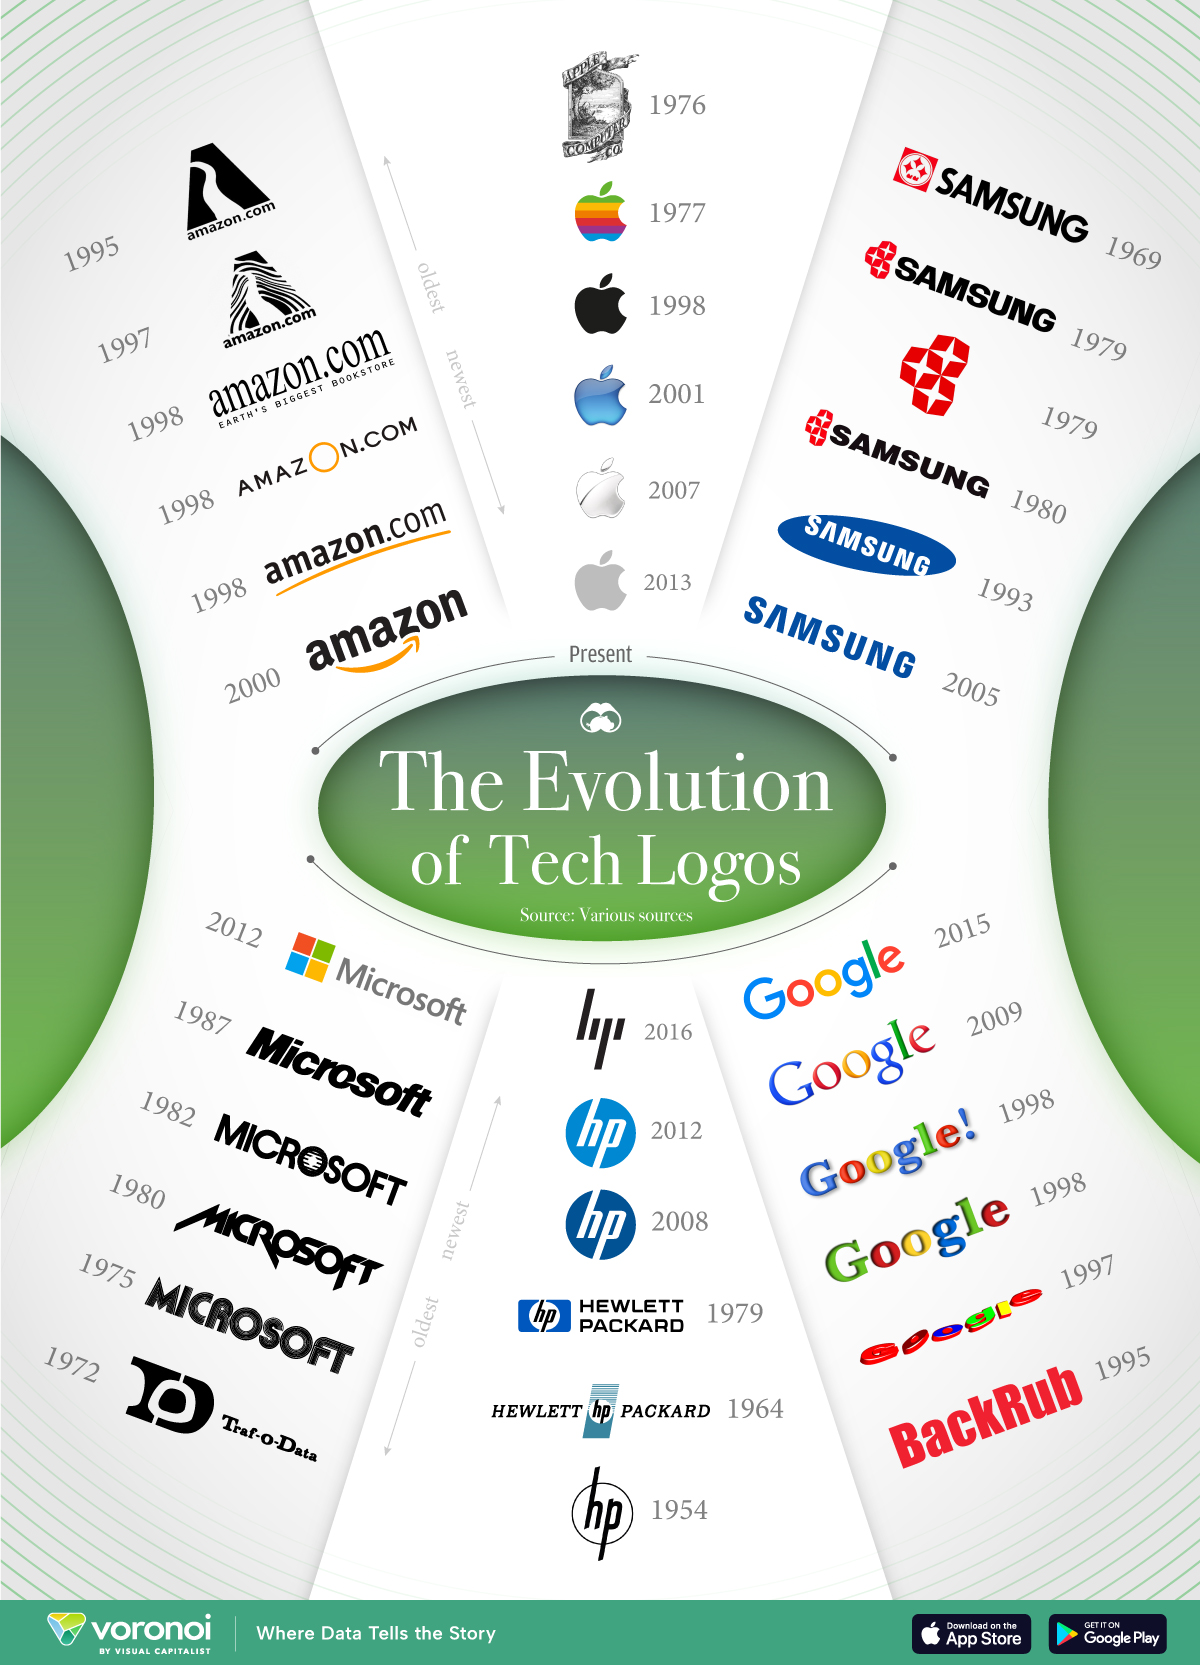
In this graphic, we visualized the evolution of prominent tech companies’ logos over time. All of these brands ranked highly in a Q1 2024 YouGov study of America’s most famous tech brands. The logo changes are sourced from 1000logos.net.
How Many Times Has Google Changed Its Logo?
Google and Facebook share a 98% fame rating according to YouGov. But while Facebook’s rise was captured in The Social Network (2010), Google’s history tends to be a little less lionized in popular culture.
For example, Google was initially called “Backrub” because it analyzed “back links” to understand how important a website was. Since its founding, Google has undergone eight logo changes, finally settling on its current one in 2015.
| Company | Number of Logo Changes |
|---|---|
| 8 | |
| HP | 8 |
| Amazon | 6 |
| Microsoft | 6 |
| Samsung | 6 |
| Apple | 5* |
Note: *Includes color changes. Source: 1000Logos.net
Another fun origin story is Microsoft, which started off as Traf-O-Data, a traffic counter reading company that generated reports for traffic engineers. By 1975, the company was renamed. But it wasn’t until 2012 that Microsoft put the iconic Windows logo—still the most popular desktop operating system—alongside its name.
And then there’s Samsung, which started as a grocery trading store in 1938. Its pivot to electronics started in the 1970s with black and white television sets. For 55 years, the company kept some form of stars from its first logo, until 1993, when the iconic encircled blue Samsung logo debuted.
Finally, Apple’s first logo in 1976 featured Isaac Newton reading under a tree—moments before an apple fell on his head. Two years later, the iconic bitten apple logo would be designed at Steve Jobs’ behest, and it would take another two decades for it to go monochrome.
-

 Markets1 week ago
U.S. Debt Interest Payments Reach $1 Trillion
-

 Markets2 weeks ago
Ranked: The Most Valuable Housing Markets in America
-

 Money2 weeks ago
Which States Have the Highest Minimum Wage in America?
-

 AI2 weeks ago
Ranked: Semiconductor Companies by Industry Revenue Share
-

 Markets2 weeks ago
Ranked: The World’s Top Flight Routes, by Revenue
-

 Countries2 weeks ago
Population Projections: The World’s 6 Largest Countries in 2075
-

 Markets2 weeks ago
The Top 10 States by Real GDP Growth in 2023
-

 Money2 weeks ago
The Smallest Gender Wage Gaps in OECD Countries


