Business
The 20 Most and Least Profitable Companies, Per Employee


The 20 Most and Least Profitable Companies, Per Employee
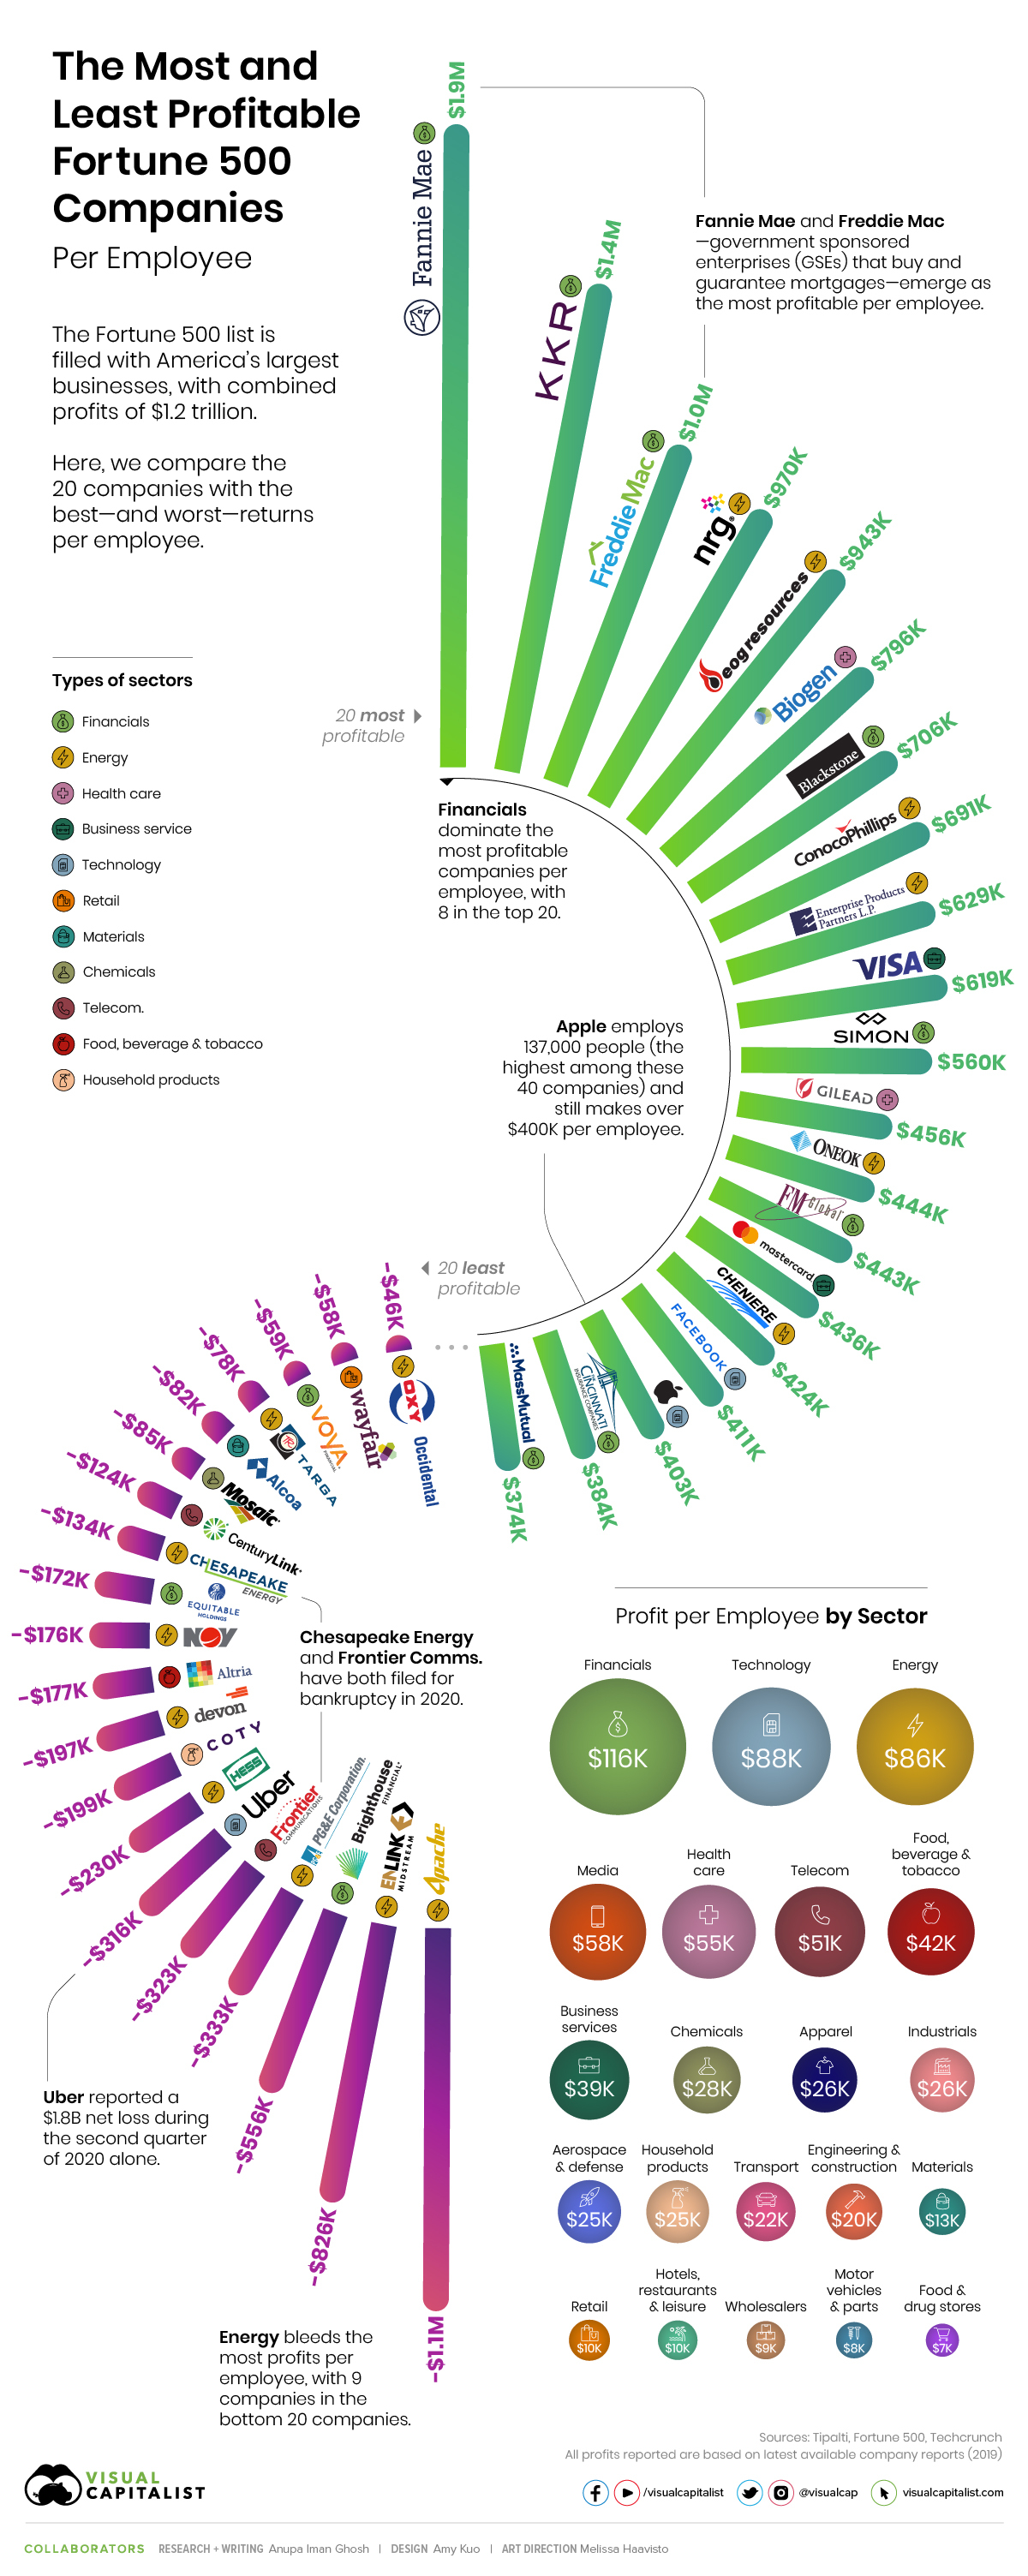
The Fortune 500 is an elite club of the biggest American businesses, which combined to generate profits of over $1.2 trillion in 2019.
But how much profit do these companies make on a per employee basis?
This visualization uncovers the answer by comparing the 20 companies with the most and least returns per employee, using calculations from Tipalti (based on the Fortune 500 list).
Top 20: Most Profit per Employee
Diving right in, the companies that make the most money per employee may surprise you.
Housing giants Fannie Mae and Freddie Mac take two of the top three spots, bringing in $1.9 million and $1.0 million per employee respectively in 2019.
The two U.S. government sponsored enterprises (GSEs) are major players in the secondary mortgage market, buying and repackaging nearly half the mortgages in the country. The duo was allowed to retain their profits as of October 2019, instead of returning them to the U.S. Treasury.
| Company | Sector | Profit per Employee | Profits ($M) | Employees |
|---|---|---|---|---|
| Fannie Mae (Federal National Mortgage Association) | Financials | $1,888,000 | $14,160 | 7,500 |
| KKR | Financials | $1,448,699 | $2,005 | 1,384 |
| Freddie Mac (Federal Home Loan Mortgage Corporation) | Financials | $1,046,721 | $7,214 | 6,892 |
| NRG Energy | Energy | $969,631 | $4,438 | 4,577 |
| EOG Resources | Energy | $943,103 | $2,735 | 2,900 |
| Biogen | Health Care | $795,811 | $5,889 | 7,400 |
| Blackstone Group | Financials | $705,680 | $2,050 | 2,905 |
| ConocoPhillips | Energy | $691,250 | $7,189 | 10,400 |
| Enterprise Products Partners | Energy | $628,904 | $4,591 | 7,300 |
| Visa | Business Services | $619,487 | $12,080 | 19,500 |
| Simon Property Group | Financials | $560,533 | $2,102 | 3,750 |
| Gilead Sciences | Health Care | $456,441 | $5,386 | 11,800 |
| Oneok | Energy | $443,789 | $1,279 | 2,882 |
| FM Global | Financials | $443,391 | $2,479 | 5,591 |
| Mastercard | Business Services | $436,452 | $8,118 | 18,600 |
| Cheniere Energy | Energy | $423,529 | $648 | 1,530 |
| Technology | $411,308 | $18,485 | 44,942 | |
| Apple | Technology | $403,328 | $55,256 | 137,000 |
| Cincinnati Financial | Financials | $384,038 | $1,997 | 5,200 |
| Massachusetts Mutual Life Insurance | Financials | $373,989 | $3,701 | 9,896 |
Apple employs 137,000 people—the largest workforce by far among the 40 companies profiled—but still makes $403,328 per employee. Facebook is the only other tech giant to bring in more money per employee at $411,308.
Bottom 20: Least Profit per Employee
On the other end of the spectrum, Uber is one of the most well-known companies currently bleeding profits, losing $316K per employee. In fact, the ride-hailing service lost approximately $1.8 billion in the second quarter of 2020 alone.
| Company | Sector | Profit per Employee | Profits ($M) | Employees |
|---|---|---|---|---|
| Apache | Energy | -$1,123,301 | -$3,553 | 3,163 |
| EnLink Midstream | Energy | -$825,830 | -$1,119 | 1,355 |
| Brighthouse Financial | Financials | -$556,391 | -$740 | 1,330 |
| PG&E | Energy | -$332,870 | -$7,656 | 23,000 |
| Frontier Communications | Telecommunications | -$322,706 | -$5,911 | 18,317 |
| Uber Technologies | Technology | -$316,208 | -$8,506 | 26,900 |
| Hess | Energy | -$229,859 | -$408 | 1,775 |
| Coty | Household Products | -$199,158 | -$3,784 | 19,000 |
| Devon Energy | Energy | -$197,222 | -$355 | 1,800 |
| Altria Group | Food, Beverages & Tobacco | -$177,123 | -$1,293 | 7,300 |
| National Oilwell Varco | Energy | -$175,927 | -$6,095 | 34,645 |
| Equitable Holdings | Financials | -$171,584 | -$1,733 | 10,100 |
| Chesapeake Energy | Energy | -$133,913 | -$308 | 2,300 |
| CenturyLink | Telecommunications | -$123,976 | -$5,269 | 42,500 |
| Mosaic | Chemicals | -$84,683 | -$1,067 | 12,600 |
| Alcoa | Materials | -$81,522 | -$1,125 | 13,800 |
| Targa Resources | Energy | -$77,985 | -$209 | 2,680 |
| Voya Financial | Financials | -$58,500 | -$351 | 6,000 |
| Wayfair | Retailing | -$57,992 | -$985 | 16,985 |
| Occidental Petroleum | Energy | -$46,319 | -$667 | 14,400 |
COVID-19 has also had an intense effect on some of the companies at the bottom end of the profit per employee spectrum. Chesapeake Energy and Frontier Communications are just two examples that have filed for Chapter 11 bankruptcy in recent months—they each lost $134K and $322K per employee in 2019 respectively.
I’m pretty confident we will see more bankruptcies than in any business person’s lifetime.
—James Hammond, CEO of BankruptcyData
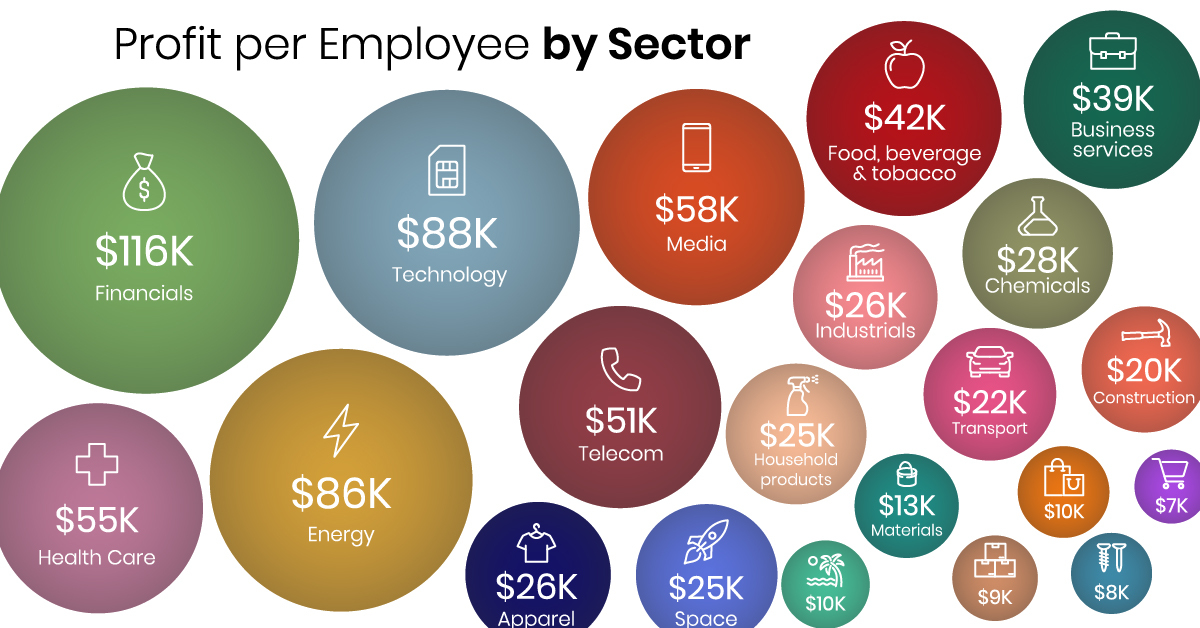
Profit per Employee by Sector
When all the companies in the Fortune 500 are taken into account, sector-specific numbers reveal interesting trends.
Financials bring in the most profit per employee at $116K, while Food and Drug Stores see 17 times less profit at $6.7K per employee. In fact, eight out of the top 20 most profitable companies are found in the financial sector.
| Sector | Profits per Employee | Profits ($M) | Employees |
|---|---|---|---|
| Financials | $116,228 | $378,445 | 3,256,067 |
| Technology | $87,532 | $252,836 | 2,888,490 |
| Energy | $85,547 | $75,410 | 881,505 |
| Media | $57,947 | $21,634 | 373,333 |
| Health Care | $54,679 | $145,166 | 2,654,872 |
| Telecommunications | $50,636 | $38,251 | 755,417 |
| F&B incl. Tobacco | $41,946 | $42,924 | 1,023,317 |
| Business Services | $39,354 | $36,835 | 936,000 |
| Chemicals | $27,977 | $11,328 | 404,888 |
| Apparel | $26,154 | $7,776 | 297,300 |
| Industrials | $25,827 | $27,006 | 1,045,675 |
| Aerospace & Defence | $24,793 | $23,903 | 964,100 |
| Household Products | $24,504 | $10,415 | 425,038 |
| Transportation | $21,762 | $32,454 | 1,491,358 |
| Engineering & Construction | $19,648 | $6,773 | 344,716 |
| Materials | $13,408 | $6,024 | 449,252 |
| Retailing | $10,373 | $67,318 | 6,489,923 |
| Hotels, Restaurants & Leisure | $9,653 | $16,880 | 1,748,714 |
| Wholesalers | $9,025 | $5,842 | 647,312 |
| Motor Vehicles & Parts | $8,113 | $7,108 | 876,123 |
| Food & Drug Stores | $6,746 | $8,355 | 1,238,645 |
Interestingly, as a whole, the energy sector comes in third place in terms of profit per employee at $86K—that said, nine out of the bottom 20 least profitable companies are also found in this highly volatile industry.
Though the vast majority of businesses impacted by COVID-19 have been small to mid-sized companies, the above calculations also show that Fortune 500 companies are not safe, either.


Markets
Ranked: The Largest U.S. Corporations by Number of Employees
We visualized the top U.S. companies by employees, revealing the massive scale of retailers like Walmart, Target, and Home Depot.


The Largest U.S. Corporations by Number of Employees
This was originally posted on our Voronoi app. Download the app for free on Apple or Android and discover incredible data-driven charts from a variety of trusted sources.
Revenue and profit are common measures for measuring the size of a business, but what about employee headcount?
To see how big companies have become from a human perspective, we’ve visualized the top U.S. companies by employees. These figures come from companiesmarketcap.com, and were accessed in March 2024. Note that this ranking includes publicly-traded companies only.
Data and Highlights
The data we used to create this list of largest U.S. corporations by number of employees can be found in the table below.
| Company | Sector | Number of Employees |
|---|---|---|
| Walmart | Consumer Staples | 2,100,000 |
| Amazon | Consumer Discretionary | 1,500,000 |
| UPS | Industrials | 500,000 |
| Home Depot | Consumer Discretionary | 470,000 |
| Concentrix | Information Technology | 440,000 |
| Target | Consumer Staples | 440,000 |
| Kroger | Consumer Staples | 430,000 |
| UnitedHealth | Health Care | 400,000 |
| Berkshire Hathaway | Financials | 383,000 |
| Starbucks | Consumer Discretionary | 381,000 |
| Marriott International | Consumer Discretionary | 377,000 |
| Cognizant | Information Technology | 346,600 |
Retail and Logistics Top the List
Companies like Walmart, Target, and Kroger have a massive headcount due to having many locations spread across the country, which require everything from cashiers to IT professionals.
Moving goods around the world is also highly labor intensive, explaining why UPS has half a million employees globally.
Below the Radar?
Two companies that rank among the largest U.S. corporations by employees which may be less familiar to the public include Concentrix and Cognizant. Both of these companies are B2B brands, meaning they primarily work with other companies rather than consumers. This contrasts with brands like Amazon or Home Depot, which are much more visible among average consumers.
A Note on Berkshire Hathaway
Warren Buffett’s company doesn’t directly employ 383,000 people. This headcount actually includes the employees of the firm’s many subsidiaries, such as GEICO (insurance), Dairy Queen (retail), and Duracell (batteries).
If you’re curious to see how Buffett’s empire has grown over the years, check out this animated graphic that visualizes the growth of Berkshire Hathaway’s portfolio from 1994 to 2022.

-

 Real Estate2 weeks ago
Visualizing America’s Shortage of Affordable Homes
-

 Technology1 week ago
Ranked: Semiconductor Companies by Industry Revenue Share
-

 Money1 week ago
Which States Have the Highest Minimum Wage in America?
-

 Real Estate1 week ago
Ranked: The Most Valuable Housing Markets in America
-

 Business2 weeks ago
Charted: Big Four Market Share by S&P 500 Audits
-

 AI2 weeks ago
The Stock Performance of U.S. Chipmakers So Far in 2024
-

 Misc2 weeks ago
Almost Every EV Stock is Down After Q1 2024
-

 Money2 weeks ago
Where Does One U.S. Tax Dollar Go?