Economy
The 20 Fastest Growing Jobs in the Next Decade


How is the Job Market Shifting Over the Next Decade?
The employment landscape is constantly shifting. While agricultural jobs played a big role in the 19th century, a large portion of U.S. jobs today are in administration, sales, or transportation. So how can job seekers identify the fastest growing jobs of the future?
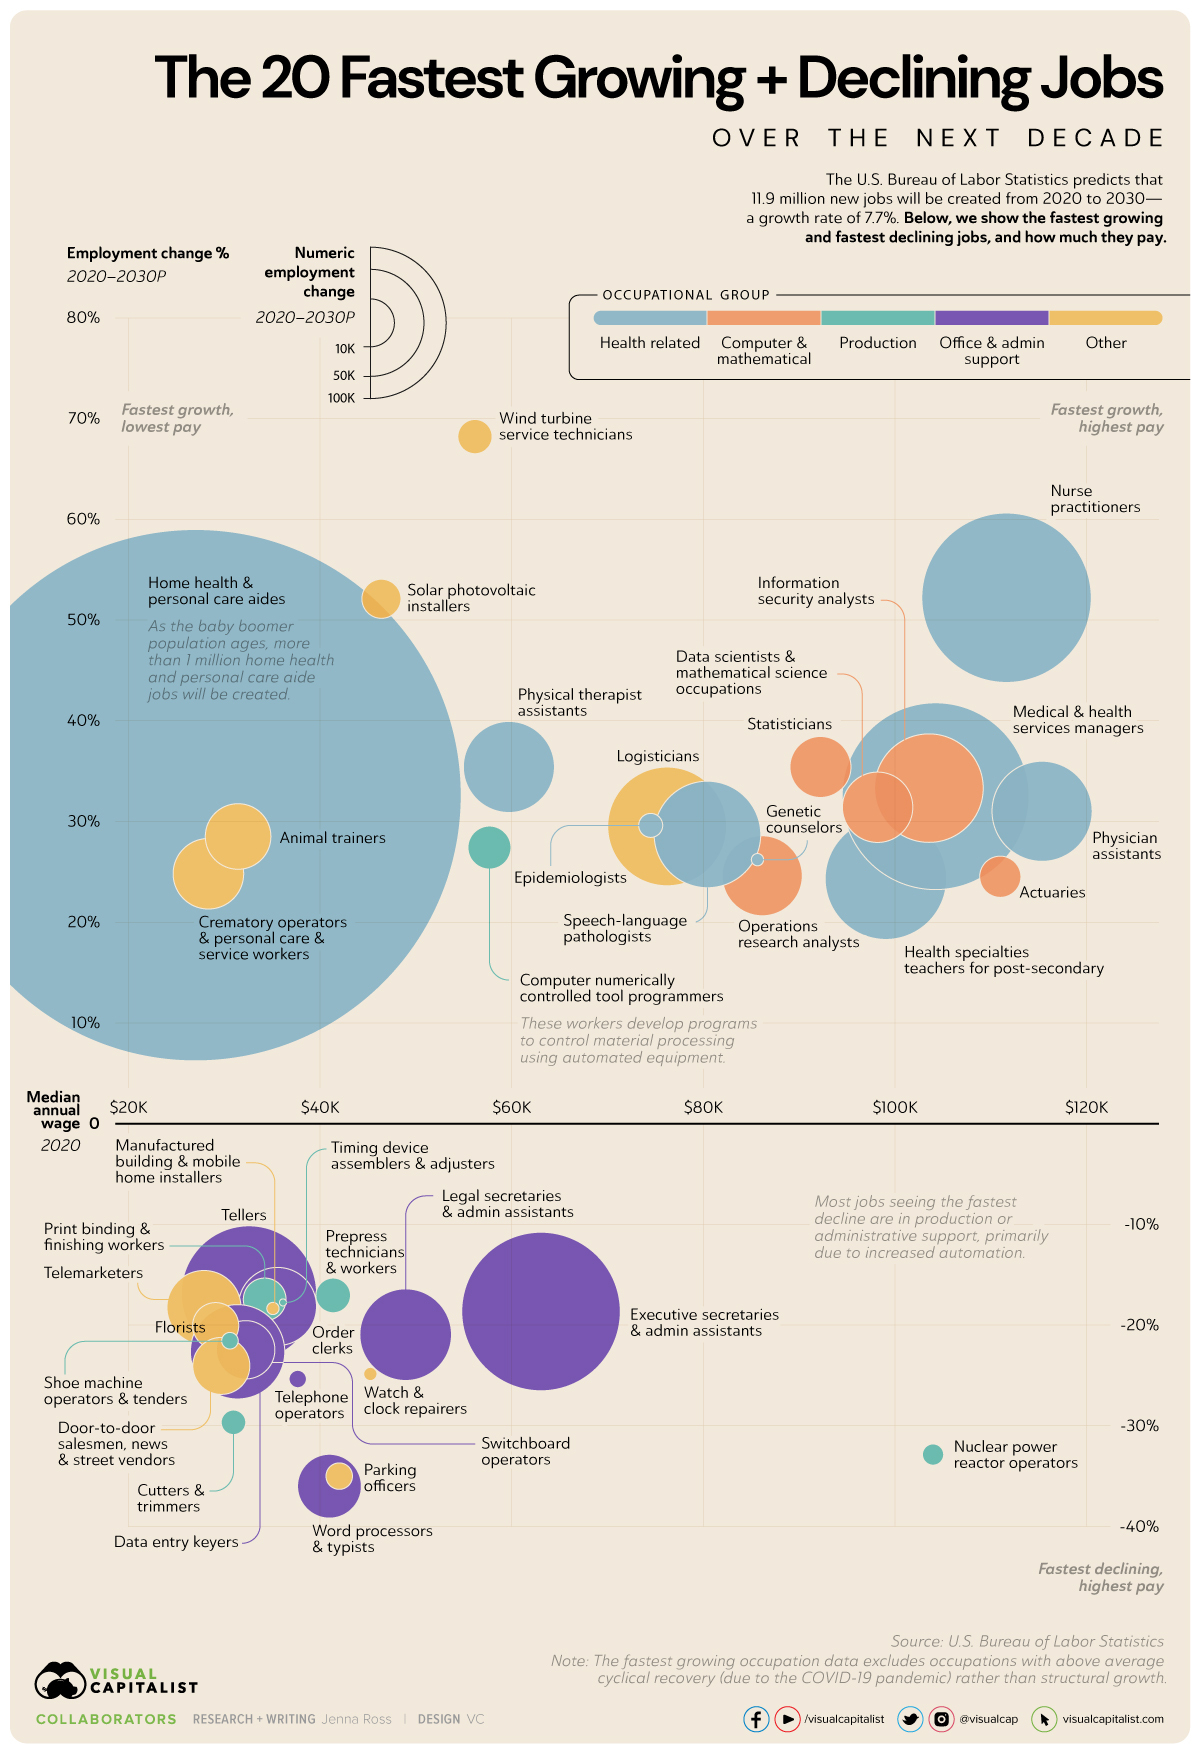
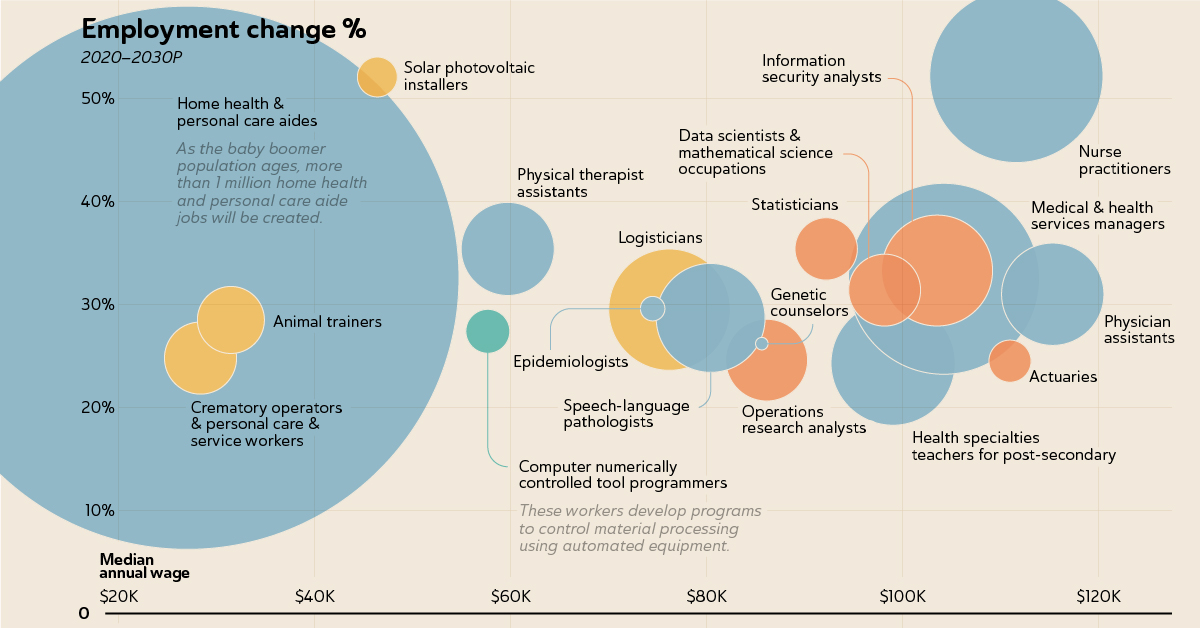
The U.S. Bureau of Labor Statistics (BLS) projects there will be 11.9 million new jobs created from 2020 to 2030, an overall growth rate of 7.7%. However, some jobs have a growth rate that far exceeds this level. In this graphic, we use BLS data to show the fastest growing jobs—and fastest declining jobs—and how much they each pay.
The Top 20 Fastest Growing Jobs
We used the dataset that excludes occupations with above average cyclical recovery from the COVID-19 pandemic. For example, jobs such as motion picture projectionists, ticket takers, and restaurant cooks were removed. Once these exclusions were made, the resulting list reflects long-term structural growth.
Here are the fastest growing jobs from 2020 to 2030, along with the number of jobs that will be created and the median pay for the position.
| Occupation | Percent employment change, 2020–2030P | Numeric employment change, 2020-2030P | Median annual wage, 2020 |
|---|---|---|---|
| Wind turbine service technicians | 68.2% | 4,700 | $56,230 |
| Nurse practitioners | 52.2% | 114,900 | $111,680 |
| Solar photovoltaic installers | 52.1% | 6,100 | $46,470 |
| Statisticians | 35.4% | 14,900 | $92,270 |
| Physical therapist assistants | 35.4% | 33,200 | $59,770 |
| Information security analysts | 33.3% | 47,100 | $103,590 |
| Home health and personal care aides | 32.6% | 1,129,900 | $27,080 |
| Medical and health services managers | 32.5% | 139,600 | $104,280 |
| Data scientists and mathematical science occupations, all other | 31.4% | 19,800 | $98,230 |
| Physician assistants | 31.0% | 40,100 | $115,390 |
| Epidemiologists | 29.6% | 2,300 | $74,560 |
| Logisticians | 29.5% | 56,400 | $76,270 |
| Speech-language pathologists | 28.7% | 45,400 | $80,480 |
| Animal trainers | 28.5% | 17,200 | $31,520 |
| Computer numerically controlled tool programmers | 27.4% | 7,400 | $57,740 |
| Genetic counselors | 26.2% | 600 | $85,700 |
| Crematory operators and personal care and service workers, all other | 24.8% | 19,900 | $28,420 |
| Operations research analysts | 24.6% | 25,600 | $86,200 |
| Actuaries | 24.5% | 6,800 | $111,030 |
| Health specialties teachers, post-secondary | 24.3% | 58,900 | $99,090 |
Wind turbine service technicians have the fastest growth rate, with solar photovoltaic (solar panel) installers taking the third slot. The rapid growth is driven by demand for renewable energy. However, because these are relatively small occupations, the two roles will account for about 11,000 new jobs collectively.
Nine of the top 20 fastest growing jobs are in healthcare or related fields, as the baby boomer population ages and chronic conditions are on the rise. Home health and personal care aides, who assist with routine healthcare tasks such as bathing and feeding, will account for over one million new jobs in the next decade. This will be almost 10% of all new jobs created between 2020 and 2030. Unfortunately, these workers are the lowest paid on the list.
Computer and math-related jobs are also expected to see high growth. The BLS expects strong demand for IT security and software development, partly because of the increase in people that are working from home.
The Top 20 Fastest Declining Jobs
Structural changes in the economy will cause some jobs to decline quite quickly. Here are the top 20 jobs where employment is expected to decline the fastest over the next decade.
| Occupation | Percent employment change, 2020–2030P | Numeric employment change, 2020-2030P | Median annual wage, 2020 |
|---|---|---|---|
| Word processors and typists | -36.0% | -16,300 | $41,050 |
| Parking enforcement workers | -35.0% | -2,800 | $42,070 |
| Nuclear power reactor operators | -32.9% | -1,800 | $104,040 |
| Cutters and trimmers, hand | -29.7% | -2,400 | $31,630 |
| Telephone operators | -25.4% | -1,200 | $37,710 |
| Watch and clock repairers | -24.9% | -700 | $45,290 |
| Door-to-door sales workers, news and street vendors, and related workers | -24.1% | -13,000 | $29,730 |
| Switchboard operators, including answering service | -22.7% | -13,600 | $31,430 |
| Data entry keyers | -22.5% | -35,600 | $34,440 |
| Shoe machine operators and tenders | -21.6% | -1,100 | $30,630 |
| Legal secretaries and administrative assistants | -21.0% | -33,600 | $48,980 |
| Floral designers | -20.1% | -8,500 | $29,140 |
| Executive secretaries and executive administrative assistants | -18.7% | -100,600 | $63,110 |
| Manufactured building and mobile home installers | -18.4% | -600 | $35,120 |
| Telemarketers | -18.3% | -21,900 | $27,920 |
| Order clerks | -18.2% | -24,400 | $35,590 |
| Timing device assemblers and adjusters | -17.8% | -200 | $36,170 |
| Print binding and finishing workers | -17.5% | -7,300 | $34,260 |
| Prepress technicians and workers | -17.1% | -4,800 | $41,410 |
| Tellers | -16.9% | -73,100 | $32,620 |
Eight of the top 20 declining jobs are in office and administrative support. This could be cause for concern, given this category currently makes up almost 13% of employment in the U.S.—the largest of any major category. Jobs involved in the production of goods and services, as well as sales jobs, are also seeing declines.
In all cases, automation is likely the biggest culprit. For example, software that automatically converts audio to text will reduce the need for typists.
While the fastest declining jobs typically fall within the lower salary range, there is one outlier. Nuclear power reactor operators, who earn a salary of over $100,000, will see employment decline at a steep rate of -33%. No new nuclear plants have opened since the 1990s, and nuclear power faces steep competition from renewable energy sources.
Warning: Education Required
As the composition of employment shifts, it eliminates some jobs and creates others. For instance, while production jobs are declining, new opportunities exist for “computer numerically controlled tool programmers.” These workers develop programs to control the automated equipment that processes materials.
However, while many of the fastest growing jobs are higher paying, they typically also require advanced education.
| Top 20 Fastest Growing Jobs | Top 20 Fastest Declining Jobs | |
|---|---|---|
| # with median salary > $41,950 | 17 | 5 |
| # with post-secondary education required | 16 | 0 |
Seventeen of the top 20 fastest growing jobs have a median salary higher than $41,950, which is the median salary for all jobs in total. Most also require post-secondary schooling. These opportunities are replacing jobs that only required a high school diploma.
With tuition costs soaring relative to inflation, this could create challenges for displaced workers or young people entering the workforce.


Copper
Brass Rods: The Secure Choice
This graphic shows why brass rods are the secure choice for precision-machined and forged parts.


Brass Rods: The Secure Choice
The unique combination of machinability and recyclability makes brass rods the secure choice for manufacturers seeking future-proof raw material solutions.
This infographic, from the Copper Development Association, shows three ways brass rods give manufacturers greater control and a license to grow in the competitive market for precision-machined and forged products.
Future-Proof Investments in New Machine Tools
A material’s machinability directly impacts machine throughput, which typically has the largest impact on machine shop profitability.
The high-speed machining capabilities of brass rods maximize machine tool performance, allowing manufacturers to run the material faster and longer without sacrificing tool life, chip formation, or surface quality.
The high machining efficiency of brass leads to reduced per-part costs, quicker return on investment (ROI) for new machine tools, and expanded production capacity for new projects.
Supply Security Through Closed Loop Recycling
Brass, like its parent element copper, can be infinitely recycled.
In 2022, brass- and wire-rod mills accounted for the majority of the 830,000 tonnes of copper recycled from scrap in the United States.
Given that scrap ratios for machined parts typically range from 60-70% by weight, producing mills benefit from a secure and steady supply of clean scrap returned directly from customers, which is recycled to create new brass rods.
The high residual value of brass scrap creates a strong recycling incentive. Scrap buy back programs give manufacturers greater control over raw material net costs as scrap value is often factored into supplier purchase agreements.
Next Generation Alloys for a Lead-Free Future
Increasingly stringent global regulations continue to pressure manufacturers to minimize the use of materials containing trace amounts of lead and other harmful impurities.
The latest generation of brass-rod alloys is engineered to meet the most demanding criteria for lead leaching in drinking water and other sensitive applications.
Seven brass-rod alloys passed rigorous testing to become the only ‘Acceptable Materials’ against lower lead leaching criteria recently adopted in the national U.S. drinking water quality standard, NSF 61.
Learn more about the advantages of brass rods solutions.

-

 Base Metals1 year ago
Ranked: The World’s Largest Copper Producers
Many new technologies critical to the energy transition rely on copper. Here are the world’s largest copper producers.
-

 Silver2 years ago
Mapped: Solar Power by Country in 2021
In 2020, solar power saw its largest-ever annual capacity expansion at 127 gigawatts. Here’s a snapshot of solar power capacity by country.
-

 Batteries5 years ago
Visualizing Copper’s Role in the Transition to Clean Energy
A clean energy transition is underway as wind, solar, and batteries take center stage. Here’s how copper plays the critical role in these technologies.
-

 Science5 years ago
Everything You Need to Know on VMS Deposits
Deep below the ocean’s waves, VMS deposits spew out massive amounts of minerals like copper, zinc, and gold, making them a key source of the metals…
-
 Copper5 years ago
How Much Copper is in an Electric Vehicle?
Have you ever wondered how much copper is in an electric vehicle? This infographic shows the metal’s properties as well as the quantity of copper used.
-
 Copper6 years ago
Copper: Driving the Green Energy Revolution
Renewable energy is set to fuel a new era of copper demand – here’s how much copper is used in green applications from EVs to photovoltaics.


-

 Maps2 weeks ago
Mapped: Average Wages Across Europe
-

 Money1 week ago
Which States Have the Highest Minimum Wage in America?
-

 Real Estate1 week ago
Ranked: The Most Valuable Housing Markets in America
-

 Markets1 week ago
Charted: Big Four Market Share by S&P 500 Audits
-

 AI1 week ago
The Stock Performance of U.S. Chipmakers So Far in 2024
-

 Automotive2 weeks ago
Almost Every EV Stock is Down After Q1 2024
-

 Money2 weeks ago
Where Does One U.S. Tax Dollar Go?
-

 Green2 weeks ago
Ranked: Top Countries by Total Forest Loss Since 2001