Culture
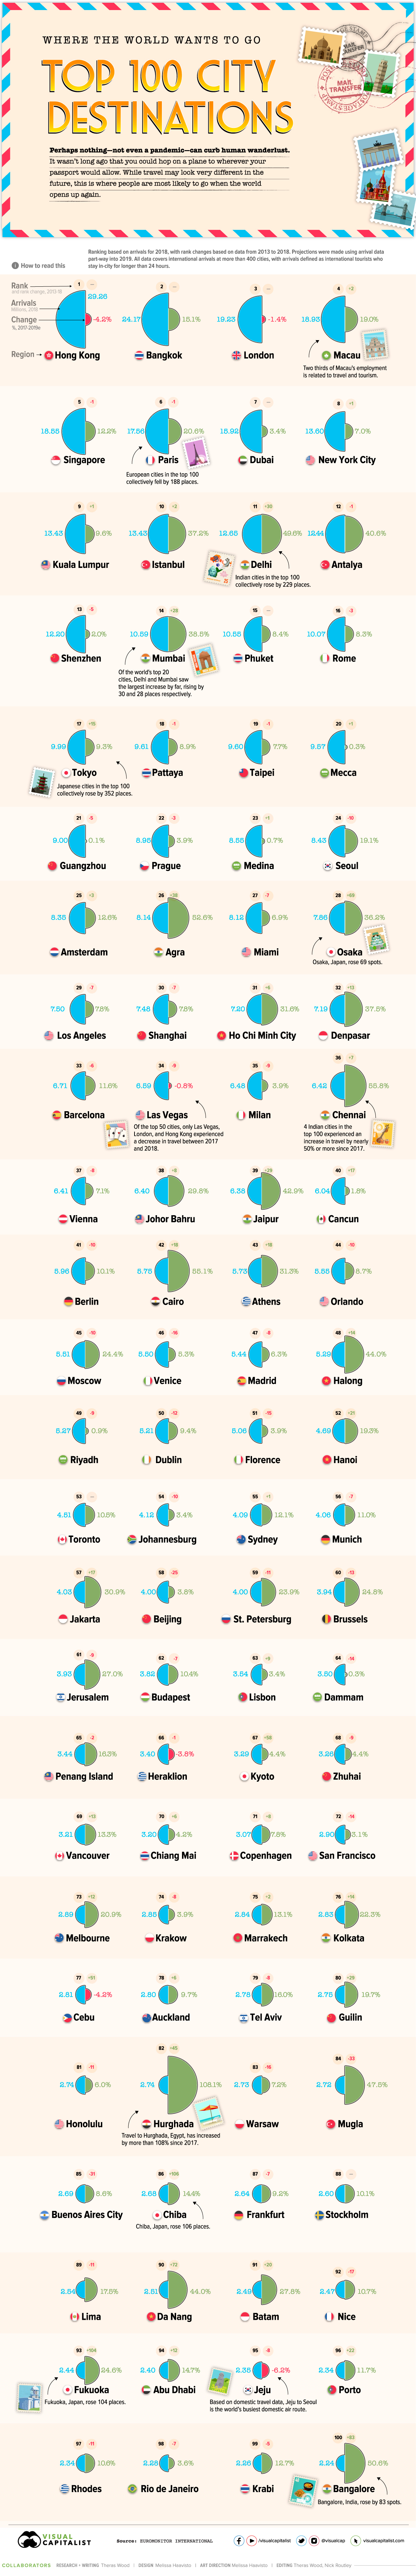
The 100 Most Popular City Destinations
The 100 Most Popular City Destinations
The pandemic has grounded many of us, but it can’t curb human wanderlust.
Cities like Hong Kong, Bangkok, and London have led city destination rankings for years, but movement within the ranks below them—revealed in the above infographic—help to highlight the intriguing travel trends happening before COVID-19.
With data from Euromonitor International’s 2019 travel report, we can uncover where travelers are likely headed once their passports are useful again. Pulling data from 400 cities, collected into mid-2019, the report encompasses millions of international travelers who stayed at their destination longer than 24 hours.
Here’s a closer look at where travelers are likely to touch down in post-pandemic life.
Not-So-Lonely At the Top
Although the top of this list has remained fairly stable in terms of rank in recent years, two cities have seen an impressive influx of travelers.
Paris and Istanbul both made significant gains between 2017 and 2019 with 20.6% and 37.2% growth in visitors respectively:
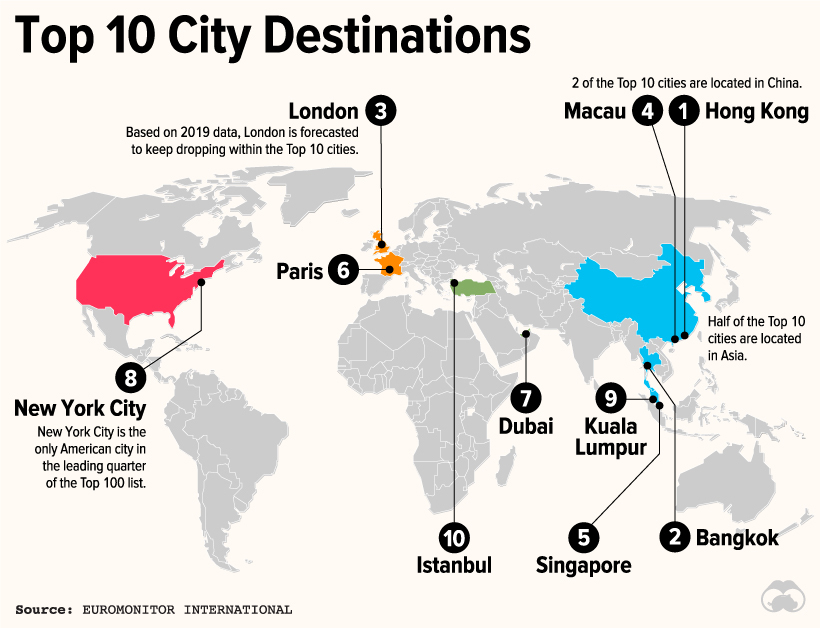
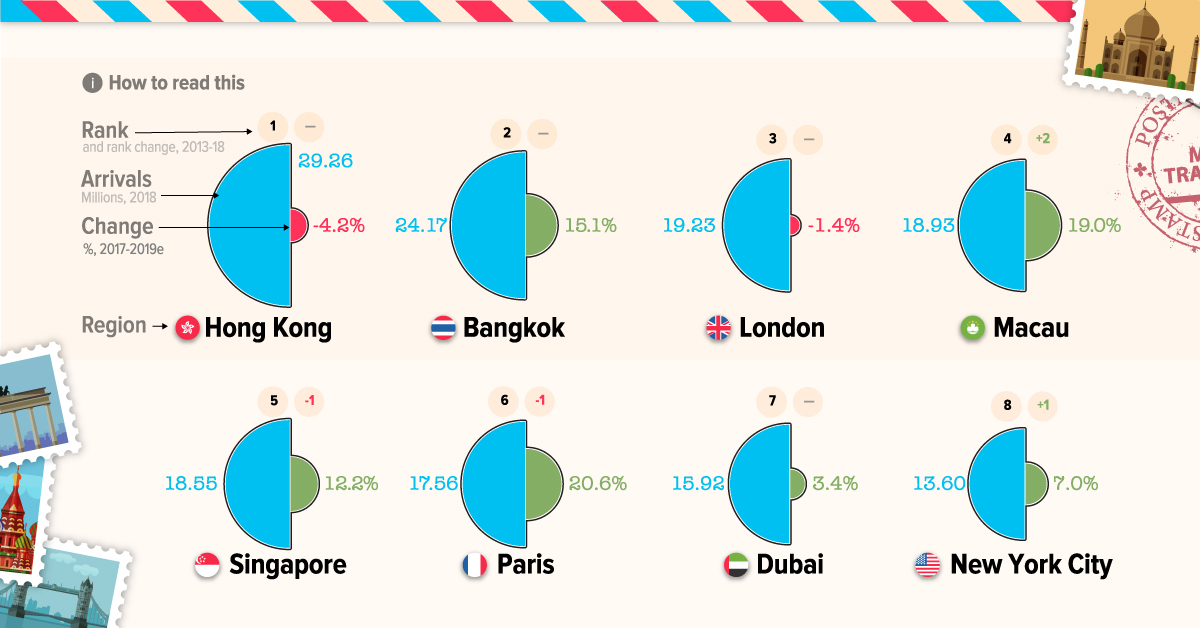
Note that only one North American city, New York City, is found in this top 10. As well, Asian cities account for half of the leading group, with two of the top 10 cities are located in China. Although Hong Kong leads the top 100 list, political turmoil led to a marked decline of international visitors of 4.2% from 2017 to 2019.
The largest rank changes in the top 10 were made by Macau and Istanbul, but the rise was subtle. Both cities gained two spots each between 2013 and 2018, though each had sizable traveler growth rates, with Macau growing by 19.0%.
| Rank | City | Country | Arrivals (Millions) | 5yr Rank Change | Growth ('17-19) |
|---|---|---|---|---|---|
| 1 | Hong Kong | China (SAR) | 29.26 | — | -4.2% |
| 2 | Bangkok | Thailand | 24.17 | — | 15.1% |
| 3 | London | United Kingdom | 19.23 | — | -1.4% |
| 4 | Macau | China (SAR) | 18.93 | 2 | 19.0% |
| 5 | Singapore | Singapore | 18.55 | -1 | 12.2% |
| 6 | Paris | France | 17.56 | -1 | 20.6% |
| 7 | Dubai | UAE | 15.92 | — | 3.4% |
| 8 | New York City | US | 13.60 | 1 | 7.0% |
| 9 | Kuala Lumpur | Malaysia | 13.43 | 1 | 9.6% |
| 10 | Istanbul | Turkey | 13.43 | 2 | 37.2% |
| 11 | Delhi | India | 12.65 | 30 | 49.6% |
| 12 | Antalya | Turkey | 12.44 | -1 | 40.6% |
| 13 | Shenzhen | China | 12.20 | -5 | 2.0% |
| 14 | Mumbai | India | 10.59 | 28 | 38.5% |
| 15 | Phuket | Thailand | 10.55 | — | 8.4% |
| 16 | Rome | Italy | 10.07 | -3 | 8.3% |
| 17 | Tokyo | Japan | 9.99 | 15 | 9.3% |
| 18 | Pattaya | Thailand | 9.61 | -1 | 8.9% |
| 19 | Taipei | Taiwan, China | 9.60 | -1 | 7.7% |
| 20 | Mecca | Saudi Arabia | 9.57 | 1 | 0.3% |
| 21 | Guangzhou | China | 9.00 | -5 | 0.1% |
| 22 | Prague | Czechia | 8.95 | -3 | 3.9% |
| 23 | Medina | Saudi Arabia | 8.55 | 1 | 0.7% |
| 24 | Seoul | South Korea | 8.43 | -10 | 19.1% |
| 25 | Amsterdam | Netherlands | 8.35 | 3 | 12.6% |
| 26 | Agra | India | 8.14 | 38 | 52.6% |
| 27 | Miami | US | 8.12 | -7 | 6.9% |
| 28 | Osaka | Japan | 7.86 | 69 | 36.2% |
| 29 | Los Angeles | US | 7.50 | -7 | 7.8% |
| 30 | Shanghai | China | 7.48 | -7 | 7.8% |
| 31 | Ho Chi Minh City | Vietnam | 7.20 | 6 | 31.6% |
| 32 | Denpasar | Indonesia | 7.19 | 13 | 37.5% |
| 33 | Barcelona | Spain | 6.71 | -6 | 11.6% |
| 34 | Las Vegas | US | 6.59 | -9 | -0.8% |
| 35 | Milan | Italy | 6.48 | -9 | 3.9% |
| 36 | Chennai | India | 6.42 | 7 | 55.8% |
| 37 | Vienna | Austria | 6.41 | -8 | 7.1% |
| 38 | Johor Bahru | Malaysia | 6.40 | 8 | 29.8% |
| 39 | Jaipur | India | 6.38 | 29 | 42.9% |
| 40 | Cancun | Mexico | 6.04 | 17 | 1.8% |
| 41 | Berlin | Germany | 5.96 | -10 | 10.1% |
| 42 | Cairo | Egypt | 5.75 | 18 | 55.1% |
| 43 | Athens | Greece | 5.73 | 18 | 31.3% |
| 44 | Orlando | US | 5.55 | -10 | 8.7% |
| 45 | Moscow | Russia | 5.51 | -10 | 24.4% |
| 46 | Venice | Italy | 5.50 | -16 | 5.3% |
| 47 | Madrid | Spain | 5.44 | -8 | 6.3% |
| 48 | Ha Long | Vietnam | 5.29 | 14 | 44.0% |
| 49 | Riyadh | Saudi Arabia | 5.27 | -9 | 0.9% |
| 50 | Dublin | Ireland | 5.21 | -12 | 9.4% |
| 51 | Florence | Italy | 5.06 | -15 | 3.9% |
| 52 | Ha Noi | Vietnam | 4.69 | 21 | 19.3% |
| 53 | Toronto | Canada | 4.51 | — | 10.5% |
| 54 | Johannesburg | South Africa | 4.12 | -10 | 3.4% |
| 55 | Sydney | Australia | 4.09 | 1 | 12.1% |
| 56 | Munich | Germany | 4.06 | -7 | 11.0% |
| 57 | Jakarta | Indonesia | 4.03 | 17 | 30.9% |
| 58 | Beijing | China | 4.00 | -25 | 3.8% |
| 59 | St. Petersburg | Russia | 4.00 | -11 | 23.9% |
| 60 | Brussels | Belgium | 3.94 | -13 | 24.8% |
| 61 | Jerusalem | Israel | 3.93 | -9 | 27.0% |
| 62 | Budapest | Hungary | 3.82 | -7 | 10.4% |
| 63 | Lisbon | Portugal | 3.54 | 9 | 3.4% |
| 64 | Dammam | Saudi Arabia | 3.50 | -14 | 0.3% |
| 65 | Penang Island | Malaysia | 3.44 | -2 | 16.3% |
| 66 | Heraklion | Greece | 3.40 | -1 | -3.8% |
| 67 | Kyoto | Japan | 3.29 | 58 | 4.4% |
| 68 | Zhuhai | China | 3.26 | -9 | 4.4% |
| 69 | Vancouver | Canada | 3.21 | 13 | 13.3% |
| 70 | Chiang Mai | Thailand | 3.20 | 6 | 4.2% |
| 71 | Copenhagen | Denmark | 3.07 | 8 | 7.8% |
| 72 | San Francisco | US | 2.90 | -14 | 3.1% |
| 73 | Melbourne | Australia | 2.89 | 12 | 20.9% |
| 74 | Krakow | Poland | 2.85 | -8 | 3.9% |
| 75 | Marrakech | Morocco | 2.84 | 2 | 13.1% |
| 76 | Kolkatta | India | 2.83 | 14 | 22.3% |
| 77 | Cebu | Philippines | 2.81 | 51 | -4.2% |
| 78 | Auckland | New Zealand | 2.80 | 6 | 9.7% |
| 79 | Tel Aviv | Israel | 2.78 | -8 | 16.0% |
| 80 | Guilin | China | 2.75 | 29 | 19.7% |
| 81 | Honolulu | US | 2.74 | -11 | 6.0% |
| 82 | Hurgada | Egypt | 2.74 | 45 | 108.1% |
| 83 | Warsaw | Poland | 2.73 | -16 | 7.2% |
| 84 | Mugla | Turkey | 2.72 | -33 | 47.5% |
| 85 | Buenos Aires City | Argentina | 2.69 | -31 | 8.6% |
| 86 | Chiba | Japan | 2.68 | 106 | 14.4% |
| 87 | Frankfurt | Germany | 2.64 | -7 | 9.2% |
| 88 | Stockholm | Sweden | 2.60 | — | 10.1% |
| 89 | Lima | Peru | 2.54 | -11 | 17.5% |
| 90 | Da Nang | Vietnam | 2.51 | 72 | 44.0% |
| 91 | Batam | Indonesia | 2.49 | 20 | 27.8% |
| 92 | Nice | France | 2.47 | -17 | 10.7% |
| 93 | Fukuoka | Japan | 2.44 | 104 | 24.6% |
| 94 | Abu Dhabi | UAE | 2.40 | 12 | 14.7% |
| 95 | Jeju | South Korea | 2.35 | -8 | -6.2% |
| 96 | Porto | Portugal | 2.34 | 22 | 11.7% |
| 97 | Rhodes | Greece | 2.34 | -11 | 10.6% |
| 98 | Rio de Janeiro | Brazil | 2.28 | -7 | 3.6% |
| 99 | Krabi | Thailand | 2.26 | -5 | 12.7% |
| 100 | Bangalore | India | 2.24 | 83 | 50.6% |
It’s also worth noting that based on the data collected into 2019, London was projected to continue its downward trend, bringing it to 5th spot—mostly due to complications brought on by Brexit and associated visa restrictions.
Trending: Indian and Japanese Cities Take Flight
Most of the dramatic shifts in city travel patterns are happening below the top 10. Asian hot spots are gaining steam and swiftly making their way up the top 100 rankings, signaling a shift in global preferences before lockdowns began.
Take Japan for instance. The five Japanese cities in the top 100 rose by 352 places collectively since 2013. The country’s top city destinations have had an average traveler growth rate of 17.8% from 2017 to 2019. In light of Japan’s impeccable containment of COVID-19, that trend may be compounded in coming years.
Japan’s dramatic rise in the ranks is echoed by India. India’s seven cities in the top 100 have risen 229 places — with a huge average growth rate of 44.6% from 2017 to 2019. Some of that growth is the result of lifestyle tourism, particularly in the case of Delhi, which saw its traveler rate grow by 49.6% since 2017.
Prior to the pandemic, Delhi was expected to continue that steady growth and experience a leap in rank, which currently sits at 11.
With health and wellness tourism on the rise, India has gained noteworthy attention for its yoga retreats and Ayurveda practices. Delhi’s connectivity to important locations across North India has boosted inbound arrivals to the city.
— Euromonitor International
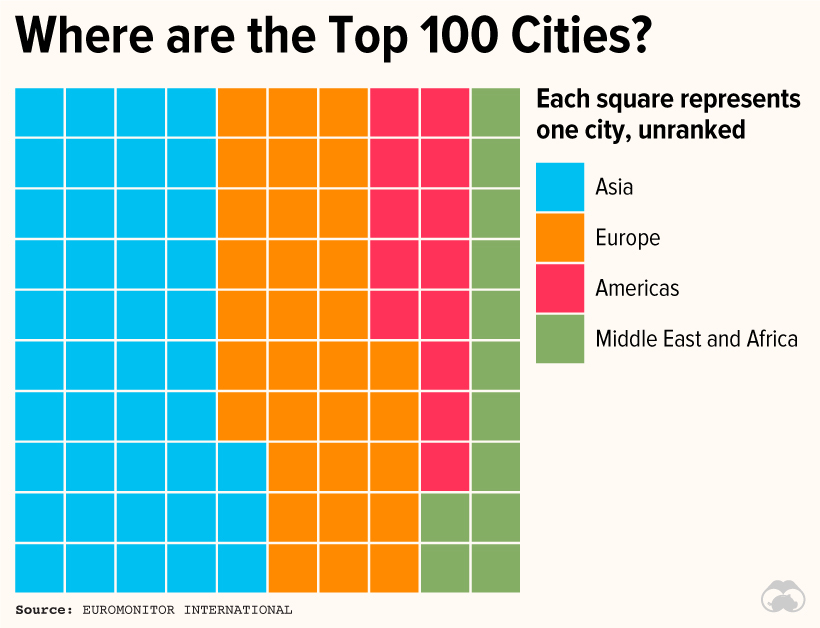
Where in the World? Asia and Europe
Asia continues to lead all other regions, followed by Europe.
Since 2013, the number of Asian cities in the top 100 has grown from 34 to 43. Asian outbound travel has also seen a surge, spurring a rise in travel campaigns from Europe and the Americas that target Asian travelers on social media platforms like WeChat.
Why the Ranking Matters: In Travel, They Trust
Before the pandemic, tourism was considered a leading and resilient economic sector.
In 2019, 1.5 billion people traveled internationally. By 2030, that number could grow to 1.8 billion—and many cities could become increasingly reliant on tourist dollars.
According to the World Travel and Tourism Council, cities like Macau, Cancun, Marrakech, and Las Vegas are all heavily dependent on direct tourism and travel contributions to their respective GDPs. As of 2018, more than 50% of Macau’s GDP was derived directly from tourism, while almost half of Cancun’s GDP relies on travelers.
Countries like India and the Philippines are also particularly reliant on travel. India has a related job-to-tourist ratio of two jobs for every tourist and the Philippines has a ratio of one job per tourist.
By 2030, there could be 1.8 billion tourists – just over one in five persons in the world–traveling around the globe.
— United Nations World Tourism Organization
Where to Next? Wheels Up
Millions of travelers don’t lie — the siren call of cities is undeniable. In turn, those tourists have become a major lifeforce for many of these destinations, and a boon for the international travel industry.
The pandemic has thrown these dynamics off course, with much of the world grinding to a halt since early 2020. However, it’s only a matter of time before the world opens back up again.
Although travel may look very different in the future, wanderlust doesn’t simply disappear. In fact, frustrated travelers — including digital nomads and remote workers — may have all the more reason to run away.


Technology
How Tech Logos Have Evolved Over Time
From complete overhauls to more subtle tweaks, these tech logos have had quite a journey. Featuring: Google, Apple, and more.


How Tech Logos Have Evolved Over Time
This was originally posted on our Voronoi app. Download the app for free on iOS or Android and discover incredible data-driven charts from a variety of trusted sources.
One would be hard-pressed to find a company that has never changed its logo. Granted, some brands—like Rolex, IBM, and Coca-Cola—tend to just have more minimalistic updates. But other companies undergo an entire identity change, thus necessitating a full overhaul.
In this graphic, we visualized the evolution of prominent tech companies’ logos over time. All of these brands ranked highly in a Q1 2024 YouGov study of America’s most famous tech brands. The logo changes are sourced from 1000logos.net.
How Many Times Has Google Changed Its Logo?
Google and Facebook share a 98% fame rating according to YouGov. But while Facebook’s rise was captured in The Social Network (2010), Google’s history tends to be a little less lionized in popular culture.
For example, Google was initially called “Backrub” because it analyzed “back links” to understand how important a website was. Since its founding, Google has undergone eight logo changes, finally settling on its current one in 2015.
| Company | Number of Logo Changes |
|---|---|
| 8 | |
| HP | 8 |
| Amazon | 6 |
| Microsoft | 6 |
| Samsung | 6 |
| Apple | 5* |
Note: *Includes color changes. Source: 1000Logos.net
Another fun origin story is Microsoft, which started off as Traf-O-Data, a traffic counter reading company that generated reports for traffic engineers. By 1975, the company was renamed. But it wasn’t until 2012 that Microsoft put the iconic Windows logo—still the most popular desktop operating system—alongside its name.
And then there’s Samsung, which started as a grocery trading store in 1938. Its pivot to electronics started in the 1970s with black and white television sets. For 55 years, the company kept some form of stars from its first logo, until 1993, when the iconic encircled blue Samsung logo debuted.
Finally, Apple’s first logo in 1976 featured Isaac Newton reading under a tree—moments before an apple fell on his head. Two years later, the iconic bitten apple logo would be designed at Steve Jobs’ behest, and it would take another two decades for it to go monochrome.

-

 Mining1 week ago
Gold vs. S&P 500: Which Has Grown More Over Five Years?
-

 Markets2 weeks ago
Ranked: The Most Valuable Housing Markets in America
-

 Money2 weeks ago
Which States Have the Highest Minimum Wage in America?
-

 AI2 weeks ago
Ranked: Semiconductor Companies by Industry Revenue Share
-

 Markets2 weeks ago
Ranked: The World’s Top Flight Routes, by Revenue
-

 Countries2 weeks ago
Population Projections: The World’s 6 Largest Countries in 2075
-

 Markets2 weeks ago
The Top 10 States by Real GDP Growth in 2023
-

 Demographics2 weeks ago
The Smallest Gender Wage Gaps in OECD Countries