Markets
Comparing THC vs. CBD: What’s the Difference?
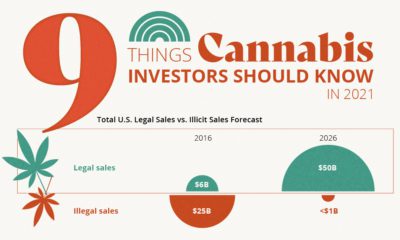
The business of legal cannabis is rapidly growing on both medicinal and recreational fronts. In fact, last year legal cannabis sales soared in the United States to $5.4 billion, a 17.4% increase.
However, cannabis itself is a fairly perplexing substance. It has close to 500 active compounds, and at least 113 of these belong to a family of diverse chemical compounds called cannabinoids.
Of this group, the two most common and researched compounds are THC and CBD – but they are vastly different. As new strains and product offerings become available in the legal cannabis sector, it is more important than ever before for investors to understand the difference between these two compounds.
Comparing THC vs. CBD: What’s the Difference?
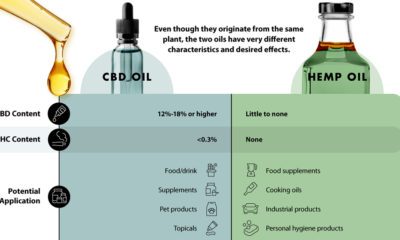
The following infographic comes to us from food sciences company Lexaria Bioscience (OTCQB:LXRP) (CSE:LXX) and it shows the key differences between THC and CBD. It provides fundamental knowledge for investors, patients, and regulators that want to better understand this quickly growing sector of business.
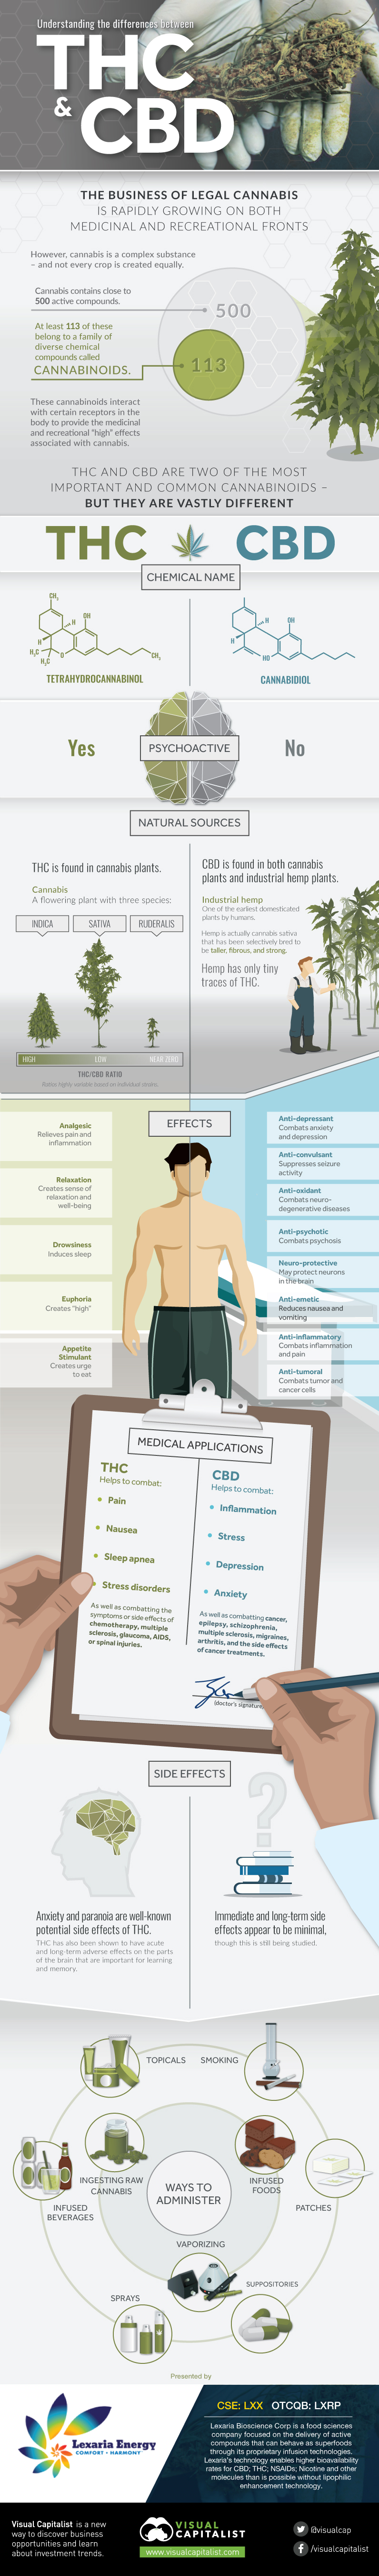
In the comparison of THC vs. CBD, it’s clear that the two compounds are vastly different. While they both interact with receptors in the body, they produce different effects.
To start, THC, or tetrahydrocannabinol, is a psychoactive compound while CBD, or cannabidiol, does not affect the mind in the same capacity.
THC has the following effects on a user:
- Analgesic: Relieves pain and inflammation
- Relaxing: Creates sense of relaxation and well-being
- Drowsiness: Induces sleep
- Euphoria: Creates “high”
- Appetite Stimulant: Creates urge to eat
While CBD’s medicinal effects are making CBD-heavy strains a popular choice for patients:
- Anti-inflammatory: Combats inflammation and pain
- Anticonvulsant: Suppresses seizure activity
- Antiemetic: Reduces nausea and vomiting
- Antipsychotic: Combats psychosis
- Anti-oxidant: Combats neurodegenerative diseases
- Anti-depressant: Combats anxiety and depression
- Anti-tumoral: Combats tumor and cancer cells
- Neuro-protective: May protect neurons in the brain
As a result of these effects, THC is typically used to treat pain, nausea, sleep apnea, or stress disorders, as well as to combat the symptoms or side effects of chemotherapy, multiple sclerosis, glaucoma, AIDS, or spinal injuries.
CBD, on the other hand, is being used to treat inflammation, stress, depression and anxiety, while also being used to combat cancer, epilepsy, schizophrenia, multiple sclerosis, migraines, arthritis, and the side effects of cancer treatments.


Economy
Economic Growth Forecasts for G7 and BRICS Countries in 2024
The IMF has released its economic growth forecasts for 2024. How do the G7 and BRICS countries compare?


G7 & BRICS Real GDP Growth Forecasts for 2024
The International Monetary Fund’s (IMF) has released its real gross domestic product (GDP) growth forecasts for 2024, and while global growth is projected to stay steady at 3.2%, various major nations are seeing declining forecasts.
This chart visualizes the 2024 real GDP growth forecasts using data from the IMF’s 2024 World Economic Outlook for G7 and BRICS member nations along with Saudi Arabia, which is still considering an invitation to join the bloc.
Get the Key Insights of the IMF’s World Economic Outlook
Want a visual breakdown of the insights from the IMF’s 2024 World Economic Outlook report?
This visual is part of a special dispatch of the key takeaways exclusively for VC+ members.
Get the full dispatch of charts by signing up to VC+.
Mixed Economic Growth Prospects for Major Nations in 2024
Economic growth projections by the IMF for major nations are mixed, with the majority of G7 and BRICS countries forecasted to have slower growth in 2024 compared to 2023.
Only three BRICS-invited or member countries, Saudi Arabia, the UAE, and South Africa, have higher projected real GDP growth rates in 2024 than last year.
| Group | Country | Real GDP Growth (2023) | Real GDP Growth (2024P) |
|---|---|---|---|
| G7 | 🇺🇸 U.S. | 2.5% | 2.7% |
| G7 | 🇨🇦 Canada | 1.1% | 1.2% |
| G7 | 🇯🇵 Japan | 1.9% | 0.9% |
| G7 | 🇫🇷 France | 0.9% | 0.7% |
| G7 | 🇮🇹 Italy | 0.9% | 0.7% |
| G7 | 🇬🇧 UK | 0.1% | 0.5% |
| G7 | 🇩🇪 Germany | -0.3% | 0.2% |
| BRICS | 🇮🇳 India | 7.8% | 6.8% |
| BRICS | 🇨🇳 China | 5.2% | 4.6% |
| BRICS | 🇦🇪 UAE | 3.4% | 3.5% |
| BRICS | 🇮🇷 Iran | 4.7% | 3.3% |
| BRICS | 🇷🇺 Russia | 3.6% | 3.2% |
| BRICS | 🇪🇬 Egypt | 3.8% | 3.0% |
| BRICS-invited | 🇸🇦 Saudi Arabia | -0.8% | 2.6% |
| BRICS | 🇧🇷 Brazil | 2.9% | 2.2% |
| BRICS | 🇿🇦 South Africa | 0.6% | 0.9% |
| BRICS | 🇪🇹 Ethiopia | 7.2% | 6.2% |
| 🌍 World | 3.2% | 3.2% |
China and India are forecasted to maintain relatively high growth rates in 2024 at 4.6% and 6.8% respectively, but compared to the previous year, China is growing 0.6 percentage points slower while India is an entire percentage point slower.
On the other hand, four G7 nations are set to grow faster than last year, which includes Germany making its comeback from its negative real GDP growth of -0.3% in 2023.
Faster Growth for BRICS than G7 Nations
Despite mostly lower growth forecasts in 2024 compared to 2023, BRICS nations still have a significantly higher average growth forecast at 3.6% compared to the G7 average of 1%.
While the G7 countries’ combined GDP is around $15 trillion greater than the BRICS nations, with continued higher growth rates and the potential to add more members, BRICS looks likely to overtake the G7 in economic size within two decades.
BRICS Expansion Stutters Before October 2024 Summit
BRICS’ recent expansion has stuttered slightly, as Argentina’s newly-elected president Javier Milei declined its invitation and Saudi Arabia clarified that the country is still considering its invitation and has not joined BRICS yet.
Even with these initial growing pains, South Africa’s Foreign Minister Naledi Pandor told reporters in February that 34 different countries have submitted applications to join the growing BRICS bloc.
Any changes to the group are likely to be announced leading up to or at the 2024 BRICS summit which takes place October 22-24 in Kazan, Russia.
Get the Full Analysis of the IMF’s Outlook on VC+
This visual is part of an exclusive special dispatch for VC+ members which breaks down the key takeaways from the IMF’s 2024 World Economic Outlook.
For the full set of charts and analysis, sign up for VC+.

-

 Markets1 week ago
U.S. Debt Interest Payments Reach $1 Trillion
-

 Business2 weeks ago
Charted: Big Four Market Share by S&P 500 Audits
-

 Real Estate2 weeks ago
Ranked: The Most Valuable Housing Markets in America
-

 Money2 weeks ago
Which States Have the Highest Minimum Wage in America?
-

 AI2 weeks ago
Ranked: Semiconductor Companies by Industry Revenue Share
-

 Markets2 weeks ago
Ranked: The World’s Top Flight Routes, by Revenue
-

 Demographics2 weeks ago
Population Projections: The World’s 6 Largest Countries in 2075
-

 Markets2 weeks ago
The Top 10 States by Real GDP Growth in 2023