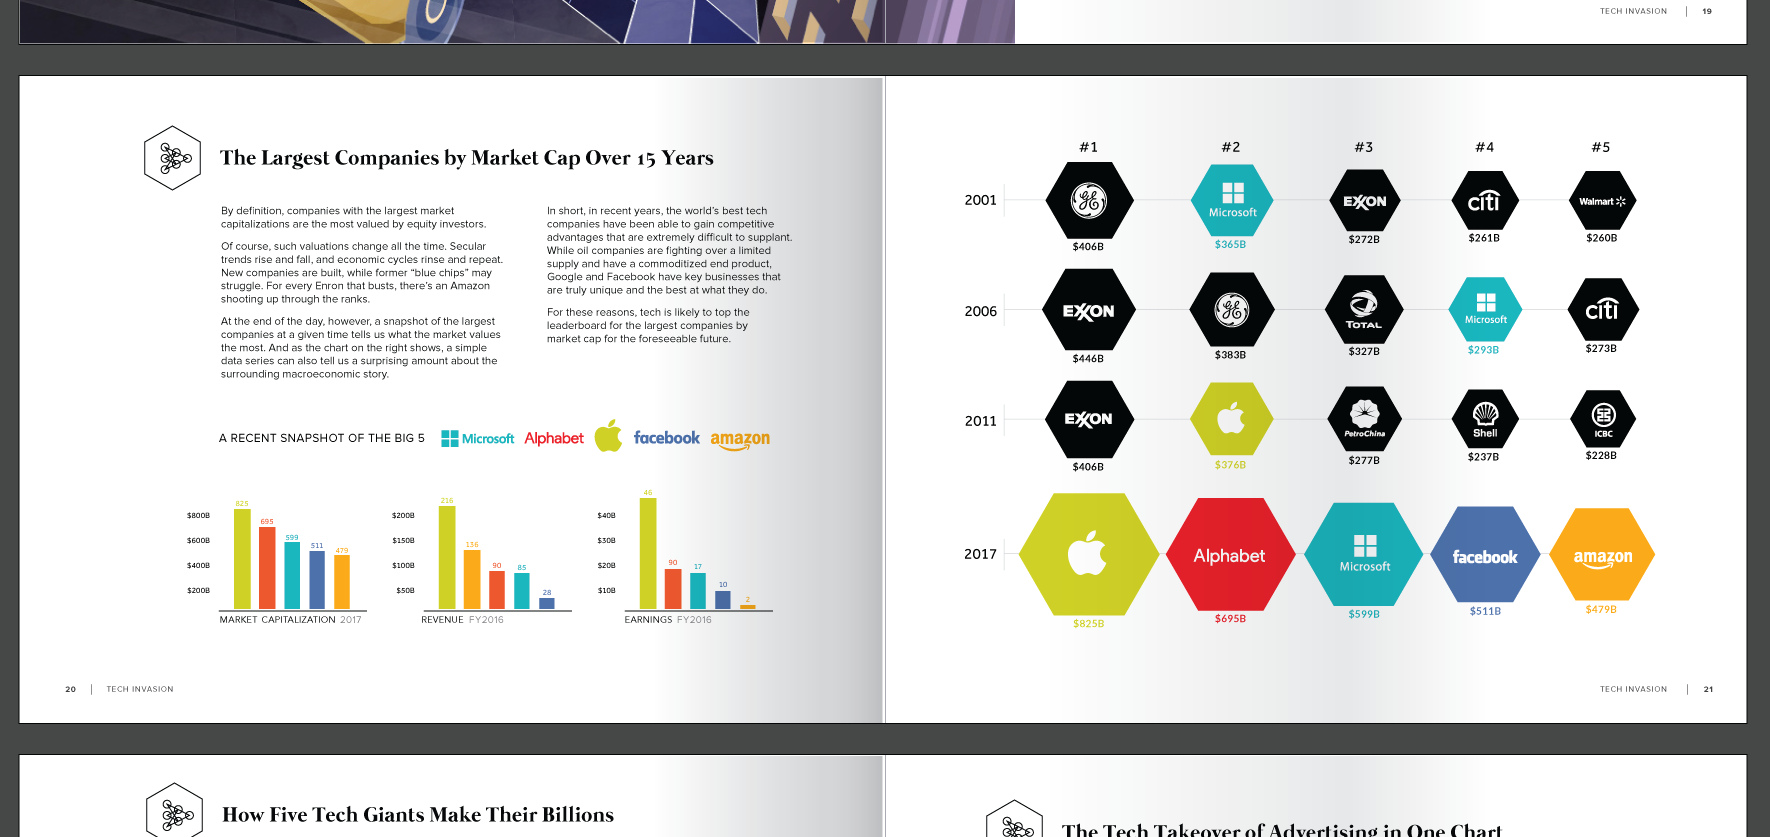
Two example spreads from Visual Capitalist's new book 'Visualizing Change'. Over 12 pages of infographics to sample here, as they would appear in the book.
We roundup the best infographics, charts, and data visualizations that were posted over the year. Don't miss Visual Capitalist's Top Infographics of 2016!

Put down your turkey leftovers - it's time to recap Visual Capitalist's top 15 infographics, data visualizations, and charts of 2015.

The Money Project uses rich visuals such as infographics and data visualizations to explore the concept and implications of money.
In this list, we count down the 14 best Visual Capitalist infographics of 2014.


