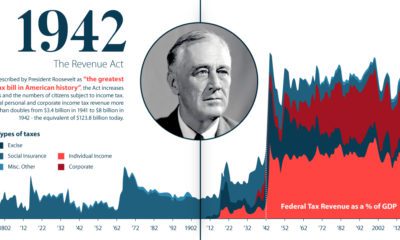

U.S. taxation has undergone massive changes over the last 250 years. From the American Revolution to modern reform, we explore its long history.
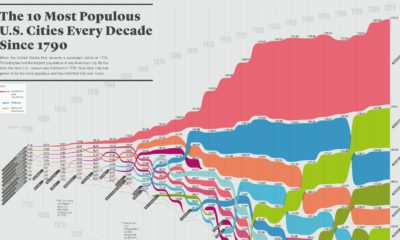

How has the list of the most populous U.S. cities changed over time? This infographic shows the top 10 cities of every decade since the year...


This intense animation plots data on nearly 70 years of arms sales, to compare the influence of the two superpowers from the Cold War to modern...
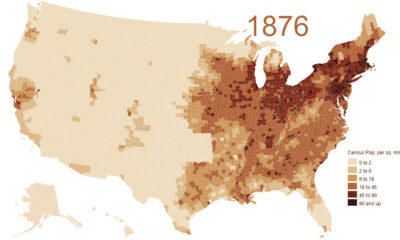

This animation shows the population density of U.S. counties between 1790 and 2010, showing the westward expansion of the country's population.
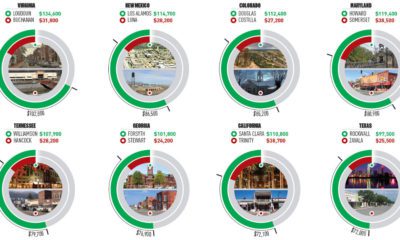

This infographic uses the measure of median household income to contrast the wealthiest and poorest counties in every U.S. state.
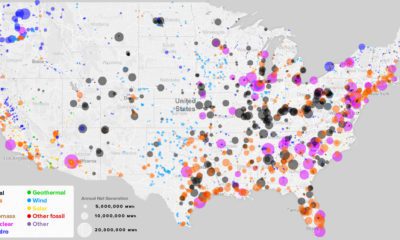

What sources of power are closest to you, and how has this mix changed over the last 10 years? See every power plant in the U.S....
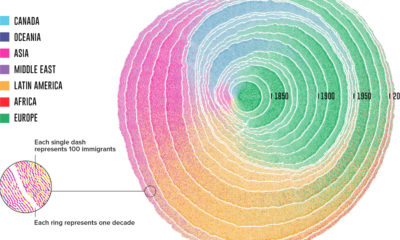

Since 1830, there have been four major waves of U.S. immigration - and this unique video depicts the influx of immigrants as rings in a tree...
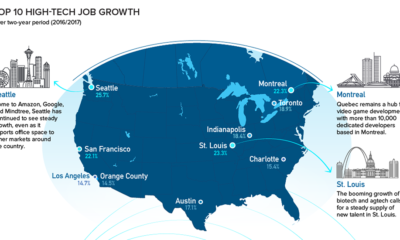

Silicon Valley is no longer the only place to be for a career in tech. Here are the fastest growing tech markets across North America, and...
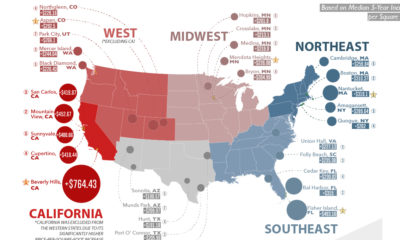

Here are the biggest increases in median housing prices (per sq. ft) over the last 5 years. See where real estate prices are rising (and falling)...
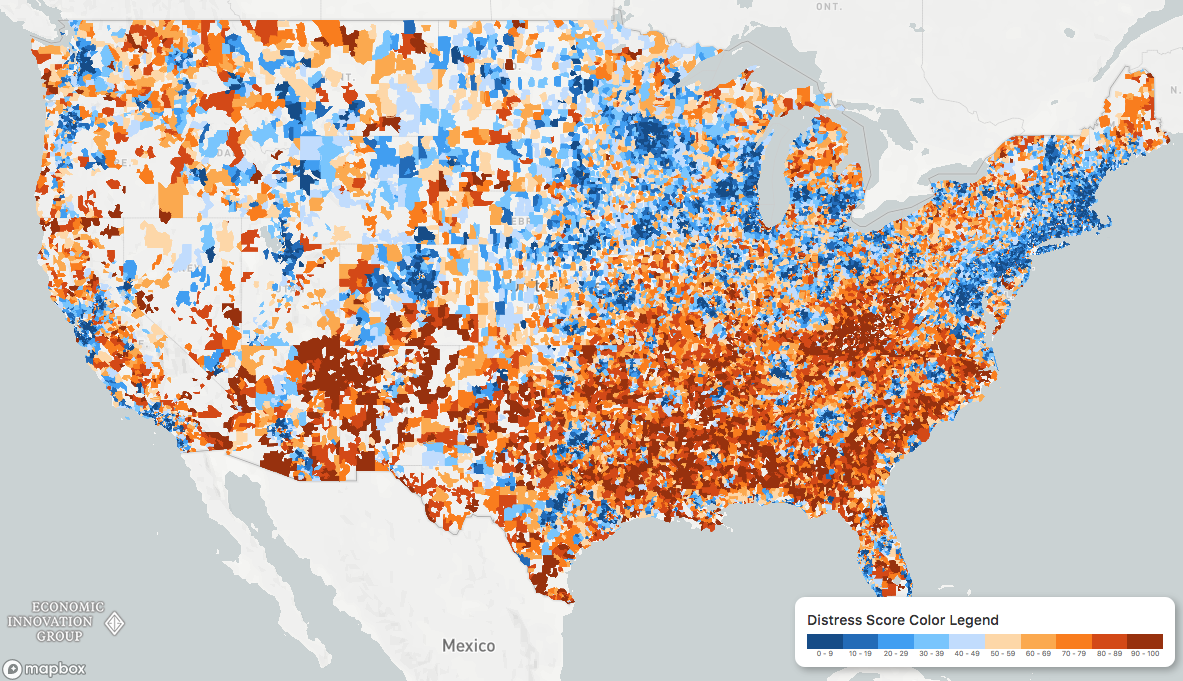
While the U.S. economic picture remains quite rosy, things change quickly when you zoom to the local level. This map shows the country's distressed communities.


