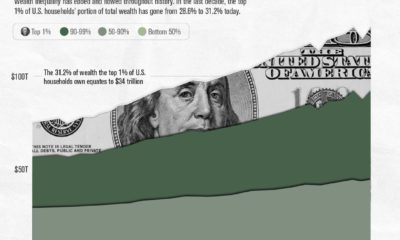

Over the past decade, the top 1% of U.S. households' portion of wealth has gone from 28.6% to 31.2%.
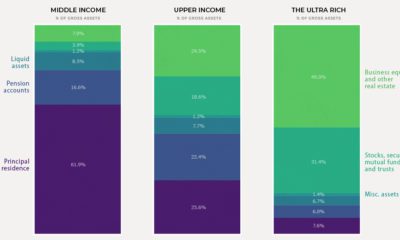

Today's chart shows how the composition of wealth tends to change as net worth increases, illustrating the building blocks that make up household net worth.
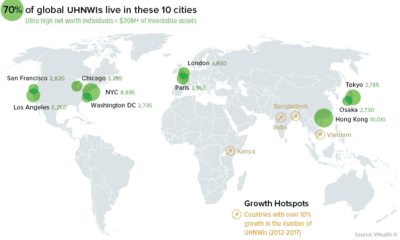

A data-driven snapshot of global wealth distribution. The average person around the world is doing better, but big-picture inequality is still staggering.


