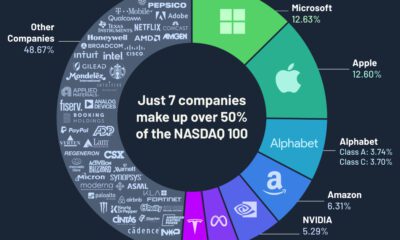

Just seven companies make up over 50% of the Nasdaq 100 by weight, and most of them are from the technology sector.


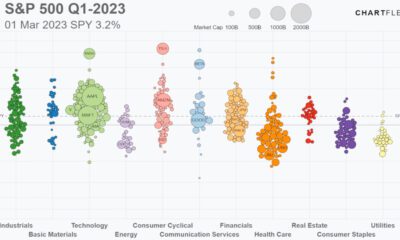
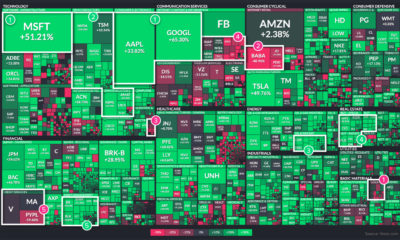
S&P 500 companies make up $34 trillion in market value combined. This graphic shows how they break down by weight and sector.

Track the S&P 500’s performance in 2023, including all 500 companies, and the sectors they belong to, in this animated video.


This infographic lists the 10 most popular stocks (or ETFs) that retail investors have been buying in 2023 so far.


The markets in 2022 were characterized by a lot more pain than gain. That said, there were winners to be found, even during a turbulent year


From the wealth held to billionaires to all debt in the global financial system, we look at the vast universe of money and markets in 2022.
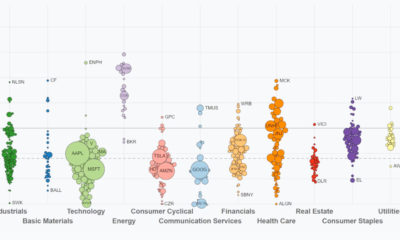

This video highlights S&P 500 performance through Q3. See how sectors and key companies have performed from Jan 1 to Sep 30, 2022.
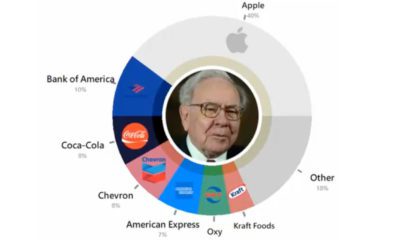

This video shows 30 years of Warren Buffett's investments, showing what his holding company, Berkshire Hathaway, has invested in since 1994.


2021 was a strong year for stocks, commodities, and cryptocurrencies, as most asset classes provided positive returns.

2021 was yet another tumultuous year. Which stock market sectors thrived during the twists and turns of the last 12 months, and which faltered?


 Creator Program