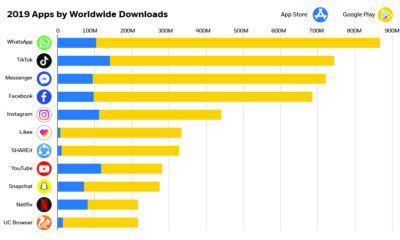

The app economy is expected to be over $6 trillion by 2021—see the world's most downloaded apps and how they're driving the future of this market.
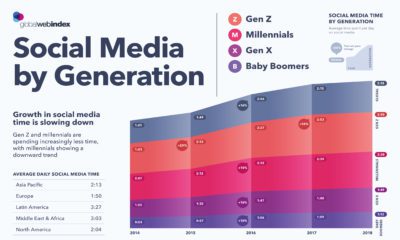

Every generation has the same desire for connection, but the way in which we connect over social media differs across age groups and regions.
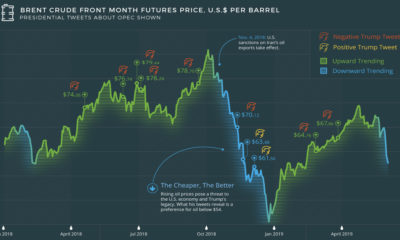

What goes through the head of a U.S. president? The tweets of U.S. President Donald Trump reveal a contentious relationship with the price of oil and...


In every internet minute, there is an extraordinary amount of activity. Wrap your head around it all with this nifty infographic.
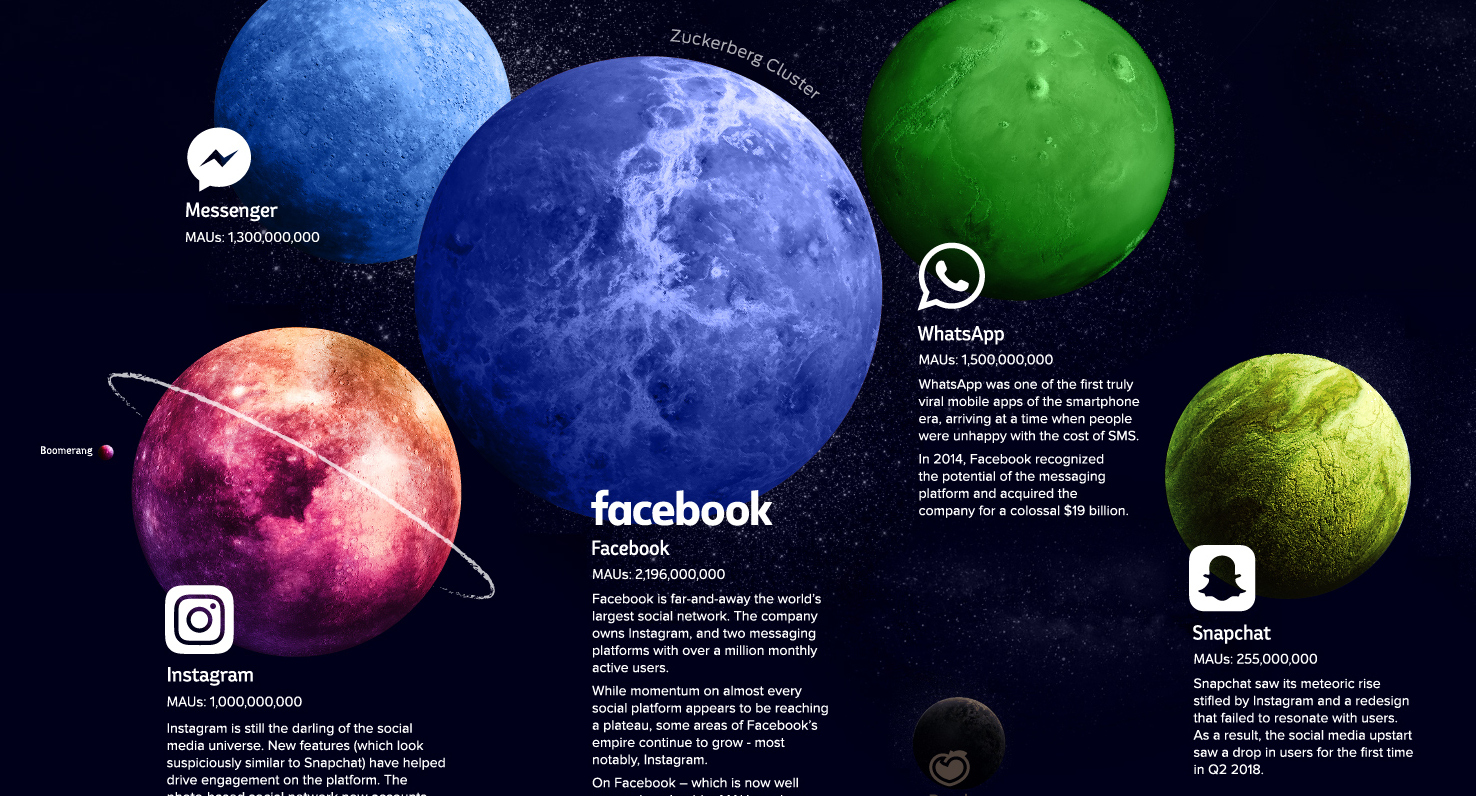
Explore the social media universe in this giant infographic, where every platform is a planet sized based on the amount of users it has.
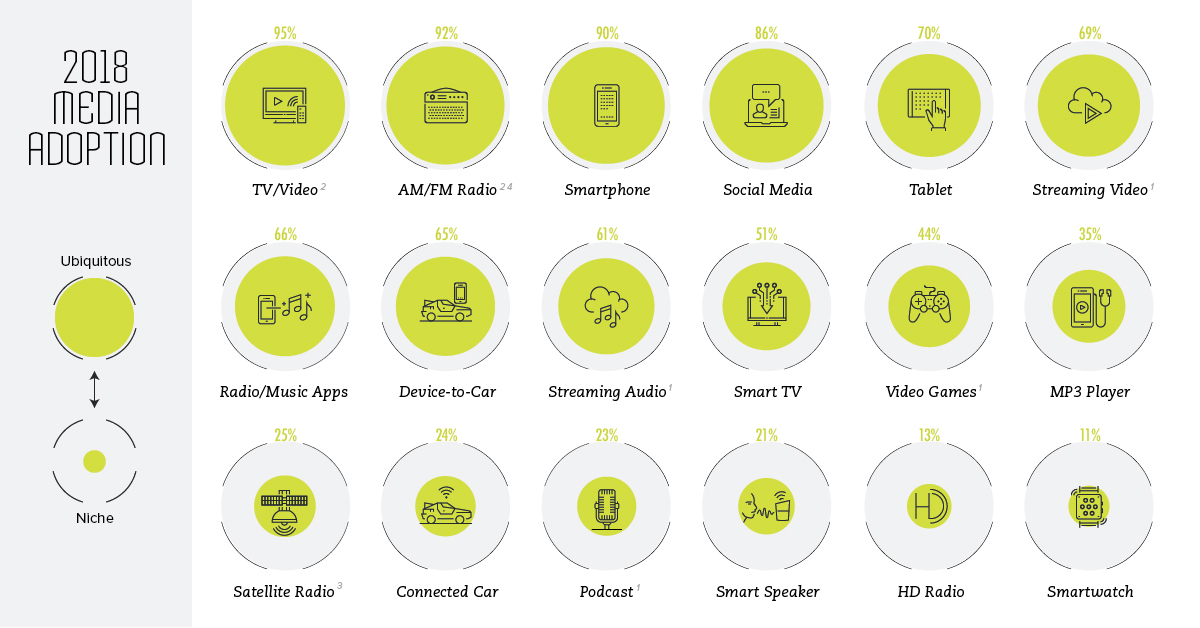
Americans spend an astonishing 12 hours per day consuming different types of media. Here are which media technologies are the most ubiquitous.
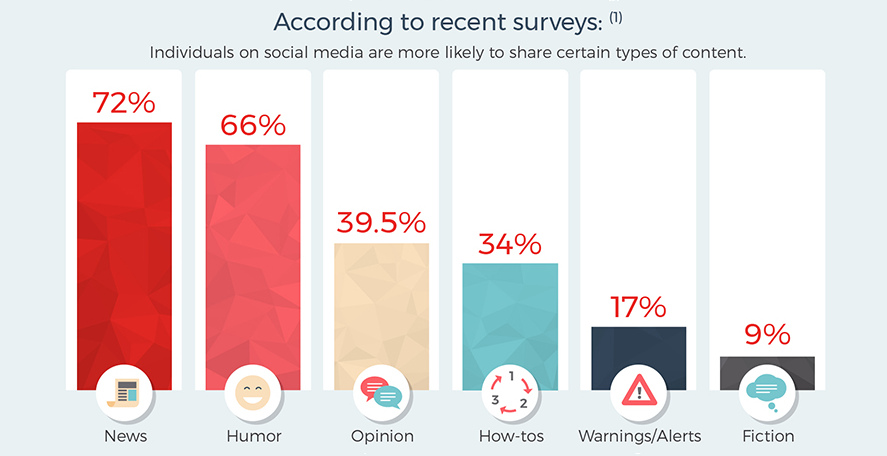
Social media is flooded with all types of content, but only a few posts get the majority of attention. Here's the science behind making things go...
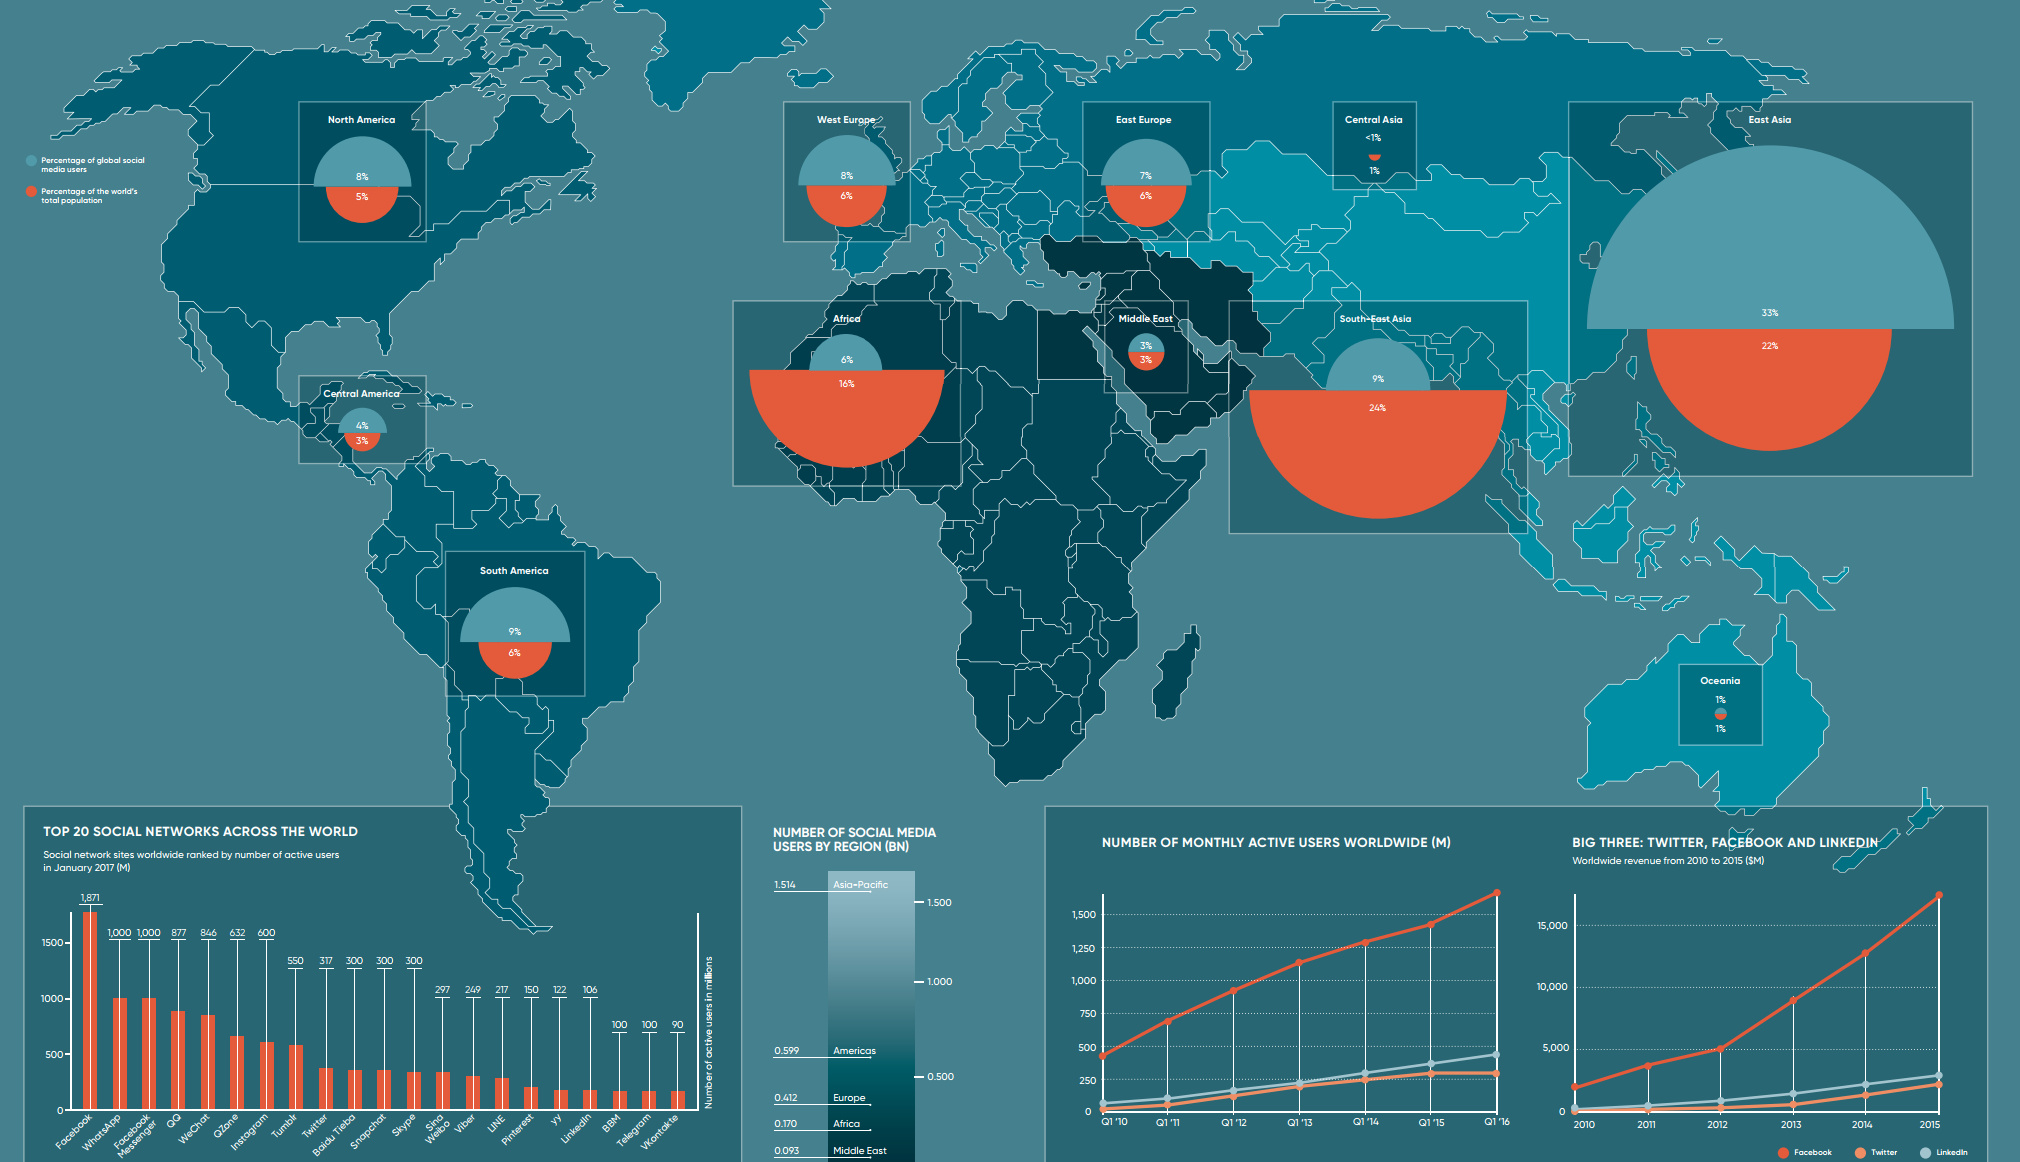
How representative is social media of actual regional geographic populations? This map compares both numbers side by side with interesting results.
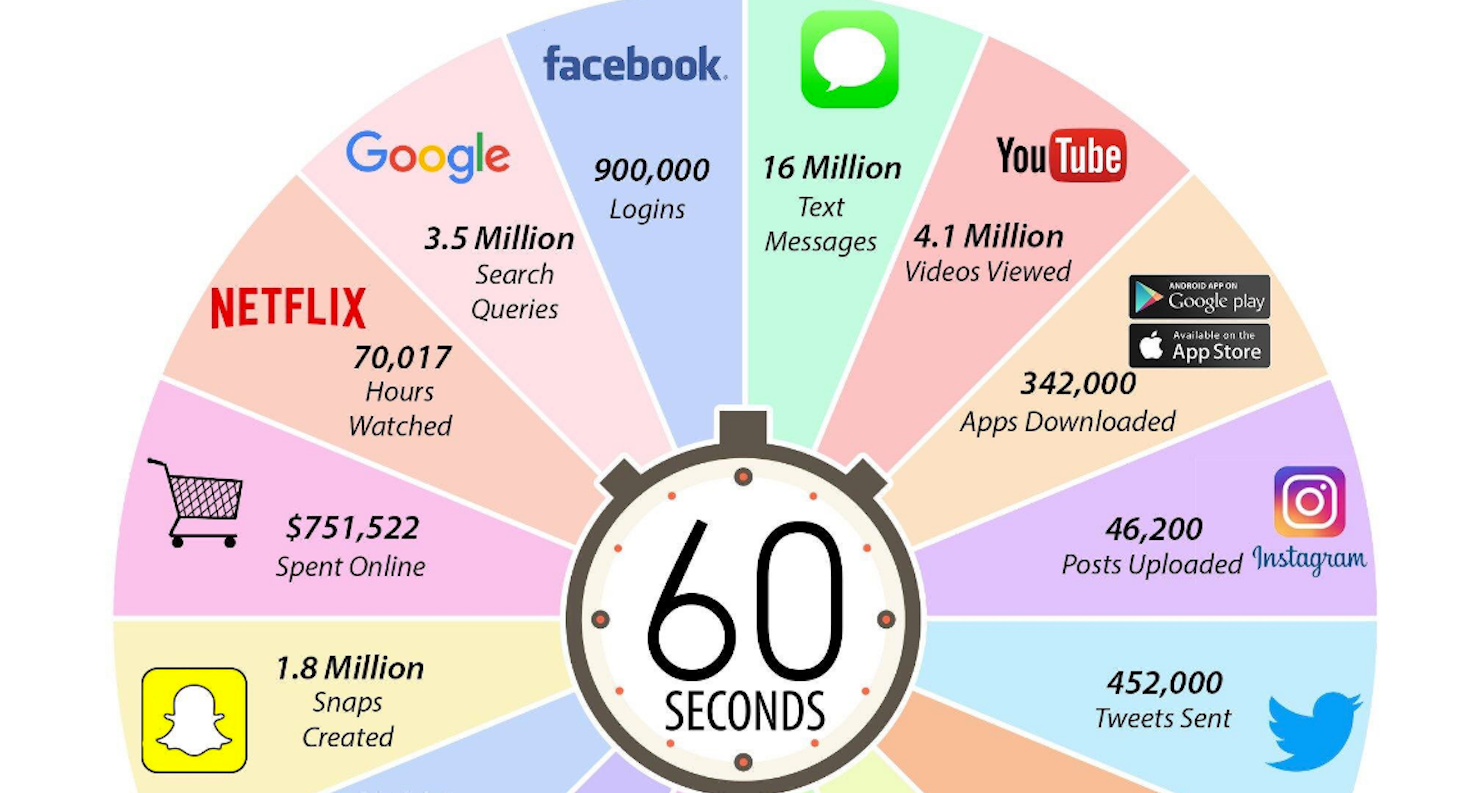
Every minute, 4.1 million videos are viewed on Youtube, nearly 1 million people log into Facebook, and $750.000 is spent on e-commerce.
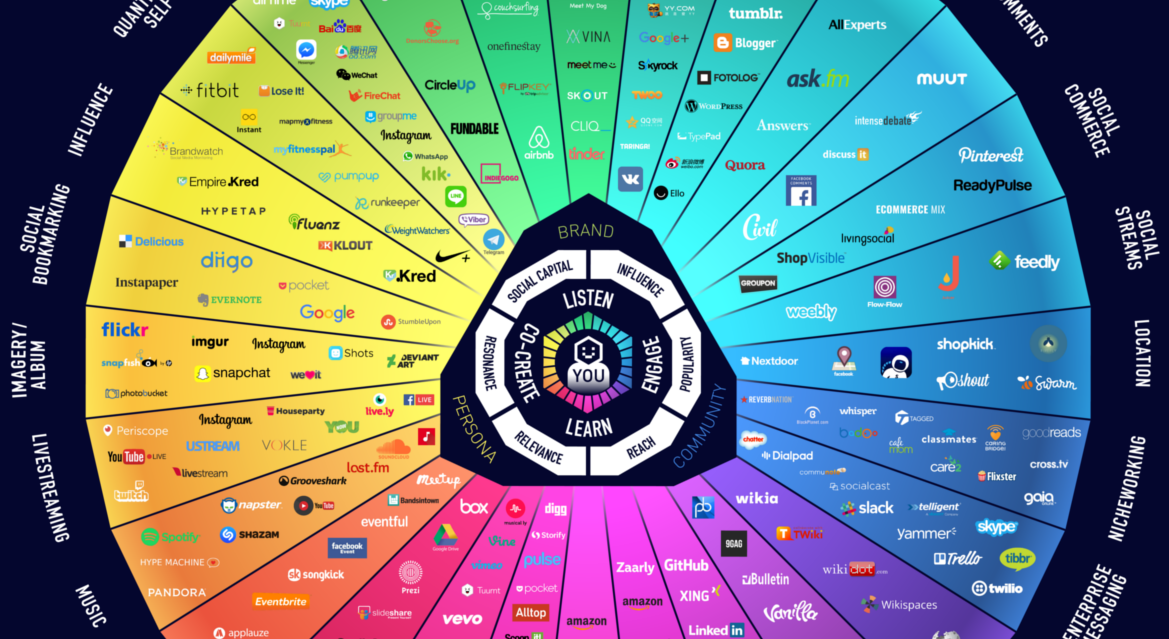
Explore the massive social media ecosystem of 2017 with this infographic, as well as how things have changed over the last 10 years.


