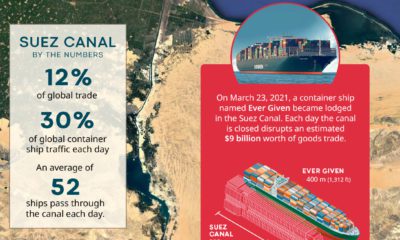

The Suez Canal is an important waterway, connecting trade between Asia and Europe. Here are the details surrounding its blockage.
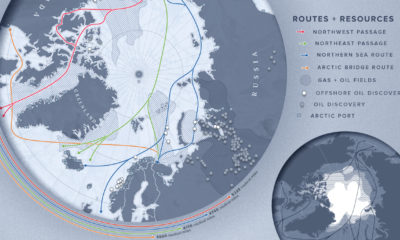

As the Arctic becomes more accessible due to reduced ice cover, countries with polar real estate increasingly viewing the region through an economic lens.
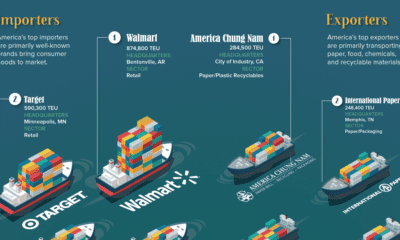

Millions of tons of cargo get moved in and out of the U.S. every day. Which companies are bringing goods in, and which are shipping them...
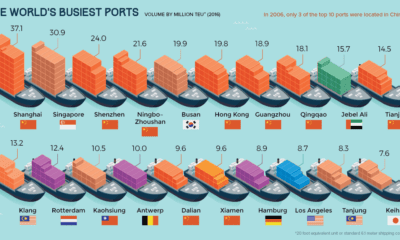

Every day, millions of tons of goods pass through ports to get to their end consumers. Here are the world's busiest ports, and how numbers have...
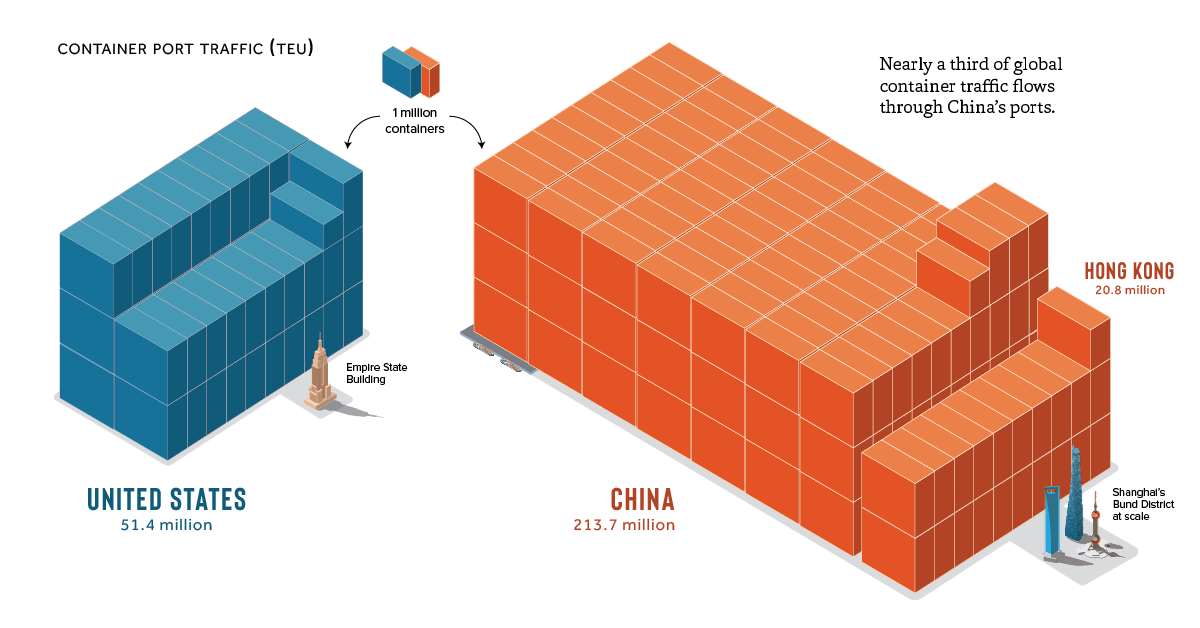
Globalization owes a lot to the humble shipping container. See the massive scale of global container shipping, and which countries are moving the most units.
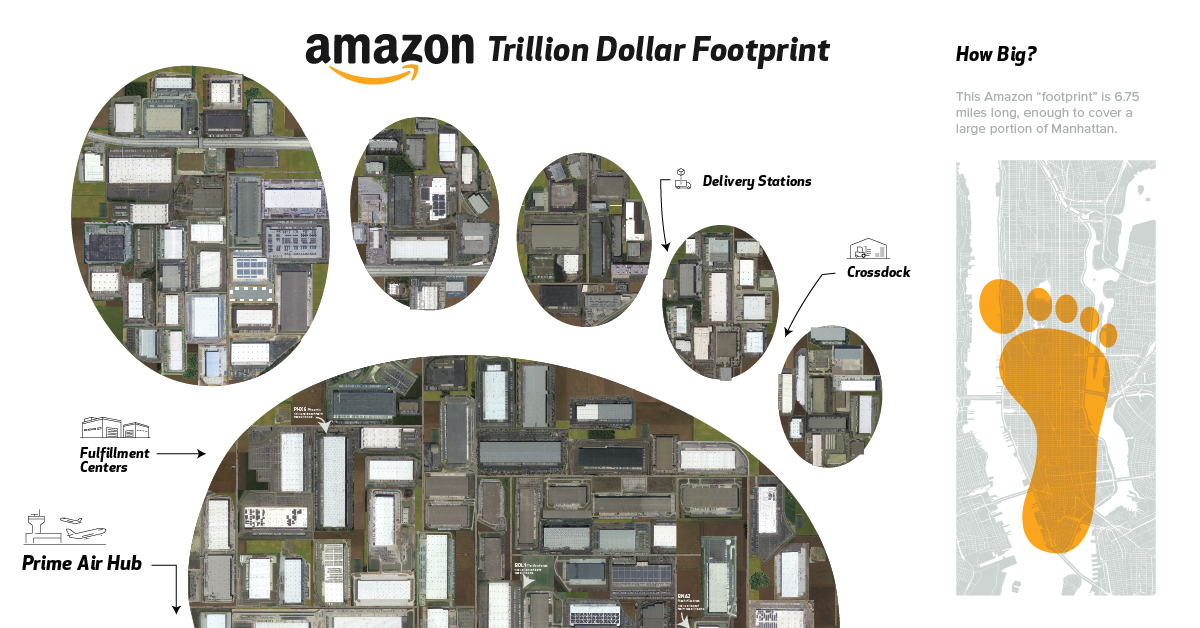
This visualization shows satellite imagery of all of Amazon's warehouses in the U.S. to put the size of its physical distribution network in perspective.
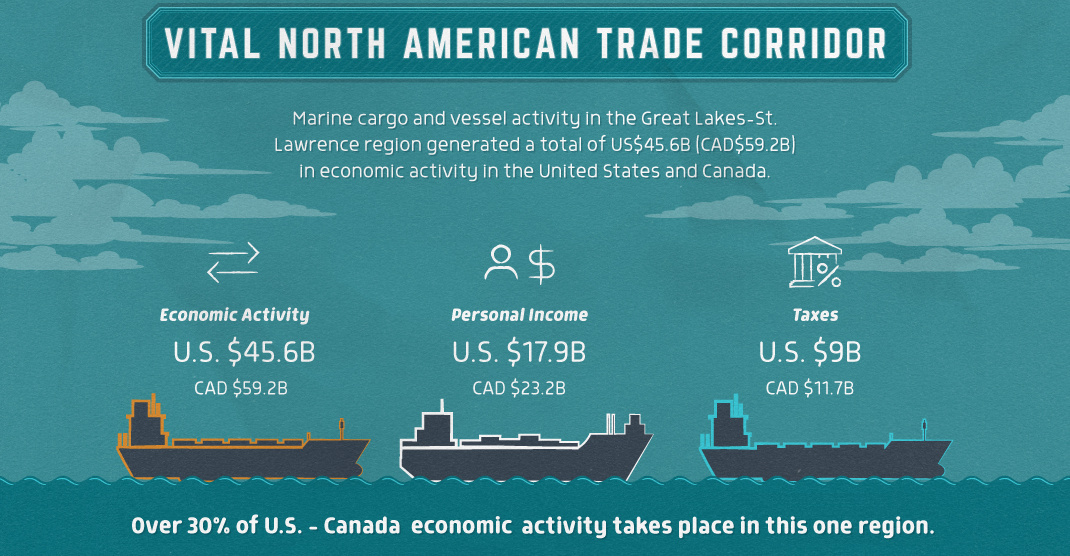
Every year, 230 million metric tonnes of cargo transits through Great Lakes-St. Lawrence waterways to generate a $45.6 billion economic impact.
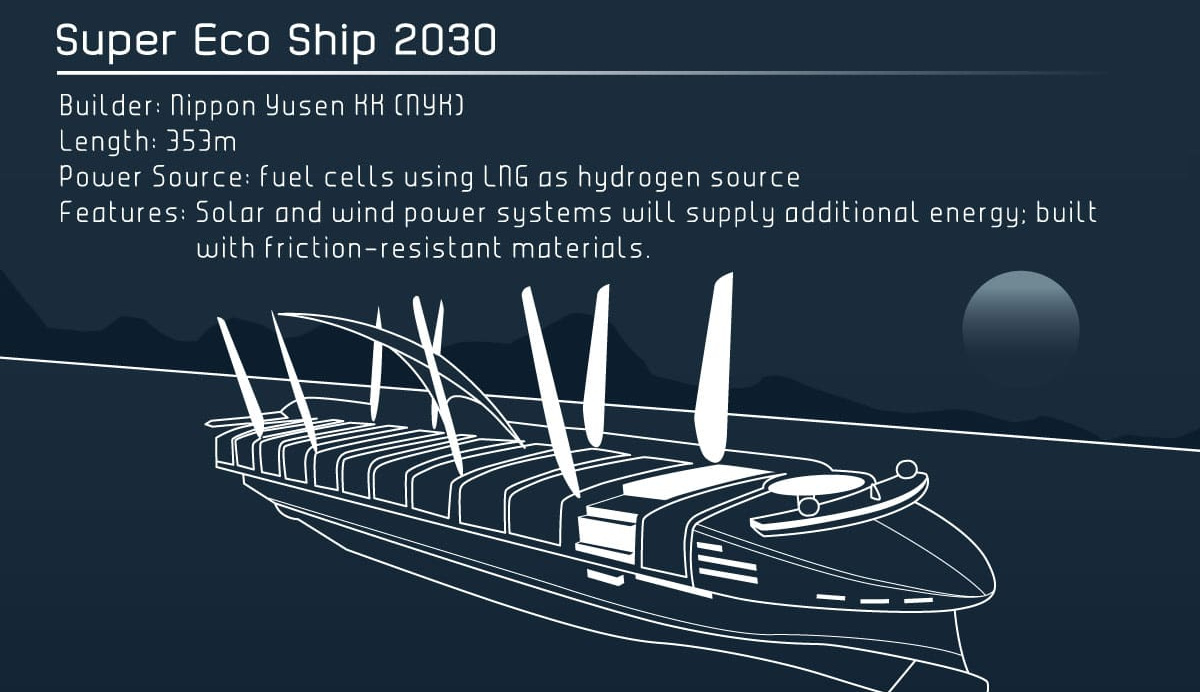
These examples of concept ships are being built to use higher amounts of AI and green energy. See the future of shipping in this infographic.
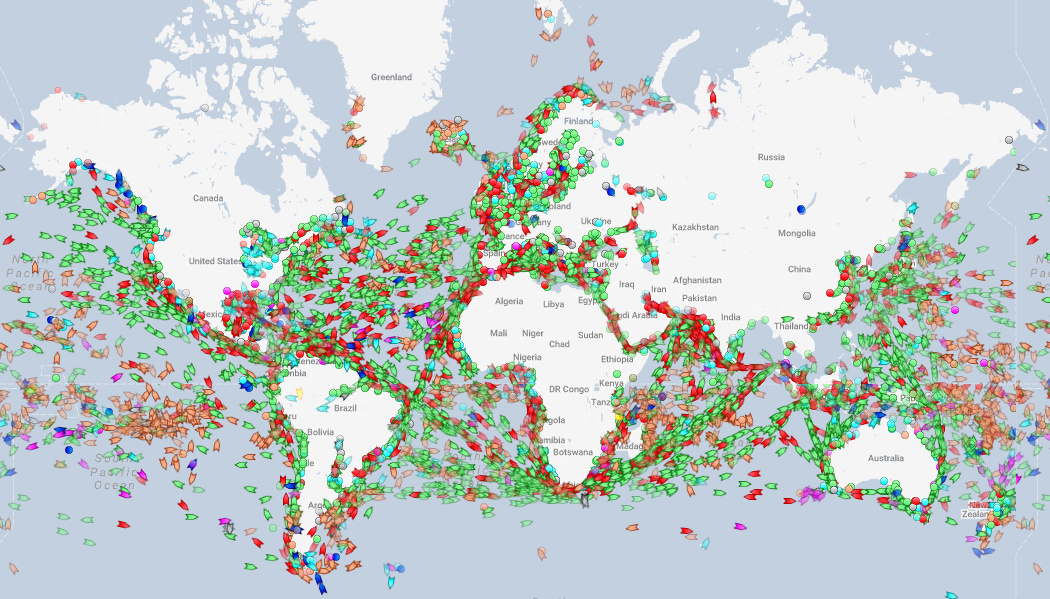
We show you a website that tracks every ship in real-time, and use it to highlight the world's oil chokepoints, the coast of Somalia, and other...
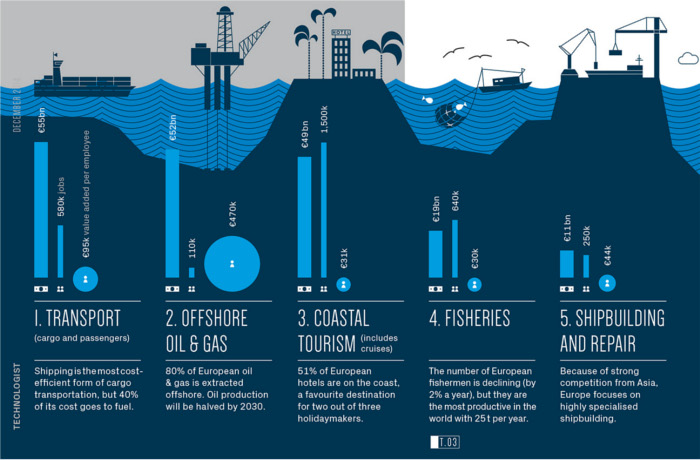
This infographic focuses on Europe, where the United Kingdom is nautical miles ahead of anyone else in terms of developing sea-related industries.


